Automated Client Reporting: A Comprehensive Guide
Reporting is an integral part of the job for agencies working on client projects. It helps demonstrate achieved results, monitor progress, and builds transparent, trusting relationships with clients. It also simplifies communication.
But the question remains, how do you make the reporting process as efficient as possible? The solution is automated reports. Let’s explore their benefits, how to set them up, and look at some reporting tools available on the market.
Let’s get started!
Key takeaways
Automated reporting benefits marketing and SEO agencies with large datasets, multiple projects, and various campaign types from different digital marketing channels. It saves teams time and resources, allowing them to focus on strategy implementation and experimentation. It also makes it easier for agencies to be transparent and consistent when working with clients.
Here is a list of the most popular and effective automated reporting tools:
- Looker Studio: This Google reporting tool allows users to create interactive dashboards and data visualizations from various data sources.
- SE Ranking’s Report Builder: This is a drag-and-drop tool that provides critical SEO data and displays it in easy-to-read graphs. Use it to create reports from scratch or choose from templates, and schedule their delivery.
- Tableau: A comprehensive business intelligence tool that enables you to analyze and present vast volumes of data on different dashboards.
- Power BI: One of the most popular business intelligence software options, this tool enables you to present reports for vast business purposes, not just for SEO or digital marketing.
After choosing your perfect reporting tool, it’s time to set up reporting:
- Establish clear KPIs to determine which information to include in the SEO report.
- Create a report layout tailored to client needs.
- Decide on the report delivery frequency and method.
- Personalize reports with branding elements.
What is automated reporting?
Automated client reporting is a process that simplifies the analysis, creation, and delivery of reports to clients.
You can automate every stage, from gathering data and organizing it into dashboards to sending them to the client via email on set dates, such as monthly or weekly.
These reports generally include key performance metrics, project updates, and insights relevant to the client’s business or project.
If you work at a digital marketing or SEO agency and handle large datasets, multiple projects, and several campaign types across different marketing channels, automated reporting can help. It saves you time and resources, which can then be used for other tasks, inlcuding the execution of marketing strategies or conducting marketing experiments.
Benefits of reporting automation for agencies
Automated reporting helps with streamlining agency work, saving your team ample time and resources. It also provides clear information, simplifies the scaling of operations while demonstrating your professionalism to clients. Let’s explore these benefits below.
Data accuracy & transparency
Automated solutions collect data directly from multiple databases, reducing the risk of errors that tend to arise during manual data collection.
Imagine an agency manually compiling data from multiple platforms to create a client report. This process increases the likelihood of human error, such as entering incorrect numbers or leaving out important data points. With reporting automation, the system effortlessly extracts data from each platform and compile it into a comprehensive report. This boosts accuracy and reduces the risk of errors.
Additionally, automated tools typically retrieve real-time data. This creates transparency in all actions and figures, which is especially beneficial when your agency manages multiple clients.
Cost & time saving
Typically, agencies send client reports monthly (and sometimes weekly) to demonstrate results. But the reporting process can be a significant time investment for your team when you are juggling between 30 and 40 client projects. It can also lead to substantial annual expenses for your agency.
Assuming that the average hourly cost of an SEO analyst is $25 and they spend at least 1 hour per day on reporting, the weekly cost savings for your agency for each report is $175. This translates into yearly cost benefits of $9,100. Additionally, according to Gartner research, report automation could save you 25,000 hours of avoidable work each year.
So, rather than spending time on the reporting process, focus on acquiring new clients and increasing your capital and project experience.
Easier to scale
Agencies are always looking to grow and scale, which is why they are constantly searching for new clients.
Automated reporting streamlines interaction with existing clients and addresses potential issues with new ones. When all processes are clearly established and they work well with your existing clients, it’s good practice to apply the same structure to new ones. This means you won’t spend more time on reporting, even if the number of projects you’re working on increases.
Consistent & responsible process
Consistency is crucial for effective client reports. You must measure the same metrics in the same way. Otherwise, you risk having unreliable and inaccurate data, and metrics that you can’t compare. Creating reports manually also makes it difficult to keep things consistent. Every team member is unique and may have their own way of presenting information. This makes report automation essential.
Automated reporting tools: your selection guide
While there are numerous tools on the market that can help you automate reporting, this list focuses on the most popular and effective ones. Carefully review this list to select the most relevant solutions for your agency.
Pros
- ✅ Data integration with 100+ platforms.
- ✅ Advanced customization and visualization capabilities.
- ✅ Wide range of pre-built templates.
- ✅ Simplifies project sharing and collaboration.
- ✅ Free solution.
Cons
- ➖ Not easy to combine data from different sources in a single view.
- ➖Large datasets or frequent data refreshes can sometimes result in slower performance or incomplete data visualizations.
- ➖ Lacks other SEO tools and key features for agencies.
Pros
- ✅ Get all the SEO data you need.
- ✅ Extensive customization options.
- ✅ Smooth integration with Google Analytics, GSC, or Matomo.
- ✅ Ability to schedule report deliveries for your clients.
- ✅ 12 ready-to-use report templates.
- ✅ User-friendly reports and easy setup process.
- ✅ Extra features for agencies and SEO specialists.
Cons
- ➖ No free version (except for a 14-day trial).
- ➖ Only provides data on SEO.
Pros
- ✅ Connects to various data sources seamlessly.
- ✅ Offers a variety of ready-made templates.
- ✅ Features a comprehensive drag-and-drop interface.
- ✅ Ability to report on more than just digital marketing.
- ✅ Option to combine data from different sources into a single dashboard.
Cons
- ➖Source connections can be hard to grasp.
- ➖No White Label feature available.
- ➖No additional SEO tools or extra features for agencies.
- ➖ No free version (except for a trial).
Pros
- ✅ Useful for many business needs, not just SEO or digital marketing.
- ✅ Advanced editing tools for customization.
- ✅ Easy data sharing options.
- ✅ Different pricing plans, including a free version with limited features.
Cons
- ➖ Expensive full-featured version.
- ➖ Has a steep learning curve, especially for users who are not familiar with data analytics.
- ➖No White Label feature available.
Pros
- ✅ Convenient for gathering tons of data.
- ✅ Covers all of your agency’s unique needs.
Cons
- ➖ Requires a dedicated development team, and substantial time investment and effort.
- ✅ Data integration with 100+ platforms.
- ✅ Advanced customization and visualization capabilities.
- ✅ Wide range of pre-built templates.
- ✅ Simplifies project sharing and collaboration.
- ✅ Free solution.
- ➖ Not easy to combine data from different sources in a single view.
- ➖Large datasets or frequent data refreshes can sometimes result in slower performance or incomplete data visualizations.
- ➖ Lacks other SEO tools and key features for agencies.
- ✅ Get all the SEO data you need.
- ✅ Extensive customization options.
- ✅ Smooth integration with Google Analytics, GSC, or Matomo.
- ✅ Ability to schedule report deliveries for your clients.
- ✅ 12 ready-to-use report templates.
- ✅ User-friendly reports and easy setup process.
- ✅ Extra features for agencies and SEO specialists.
- ➖ No free version (except for a 14-day trial).
- ➖ Only provides data on SEO.
- ✅ Connects to various data sources seamlessly.
- ✅ Offers a variety of ready-made templates.
- ✅ Features a comprehensive drag-and-drop interface.
- ✅ Ability to report on more than just digital marketing.
- ✅ Option to combine data from different sources into a single dashboard.
- ➖Source connections can be hard to grasp.
- ➖No White Label feature available.
- ➖No additional SEO tools or extra features for agencies.
- ➖ No free version (except for a trial).
- ✅ Useful for many business needs, not just SEO or digital marketing.
- ✅ Advanced editing tools for customization.
- ✅ Easy data sharing options.
- ✅ Different pricing plans, including a free version with limited features.
- ➖ Expensive full-featured version.
- ➖ Has a steep learning curve, especially for users who are not familiar with data analytics.
- ➖No White Label feature available.
- ✅ Convenient for gathering tons of data.
- ✅ Covers all of your agency’s unique needs.
- ➖ Requires a dedicated development team, and substantial time investment and effort.
Google Looker Studio
Google Looker Studio is the most popular automated reporting tool on this list. It provides dynamic dashboards with graphs and tabs to help you collect and visualize all the data you need in an appealing and convenient format. These dashboards provide access to interactive key performance metrics to offer users a holistic view while integrating historical and real-time data. Here are this tool’s biggest advantages:
- Data integration. With Looker Studio, you don’t need to know how to program to report on data from different sources. It just takes a few minutes to connect to Google’s top platforms, including Search Console, Analytics, Google Ads, YouTube, and BigQuery. It also lets you export data from database management systems like MySQL and PostgreSQL, and even social media platforms like Facebook, Reddit, and Twitter. Looker Studio also offers templates for popular tools and databases.
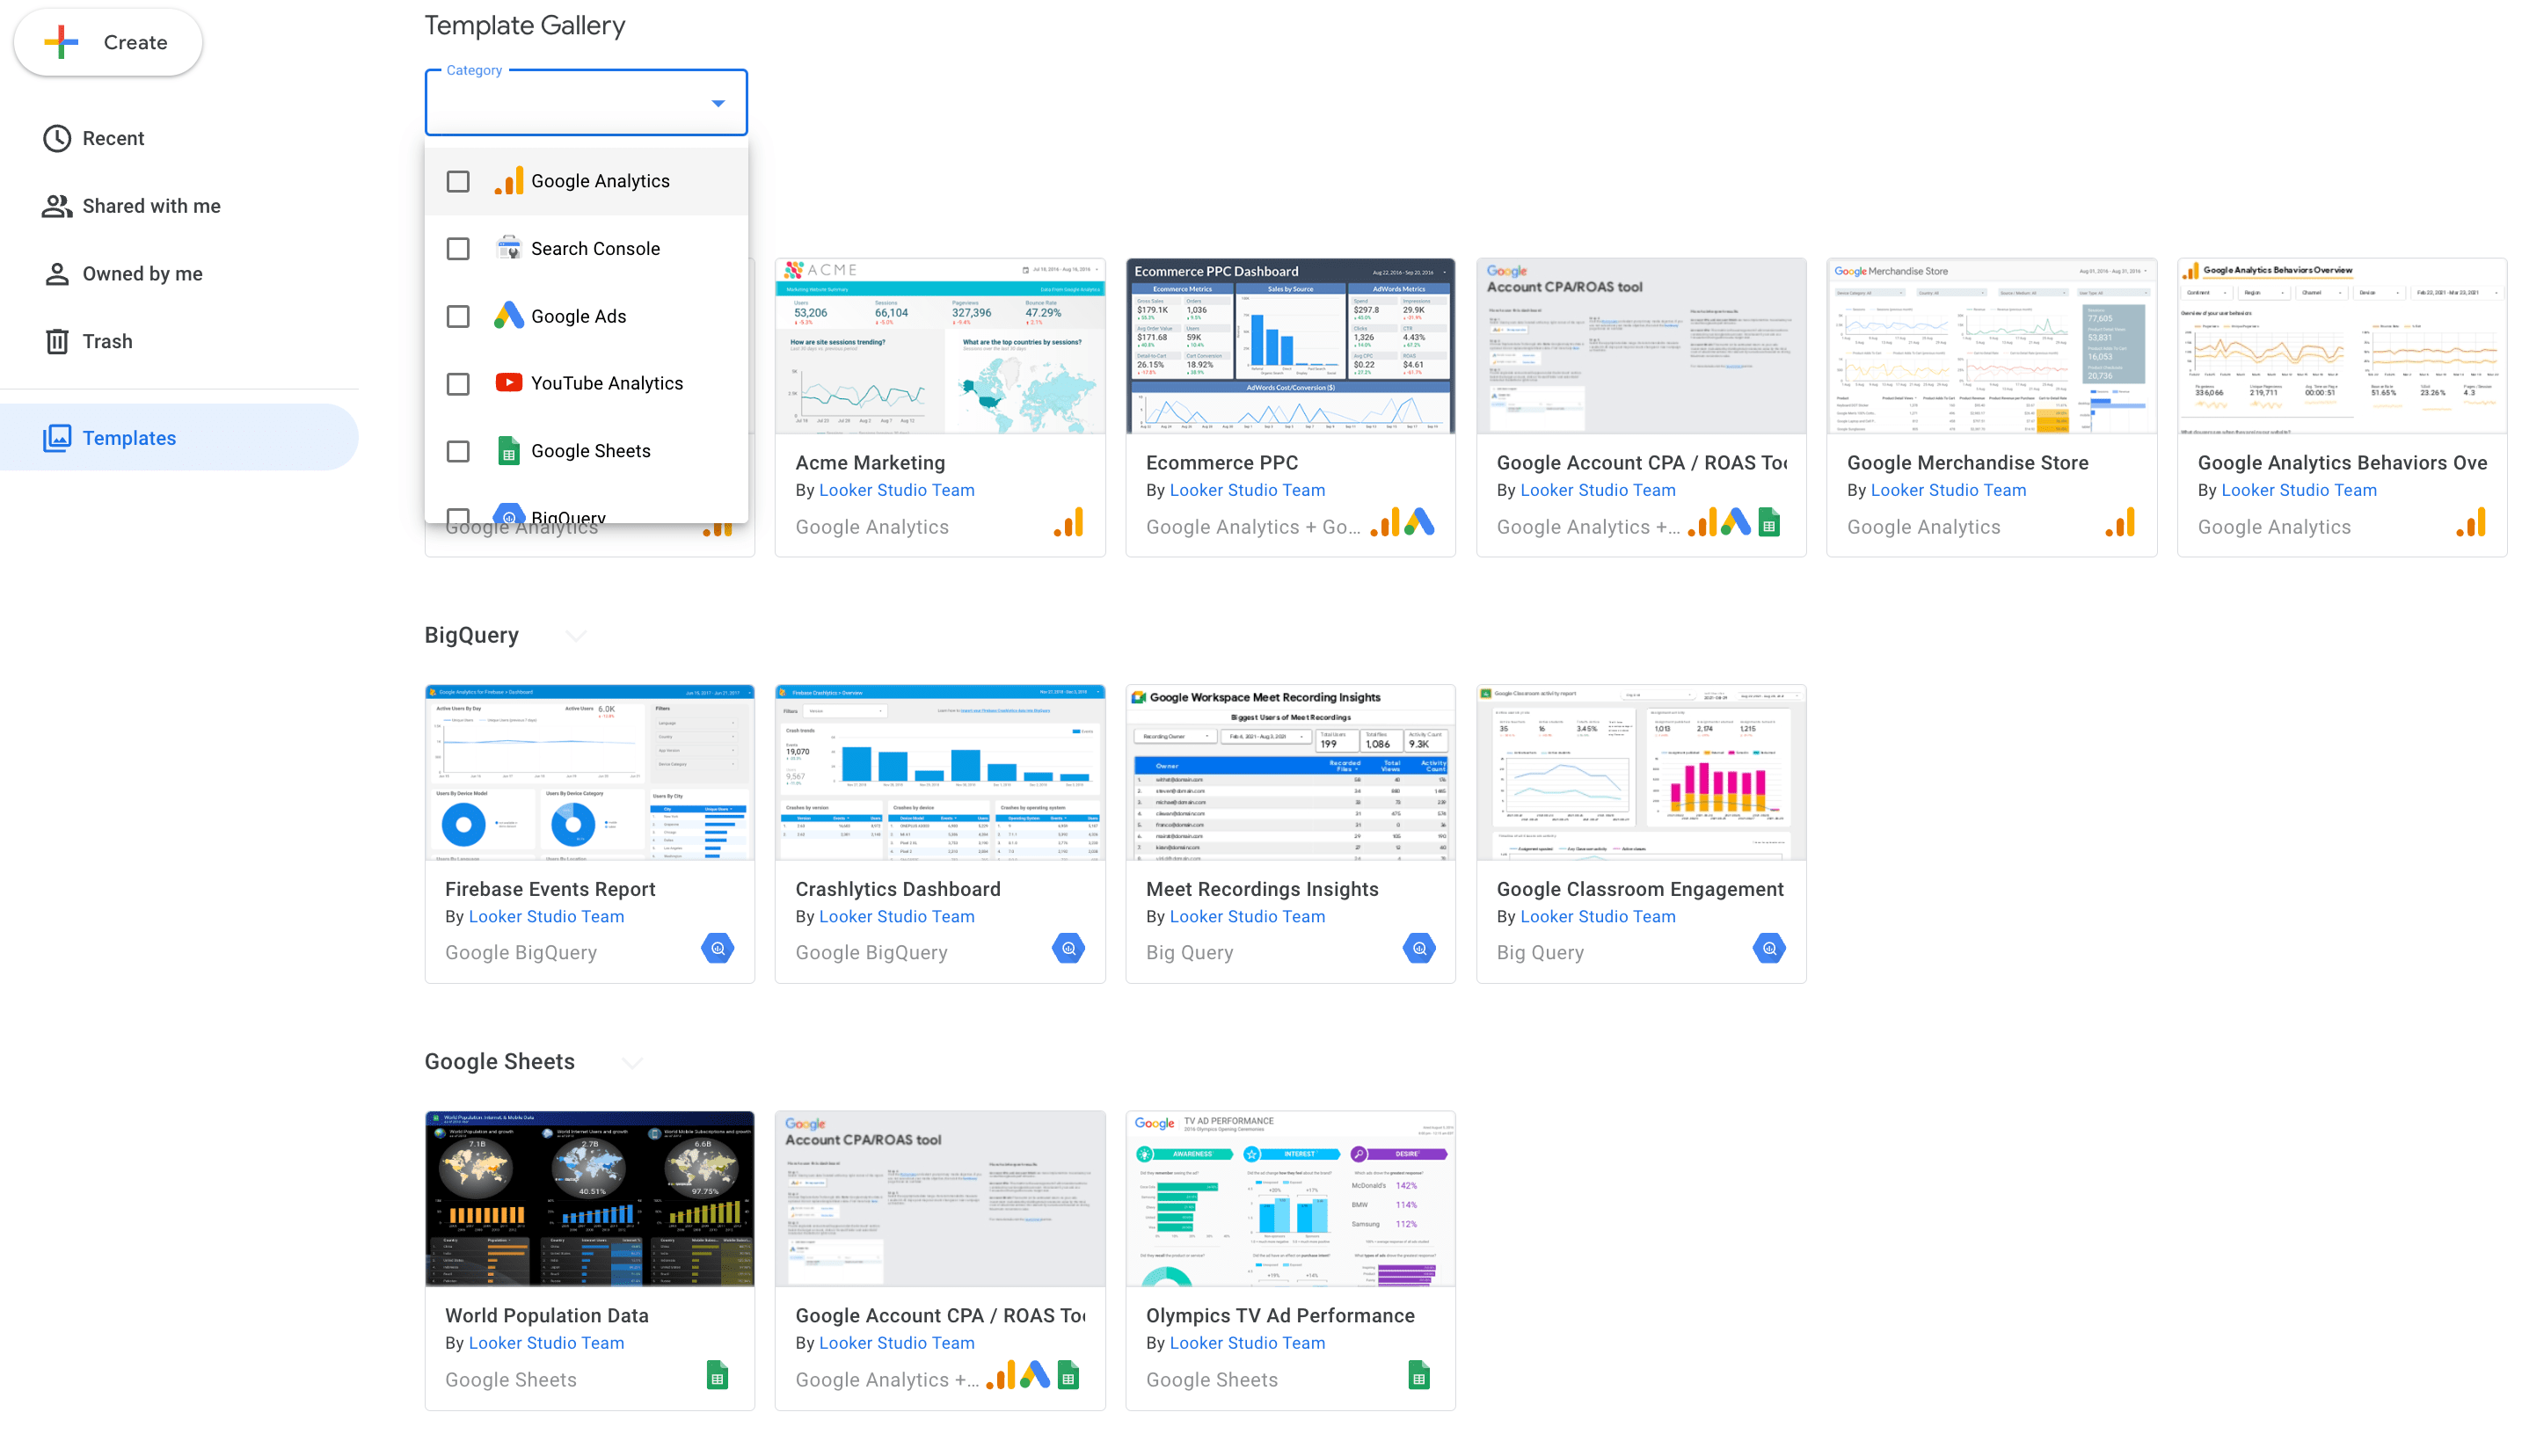
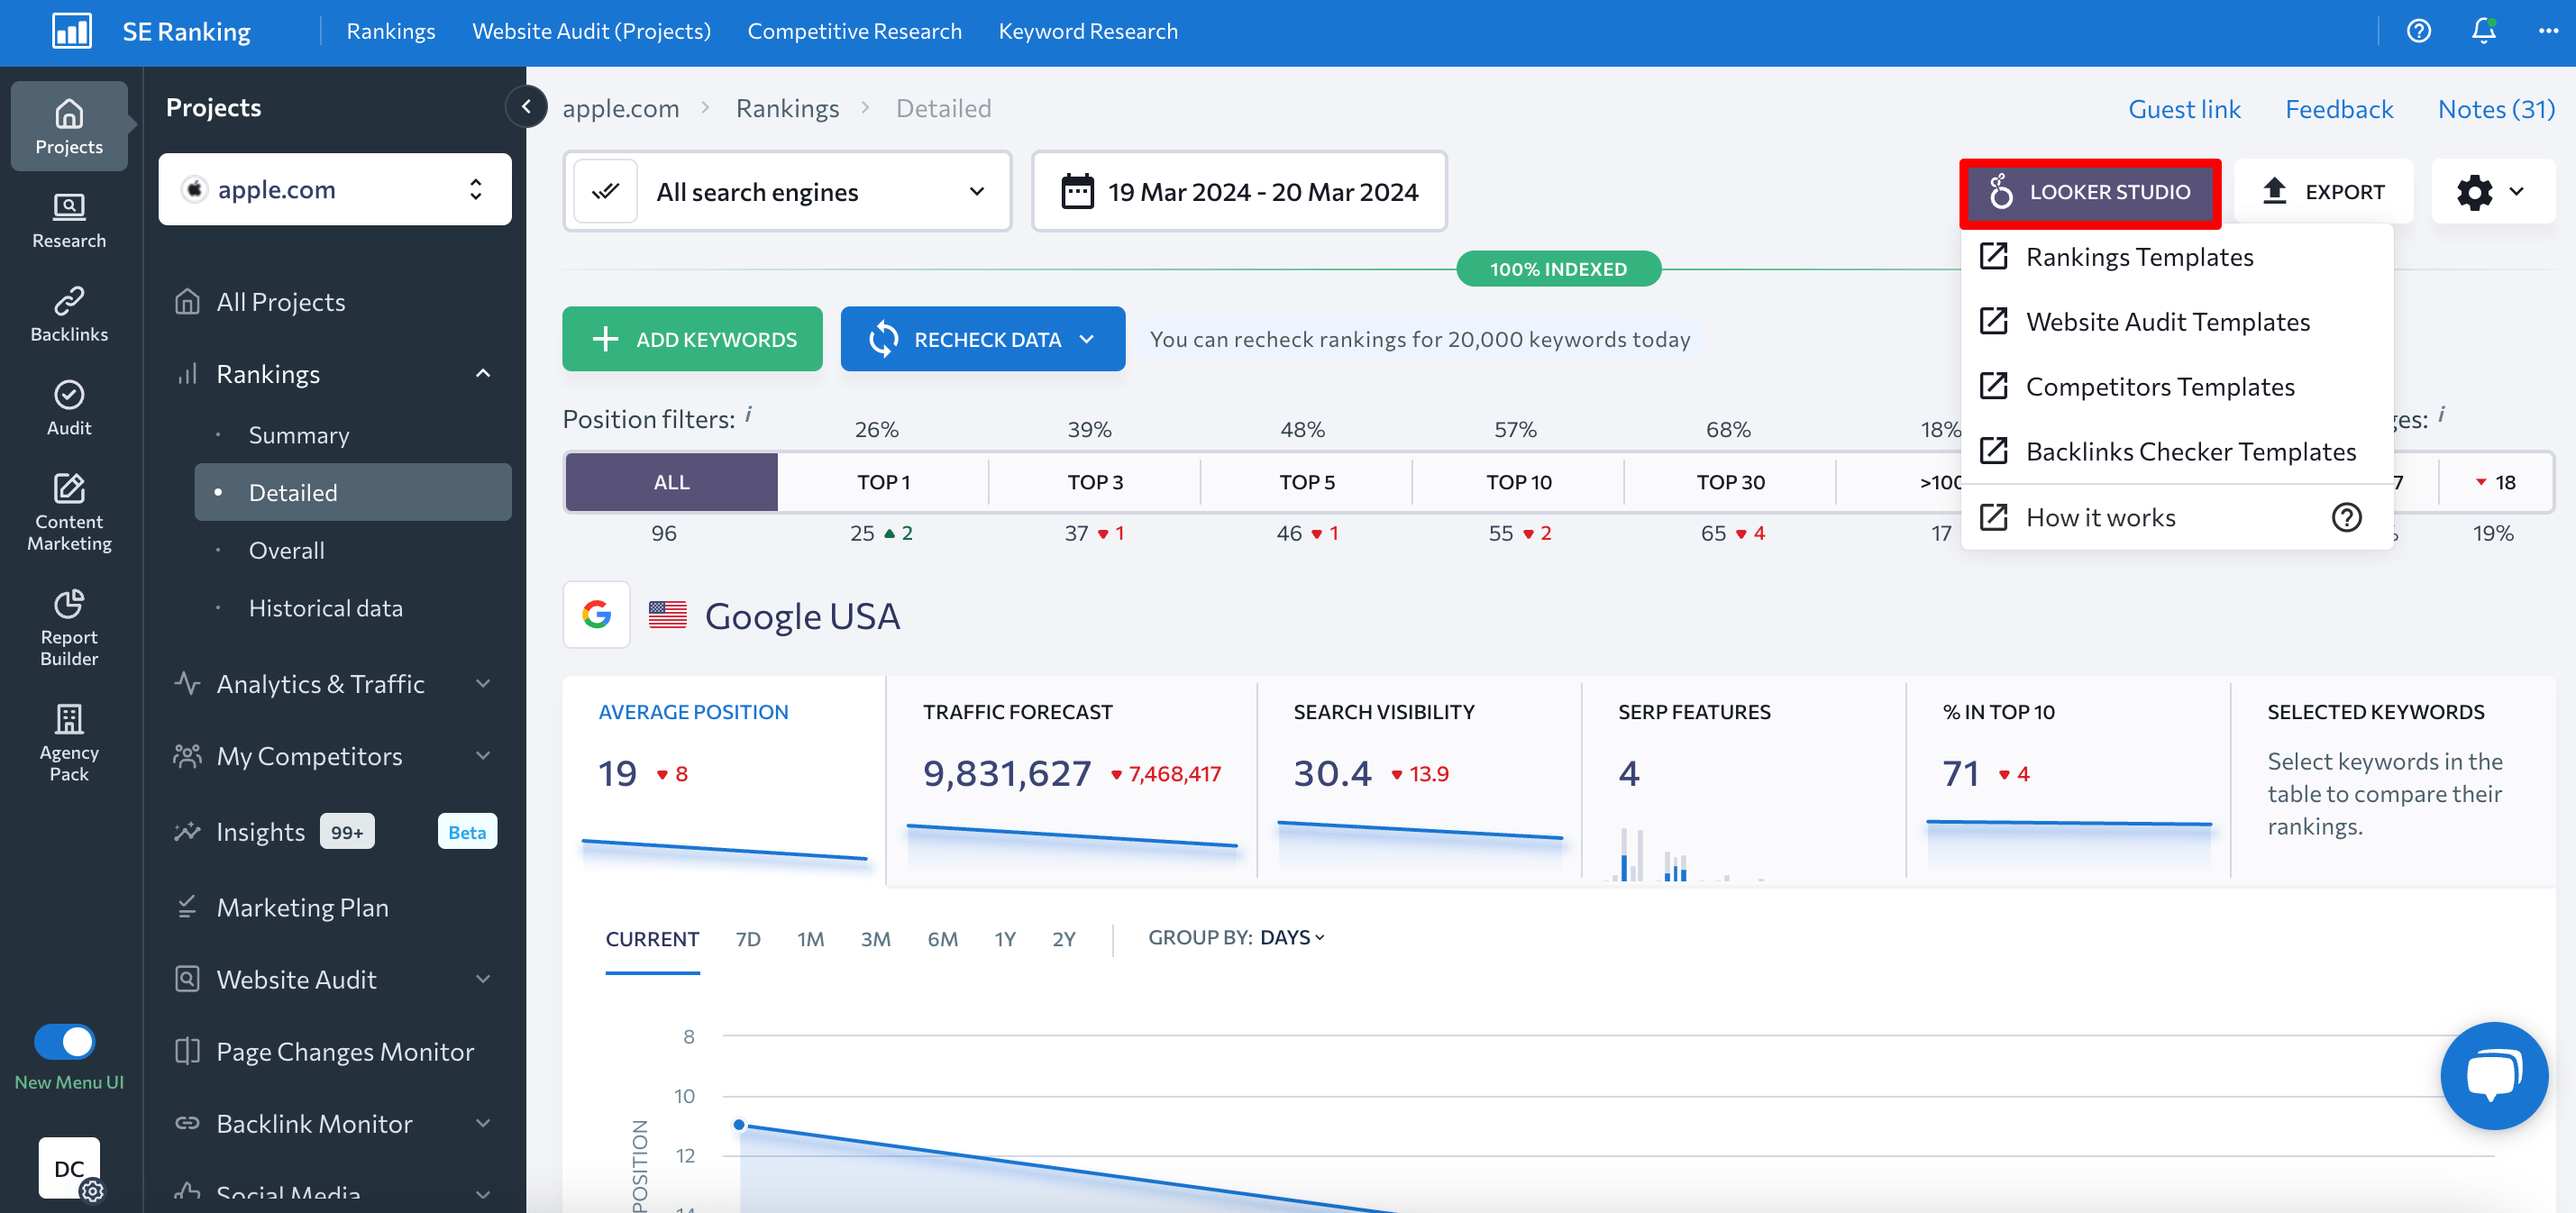
One of Looker Studio’s greatest advantages is that it lets you gather data from different platforms (not only popular ones) whose databases have been integrated into the tool. For example, in SE Ranking, you can easily connect your data to Looker Studio for display. Learn how to integrate Looker Studio with SE Ranking in this guide.
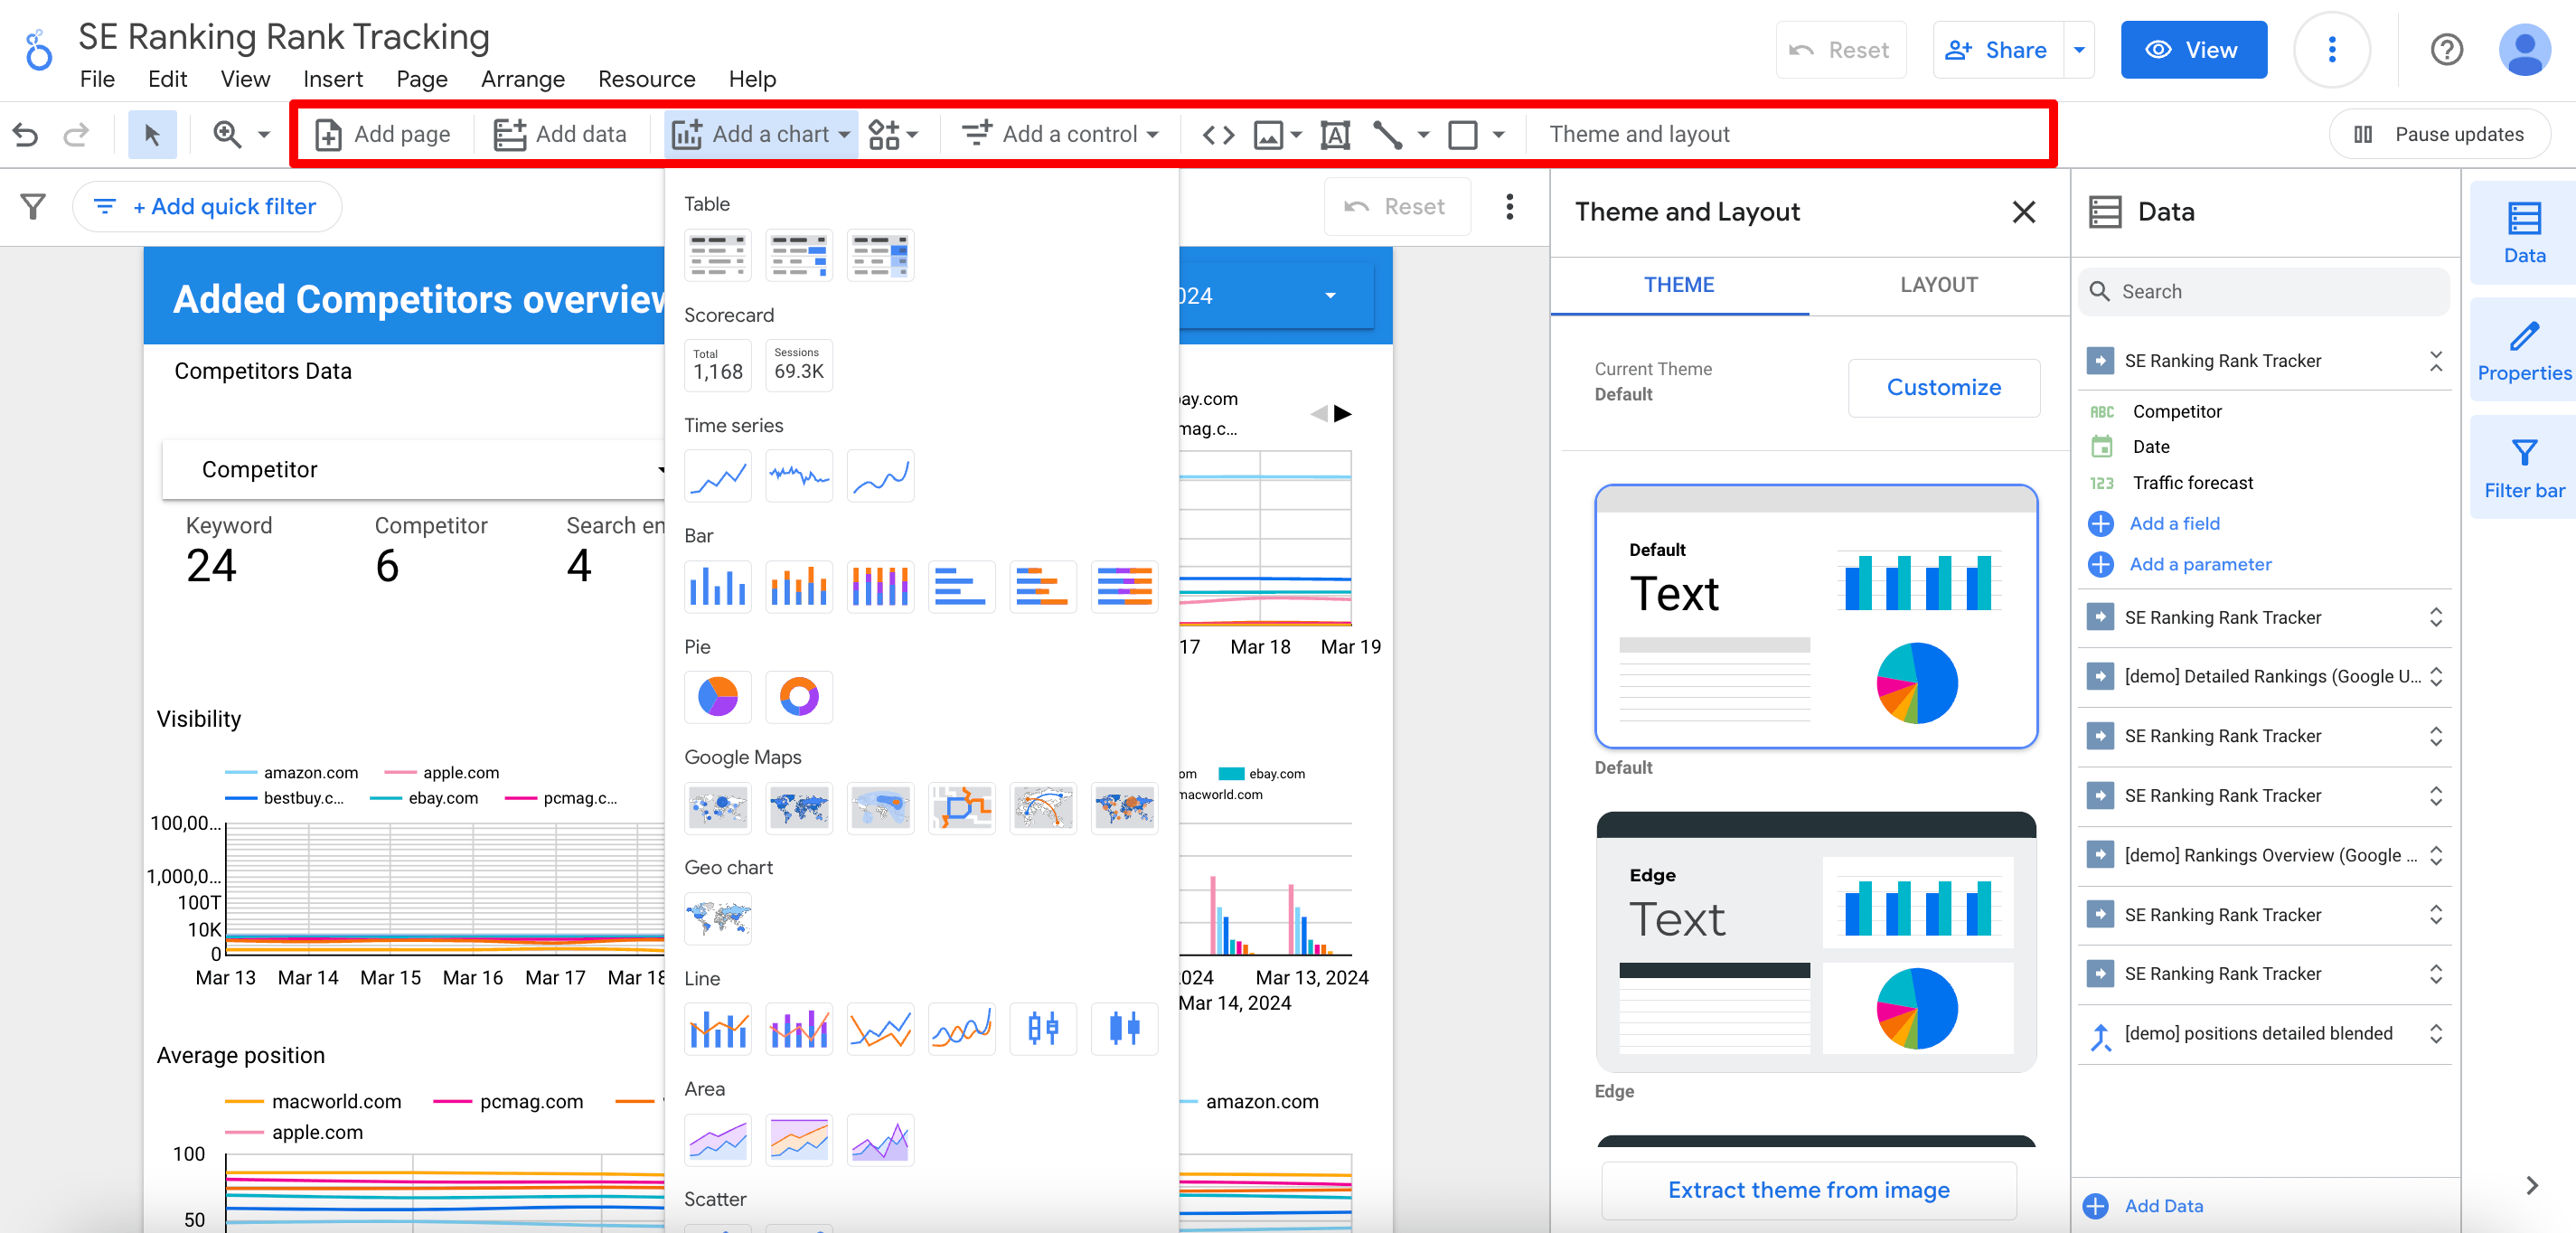
- Customization and visualization. Looker Studio transforms data into informative, easy-to-read, and fully customizable dashboards and reports. This enables agencies to present complex data in the most meaningful way to clients. The drag-and-drop feature allows you to add charts, geo-maps, and data tables, change the colors of any element, and apply styles and color themes. It also makes it easy to include links, clickable images, and notes. Viewer filters and date range controls make any report flexible, ensuring that anyone can access and analyze their data.
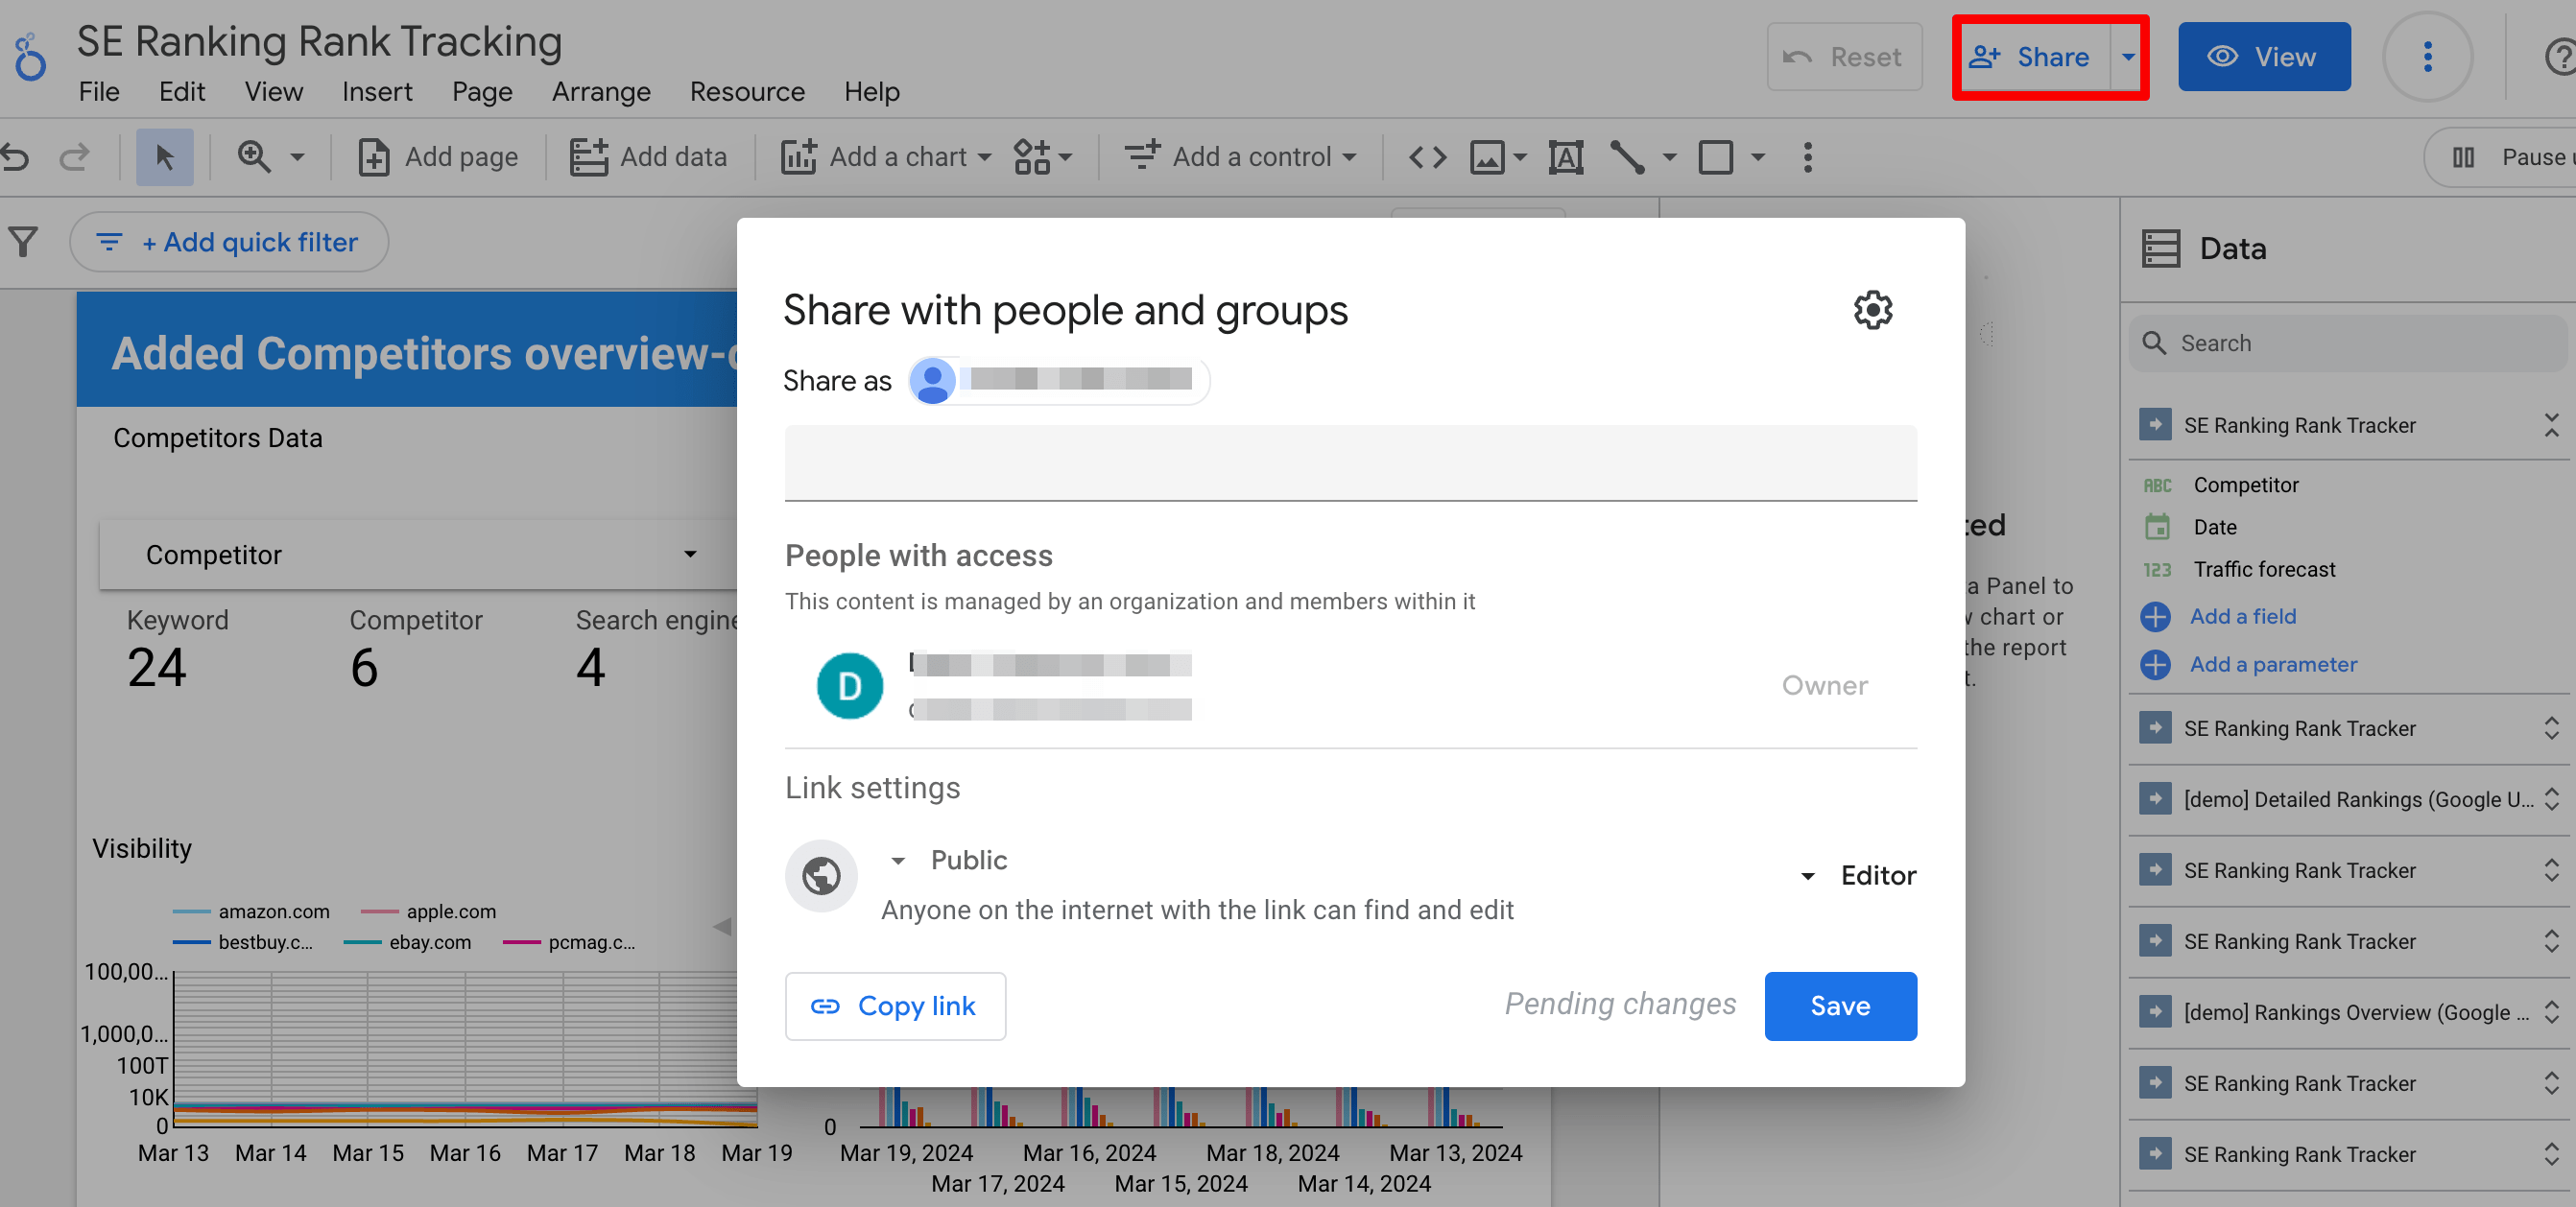
- Easy to share and collaborate. Looker Studio is the way to go if you want to be extra transparent about sharing data with your clients and team. Inviting others to view or edit reports and scheduling emails (with dashboards) is easy with Looker Studio.
SE Ranking’s dashboards and templates
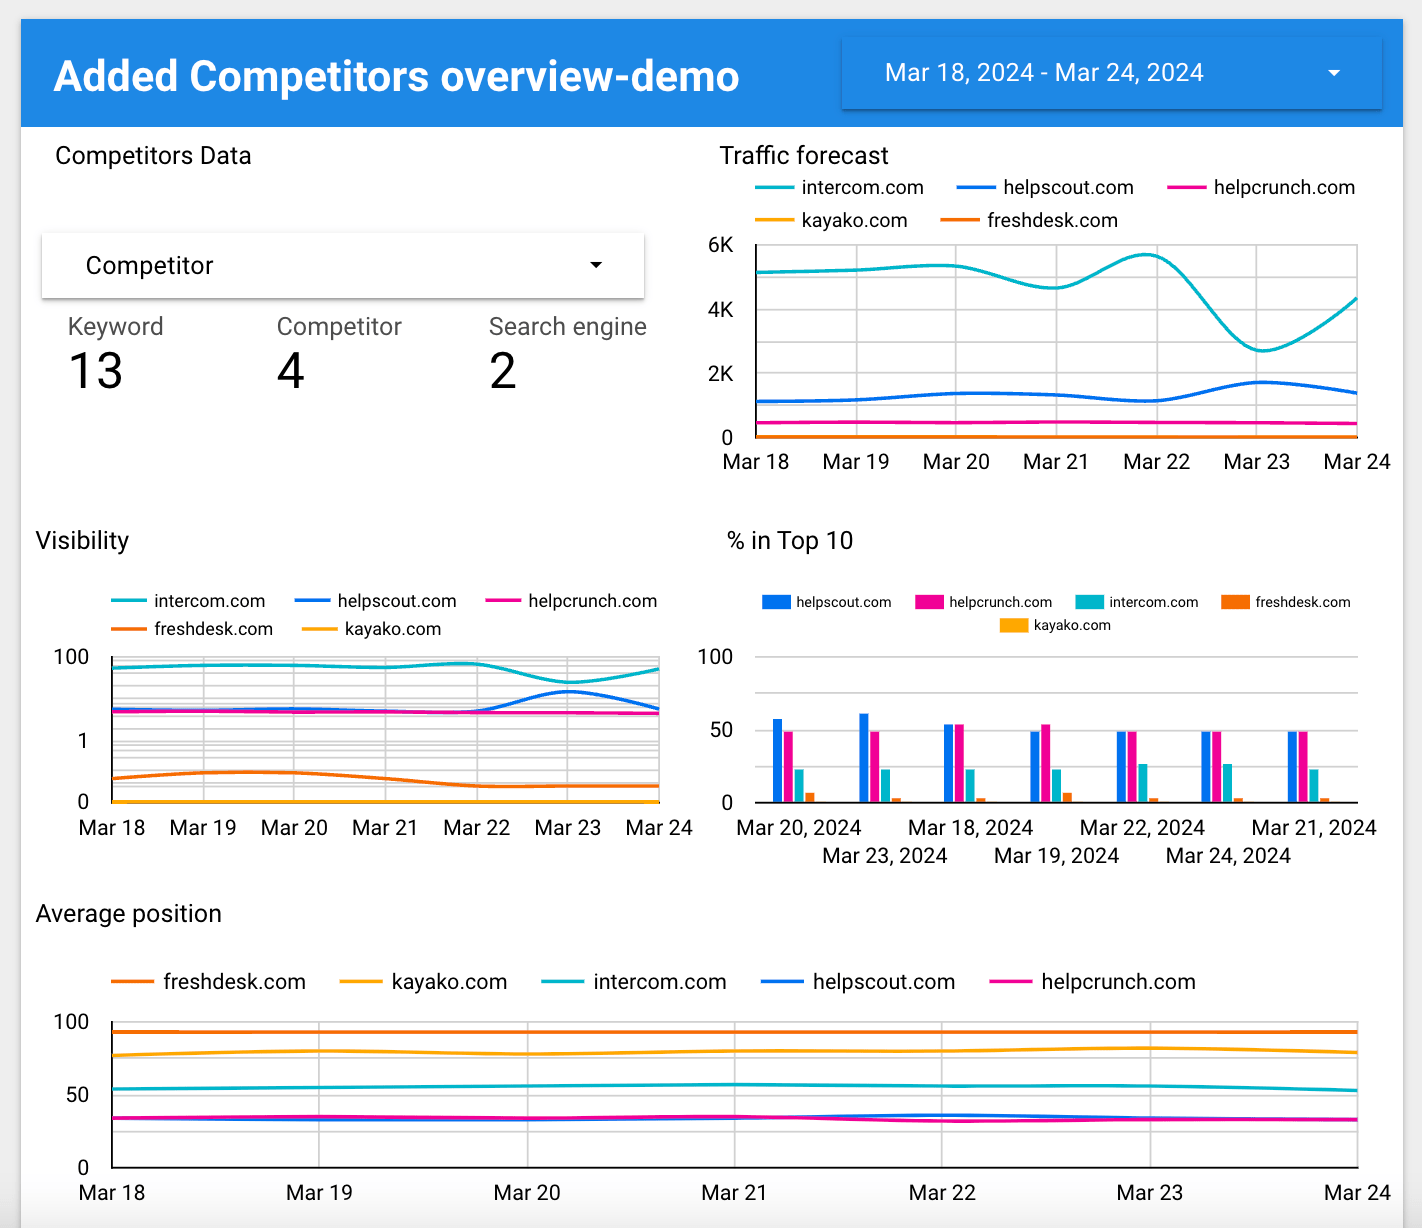
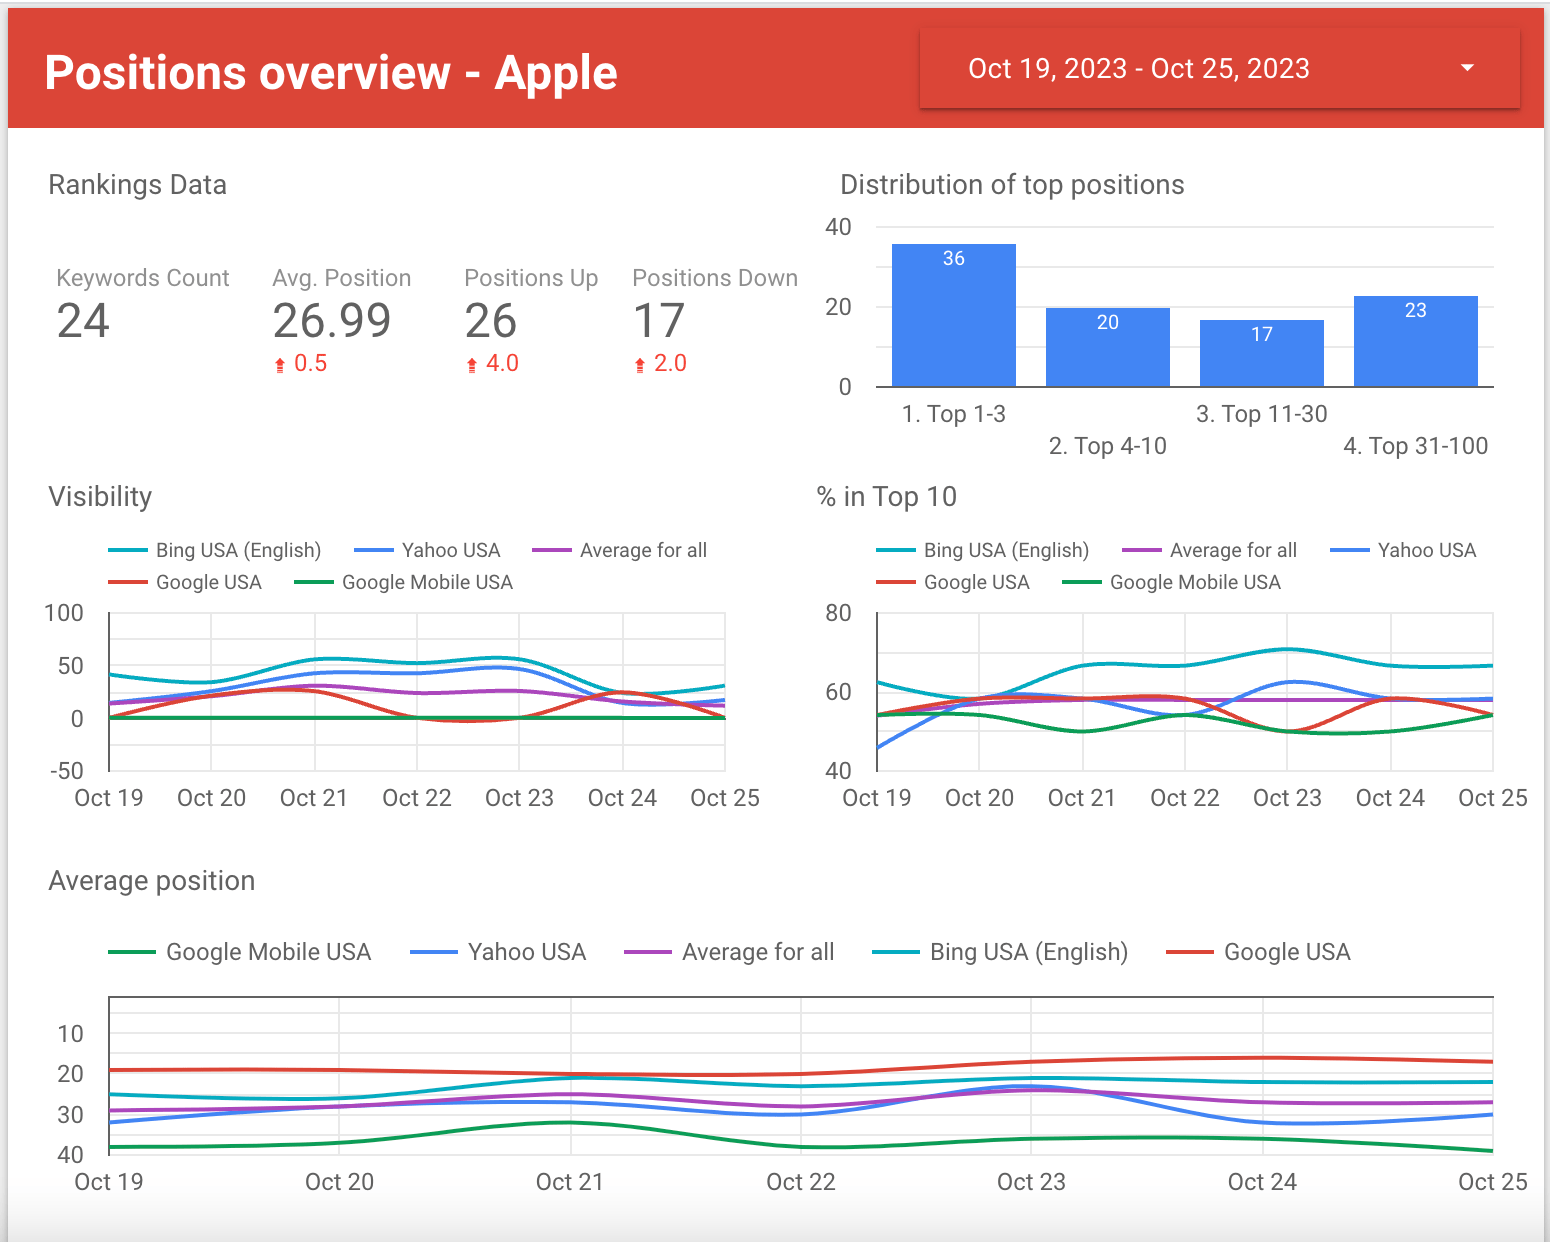
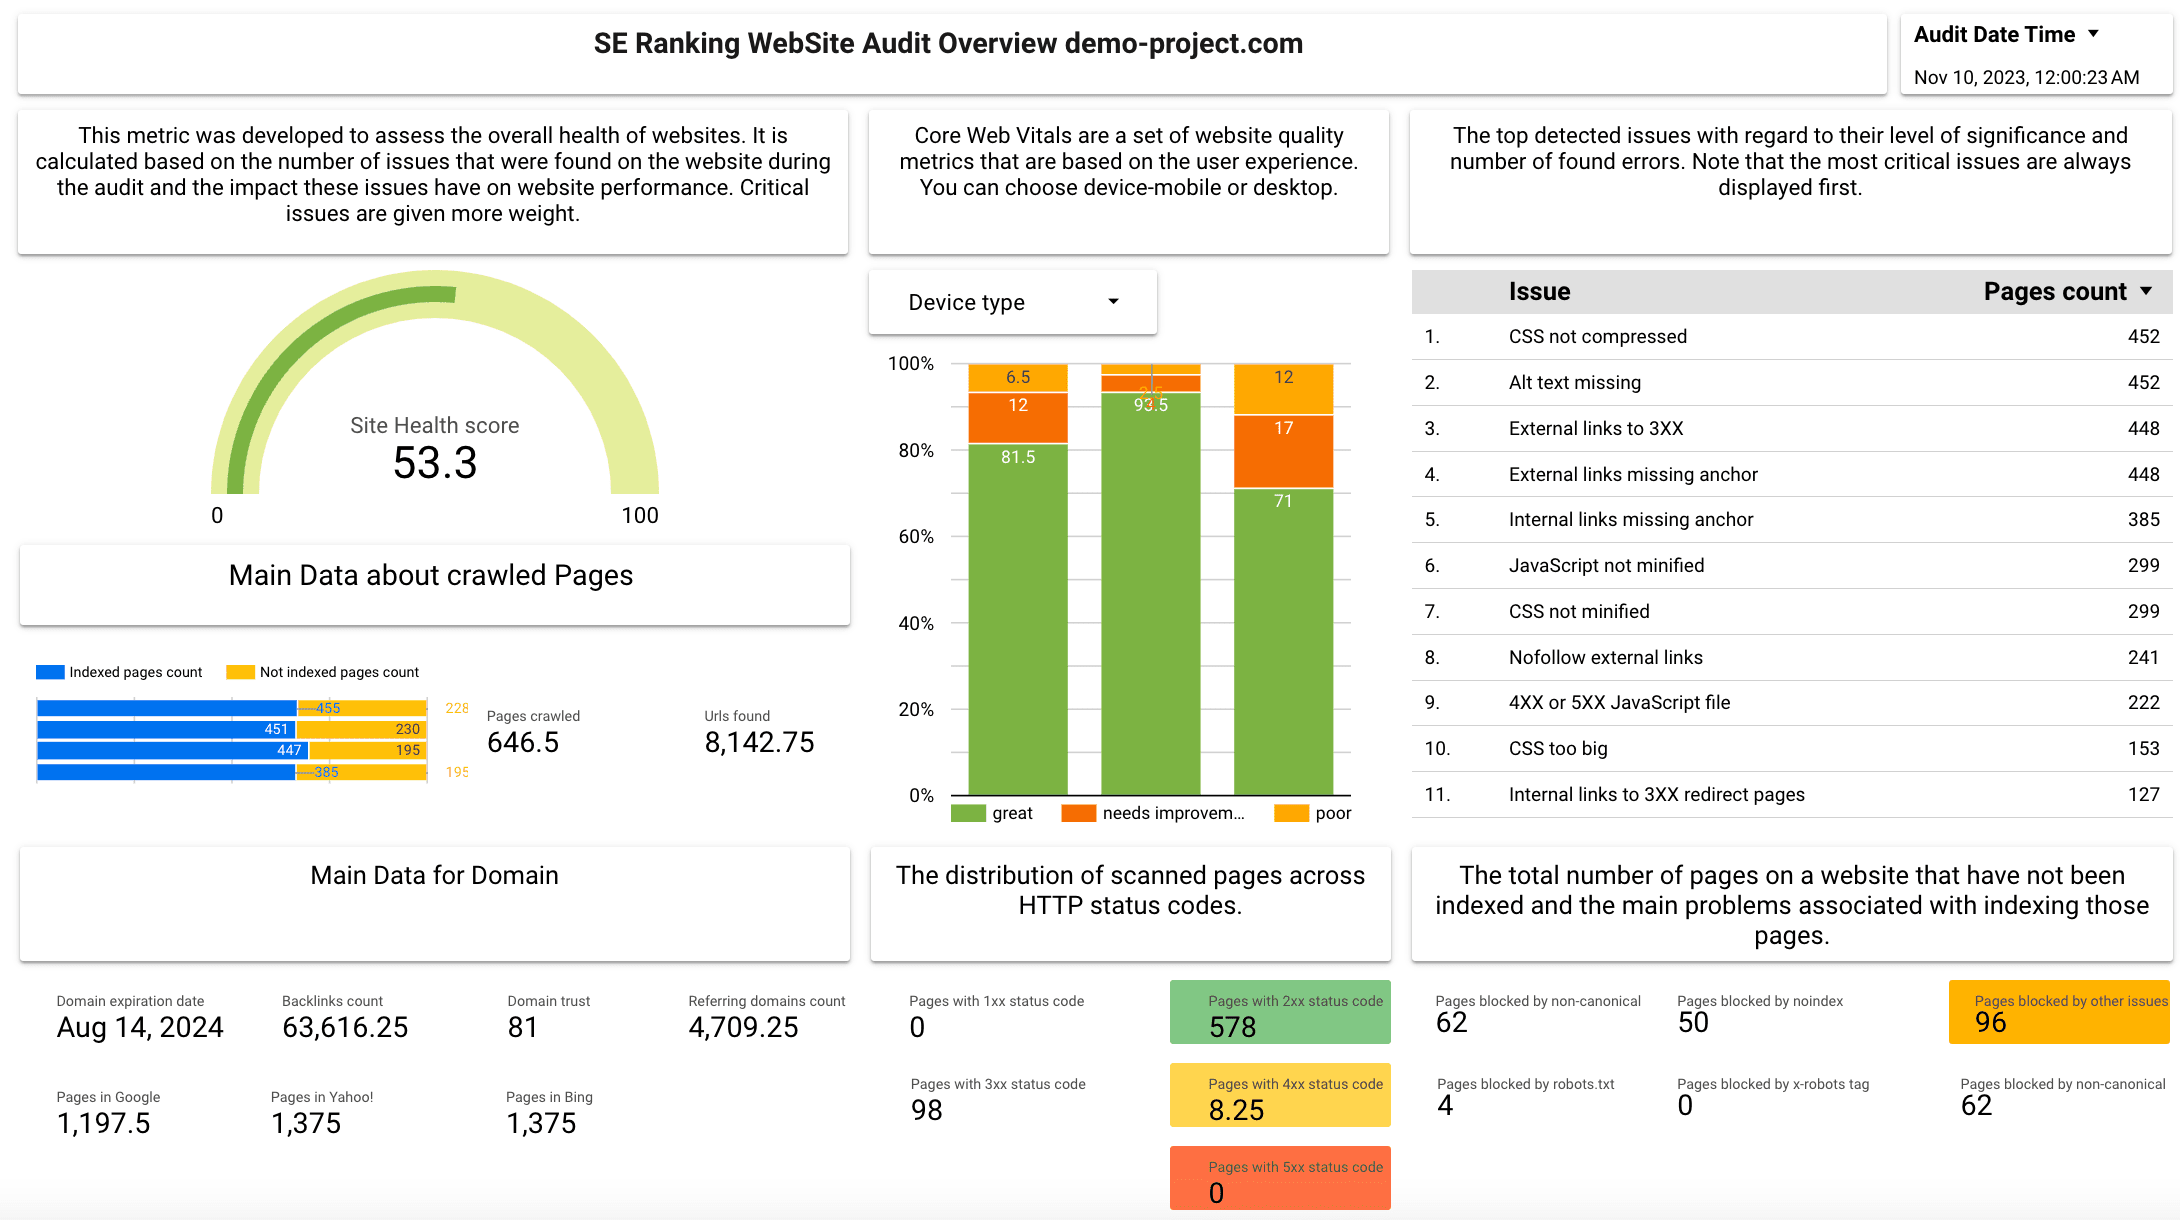
To make it more convenient to present in-house SE Ranking data to clients our team has developed different Looker Studio templates:
- The Rankings template collects data from the Rank Tracker and offers a detailed overview of keyword rankings.
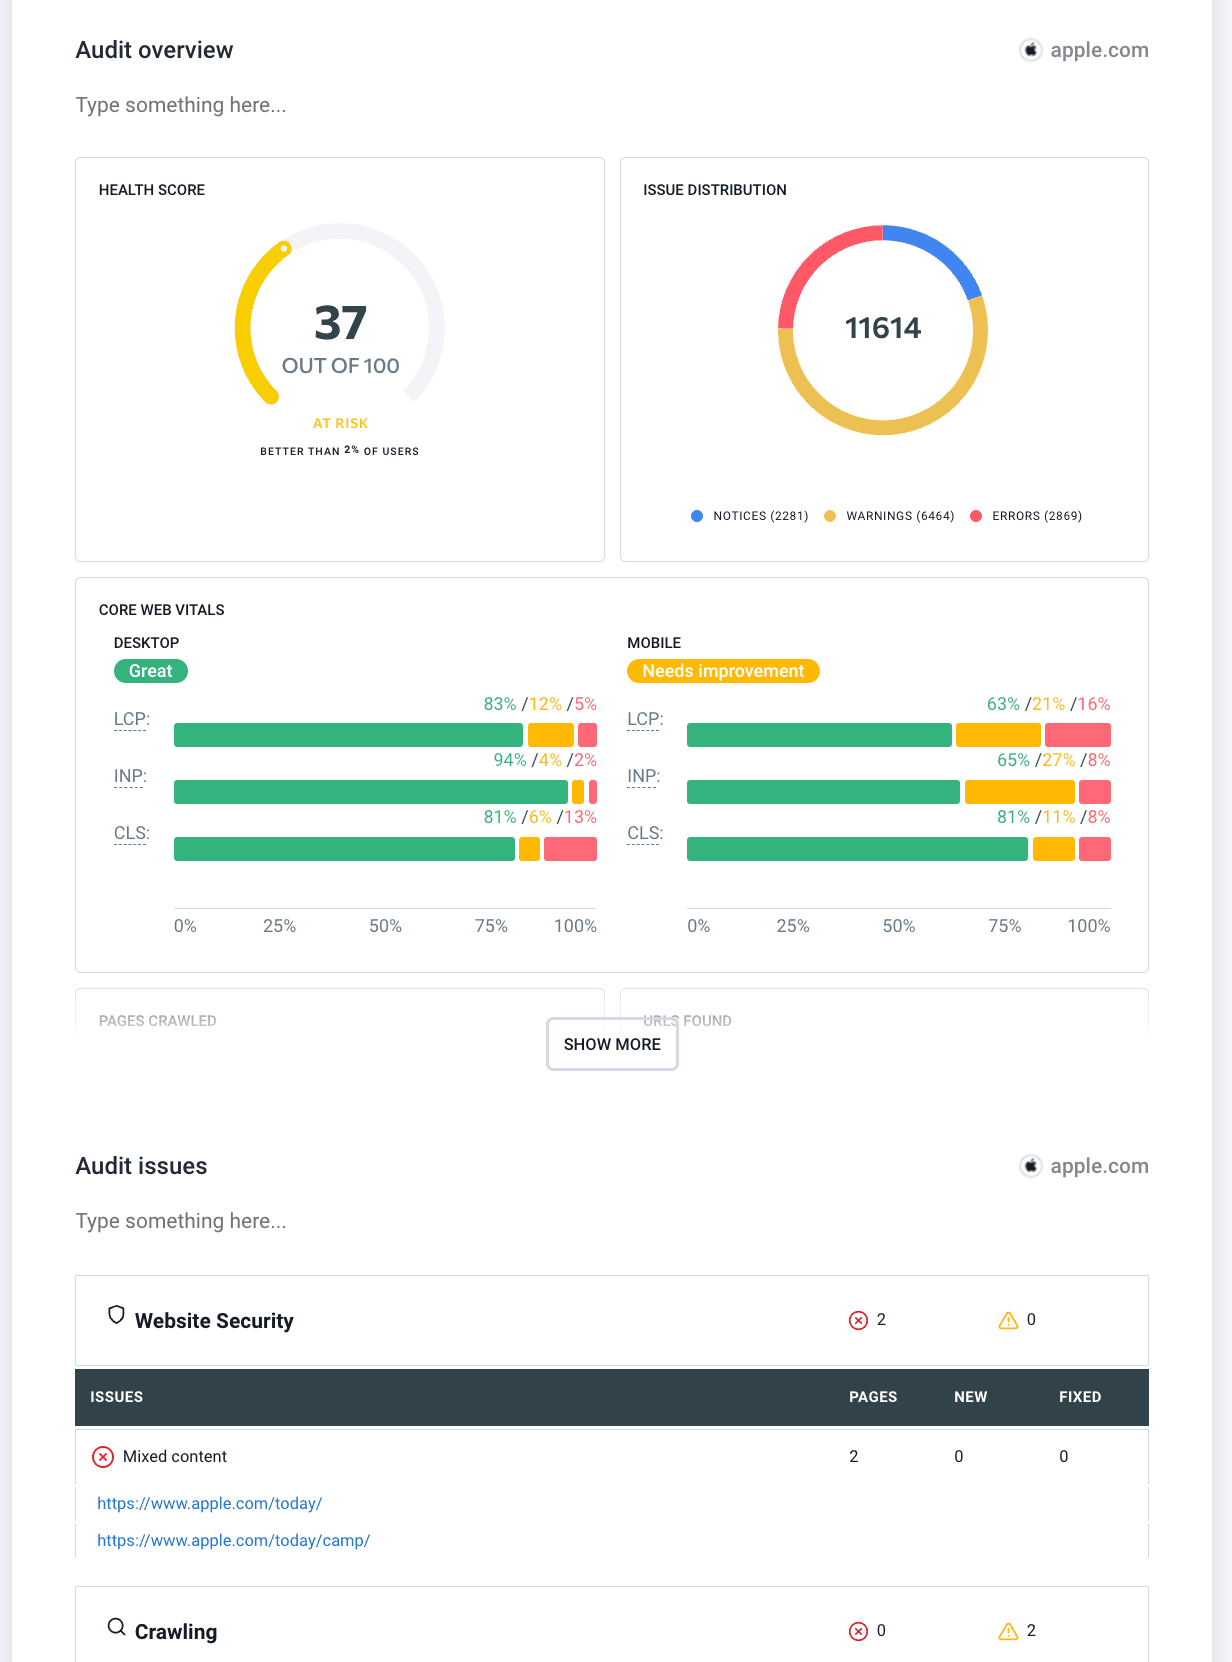
- The Site Audit template provides a quick overview of website SEO health by collecting data from SE Ranking’s Website Audit.
- The Competitors template allows you and your clients to compare the site’s ranking performance and search visibility to its top direct digital rivals.
SE Ranking also has various Looker Studio dashboards, each of which was created by Lazarina Stoy:
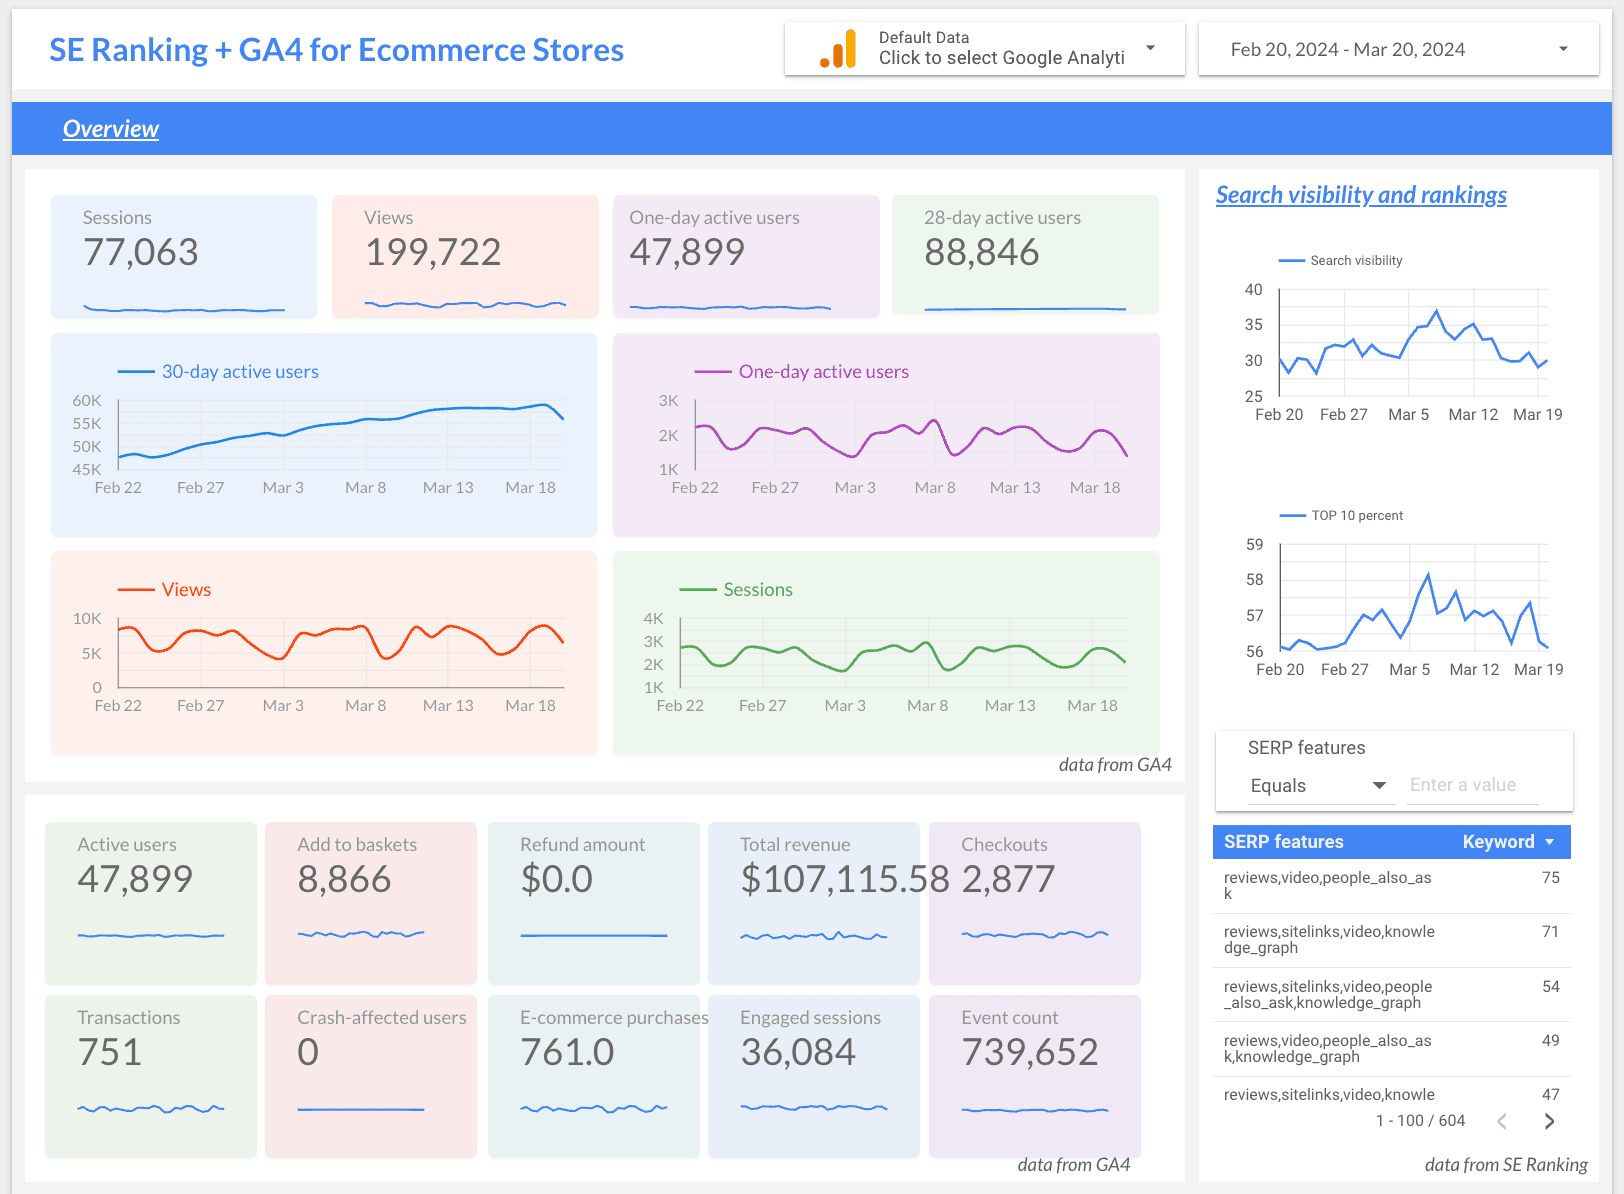
- The e-commerce dashboard integrates GA4 e-commerce data to showcase metrics like views, sessions, revenue, and checkouts. It also connects with SE Ranking’s Rank Tracker to provide an overview of search visibility and the percentage of keywords in top 10 positions.
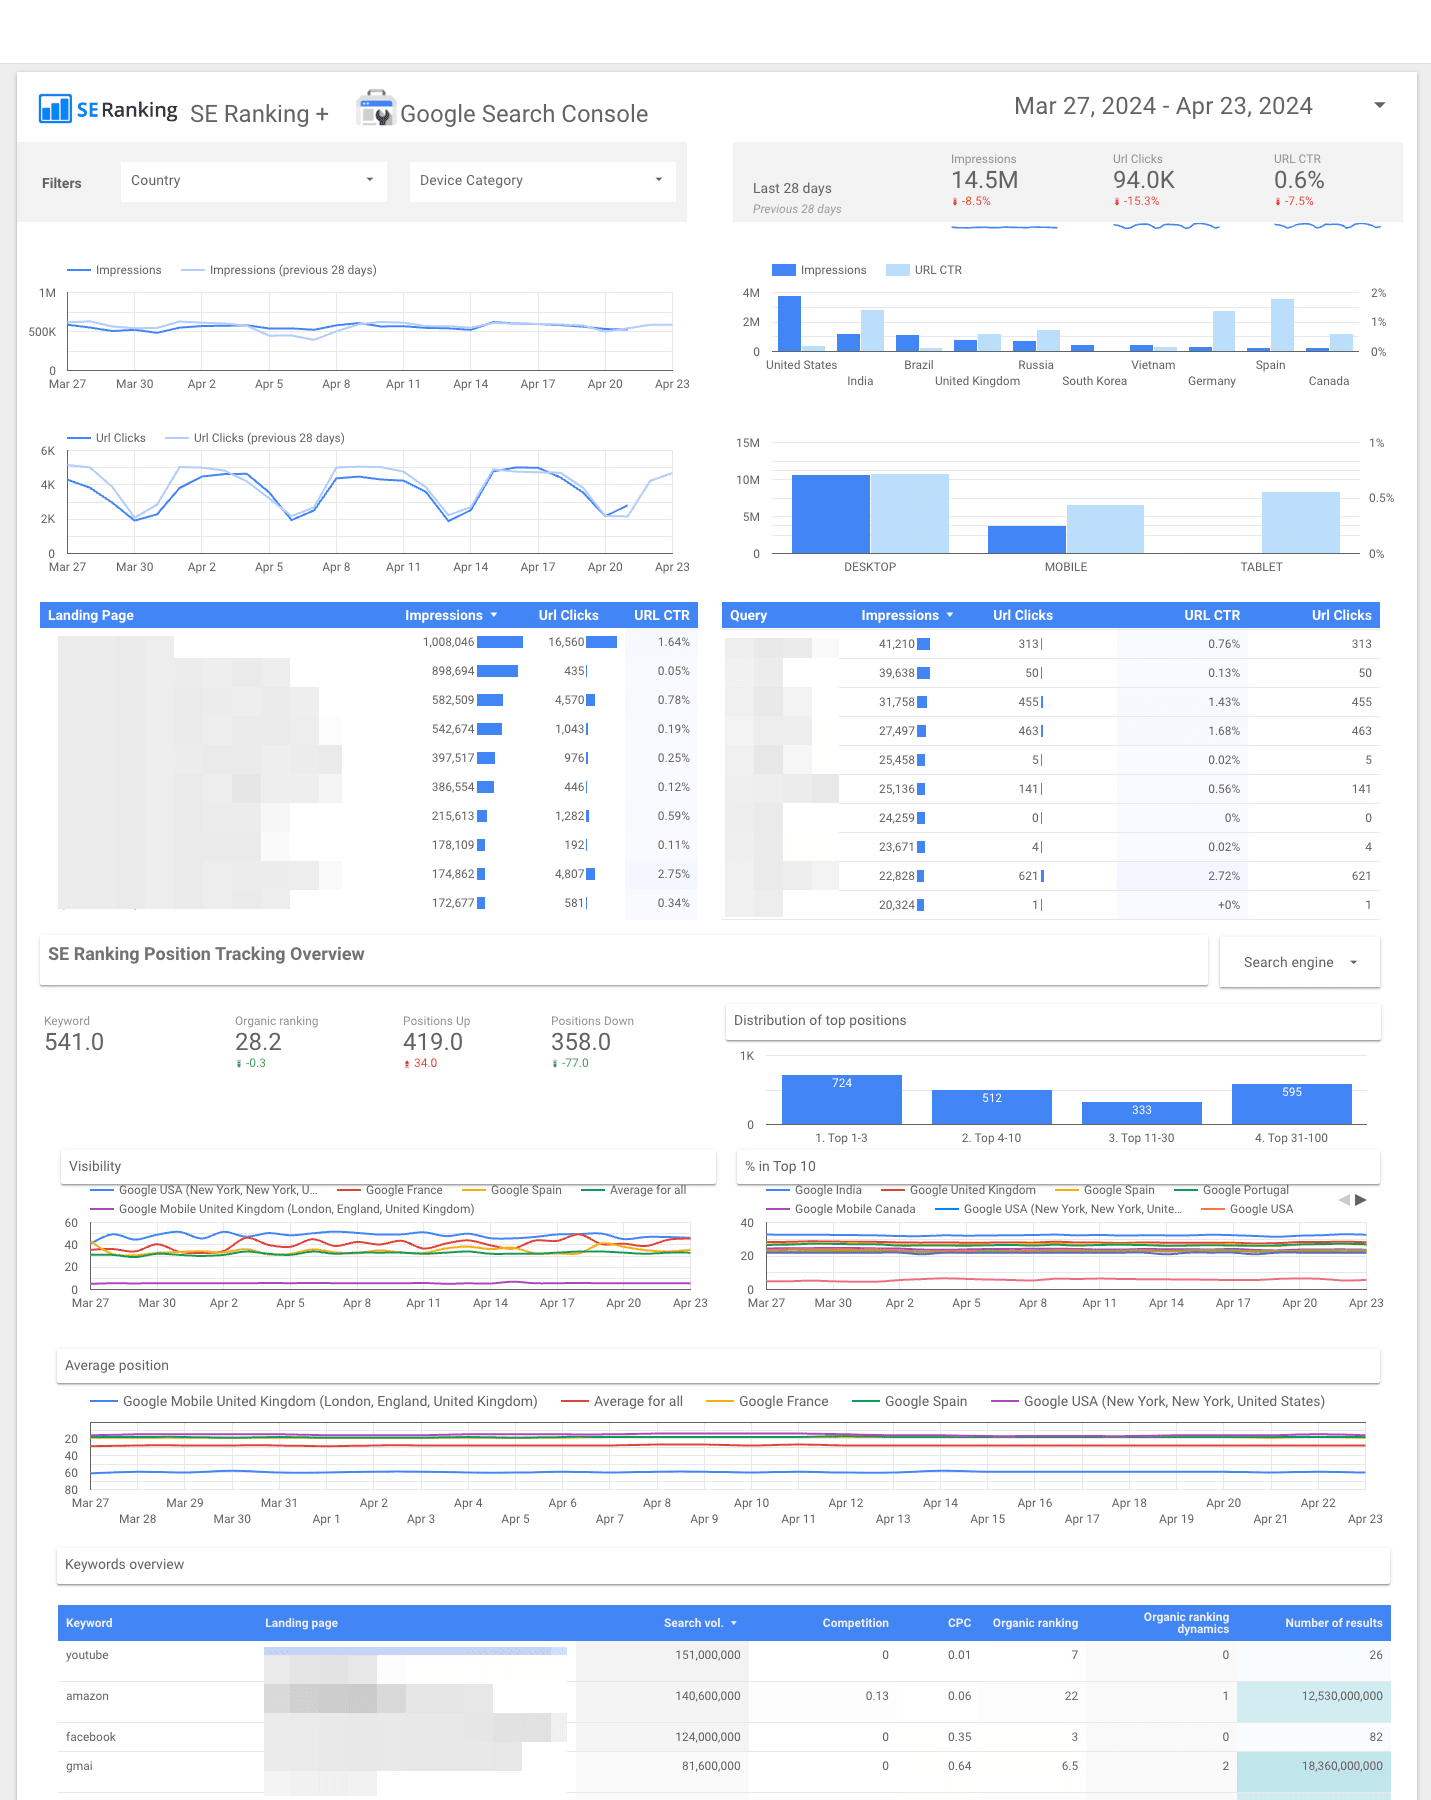
- The Core SEO data visualization dashboard combines the position overview and the website SEO audit with data from Google Search Console. It helps you show the client how visible the website is and if it has technical SEO issues.
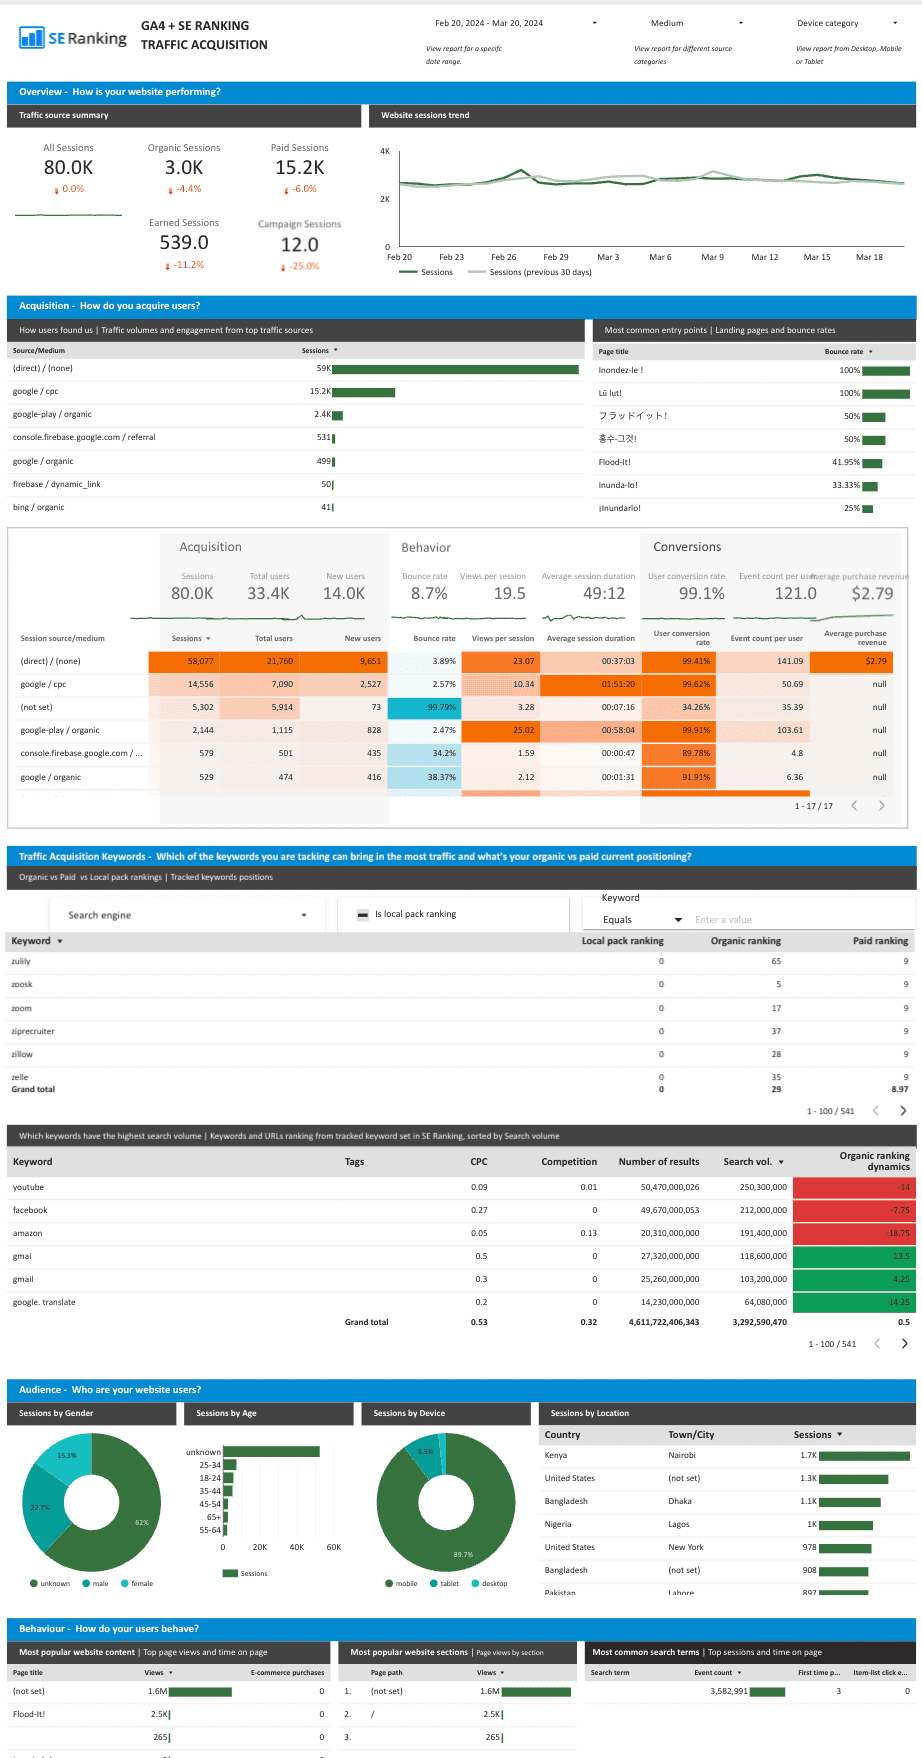
- The Traffic Acquisition and Opportunistic Keywords dashboard uses data from GA4 and SE Ranking’s Rank Tracker. It enables you to analyze the website acquisition and traffic source data. It also lets you monitor ranking result type, keyword search volume and ranking dynamics.
SE Ranking’s Report Builder
SE Ranking’s Report Builder is among one of its many tools designed for SEO agencies. It presents critical data in the form of easy-to-read graphs. The tool offers full flexibility, enabling you to accomplish tasks like creating reports from scratch (or using ready-made templates), setting up scheduled reporting, and integrating SE Ranking databases with top analytics tools like GA, GSC, and Matomo. Let’s dive into the Report Builder’s key advantages:
- Automated reporting. Set up a report delivery schedule for your clients to send PDF, XLS or HTML reports to your clients’ emails automatically. Just choose the sending frequency, delivery day and time, and enter the recipients’ email addresses. This report automation saves you precious time and resources.
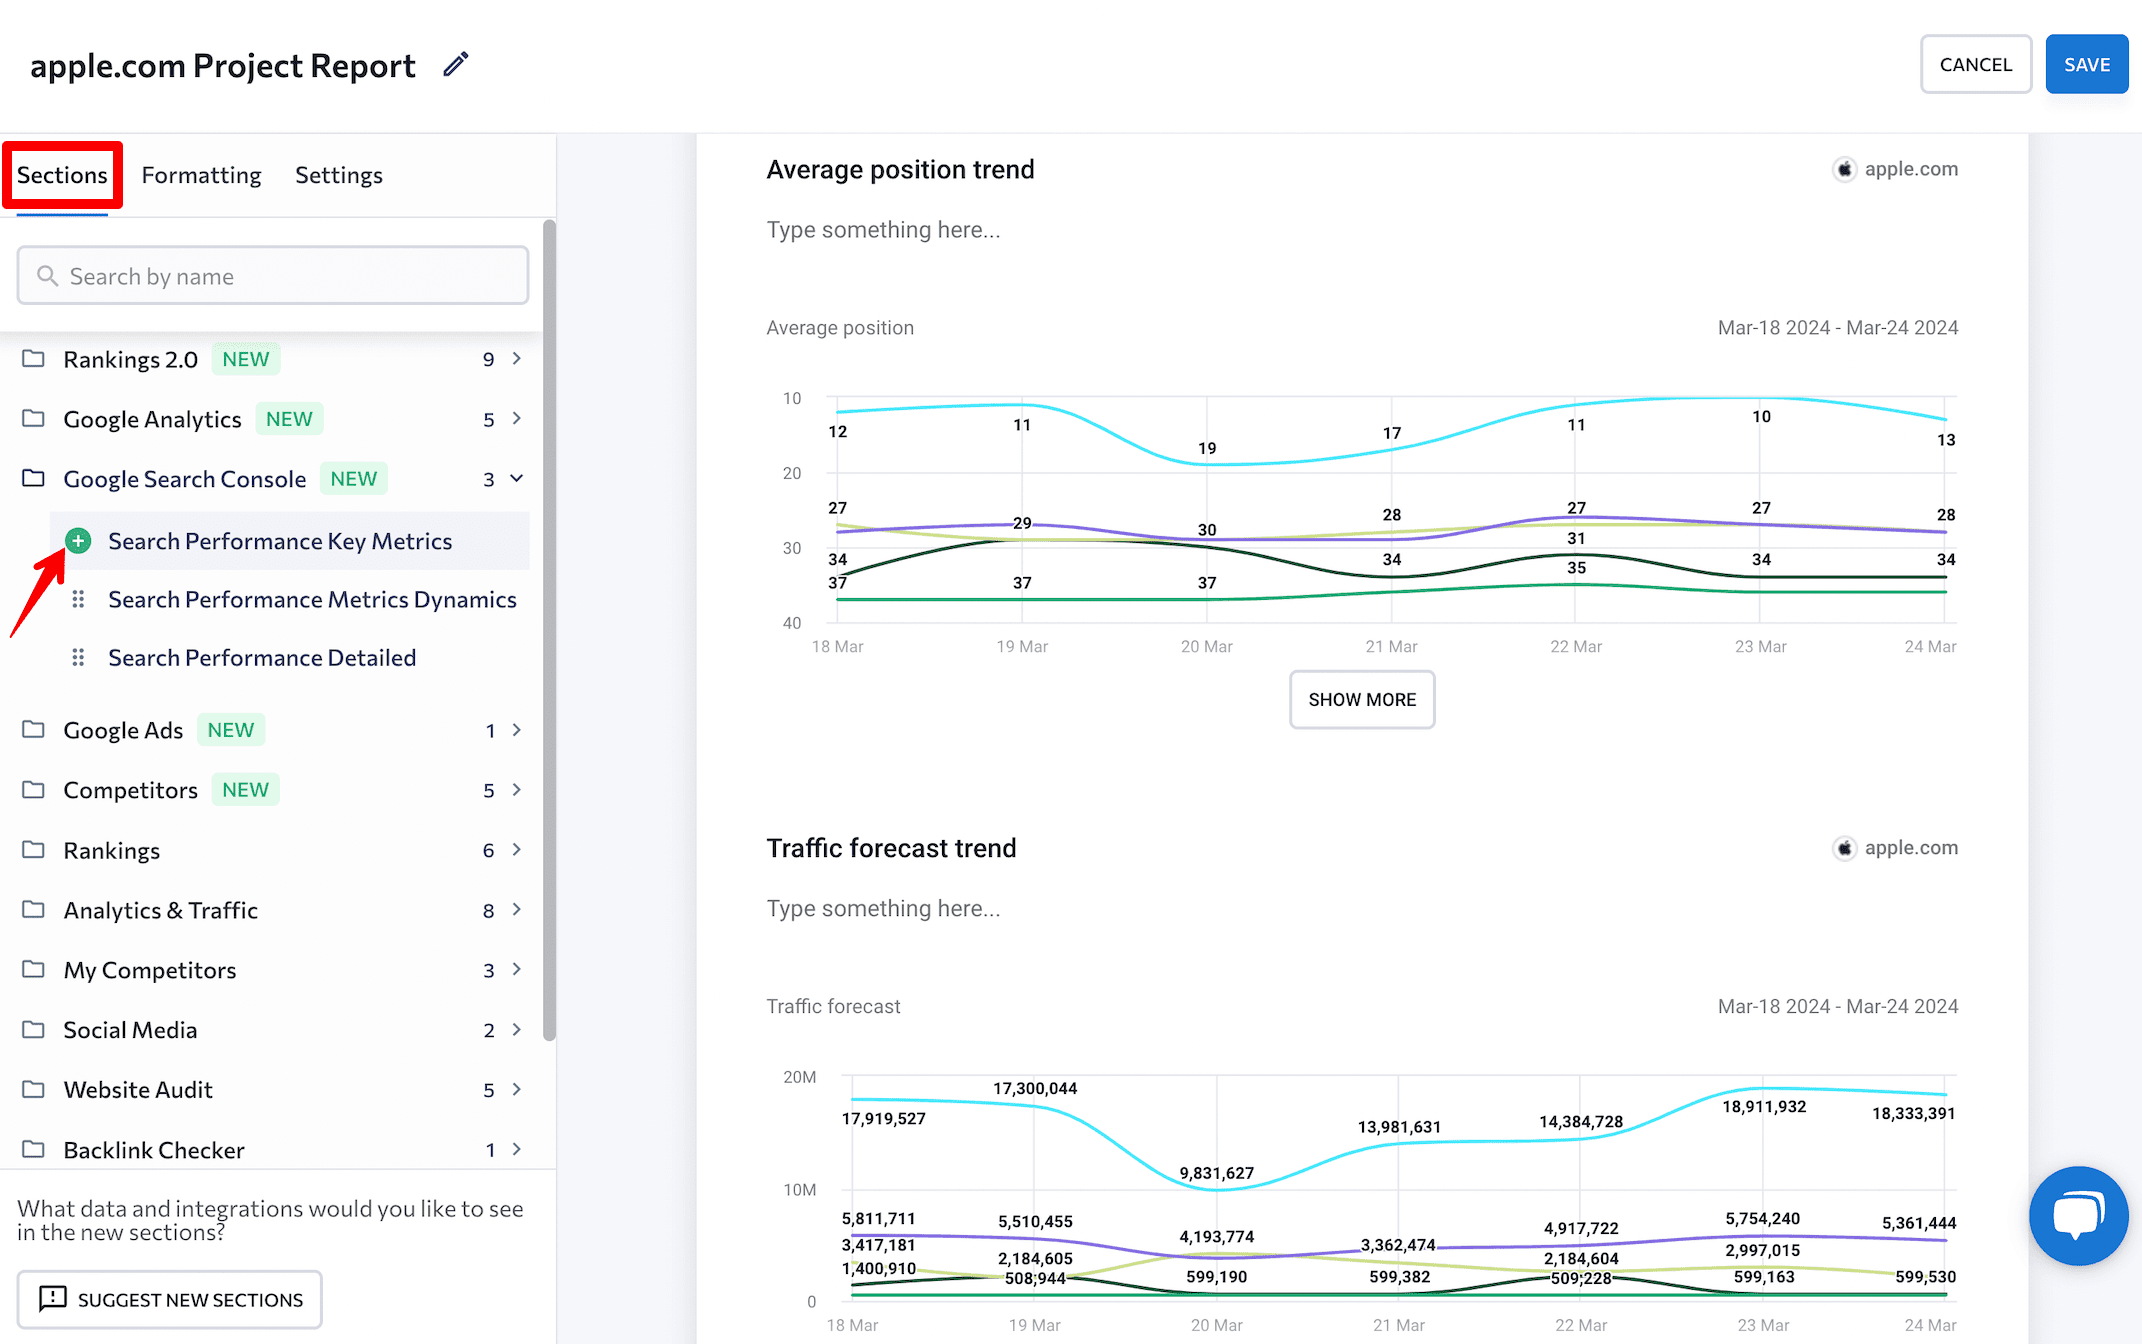
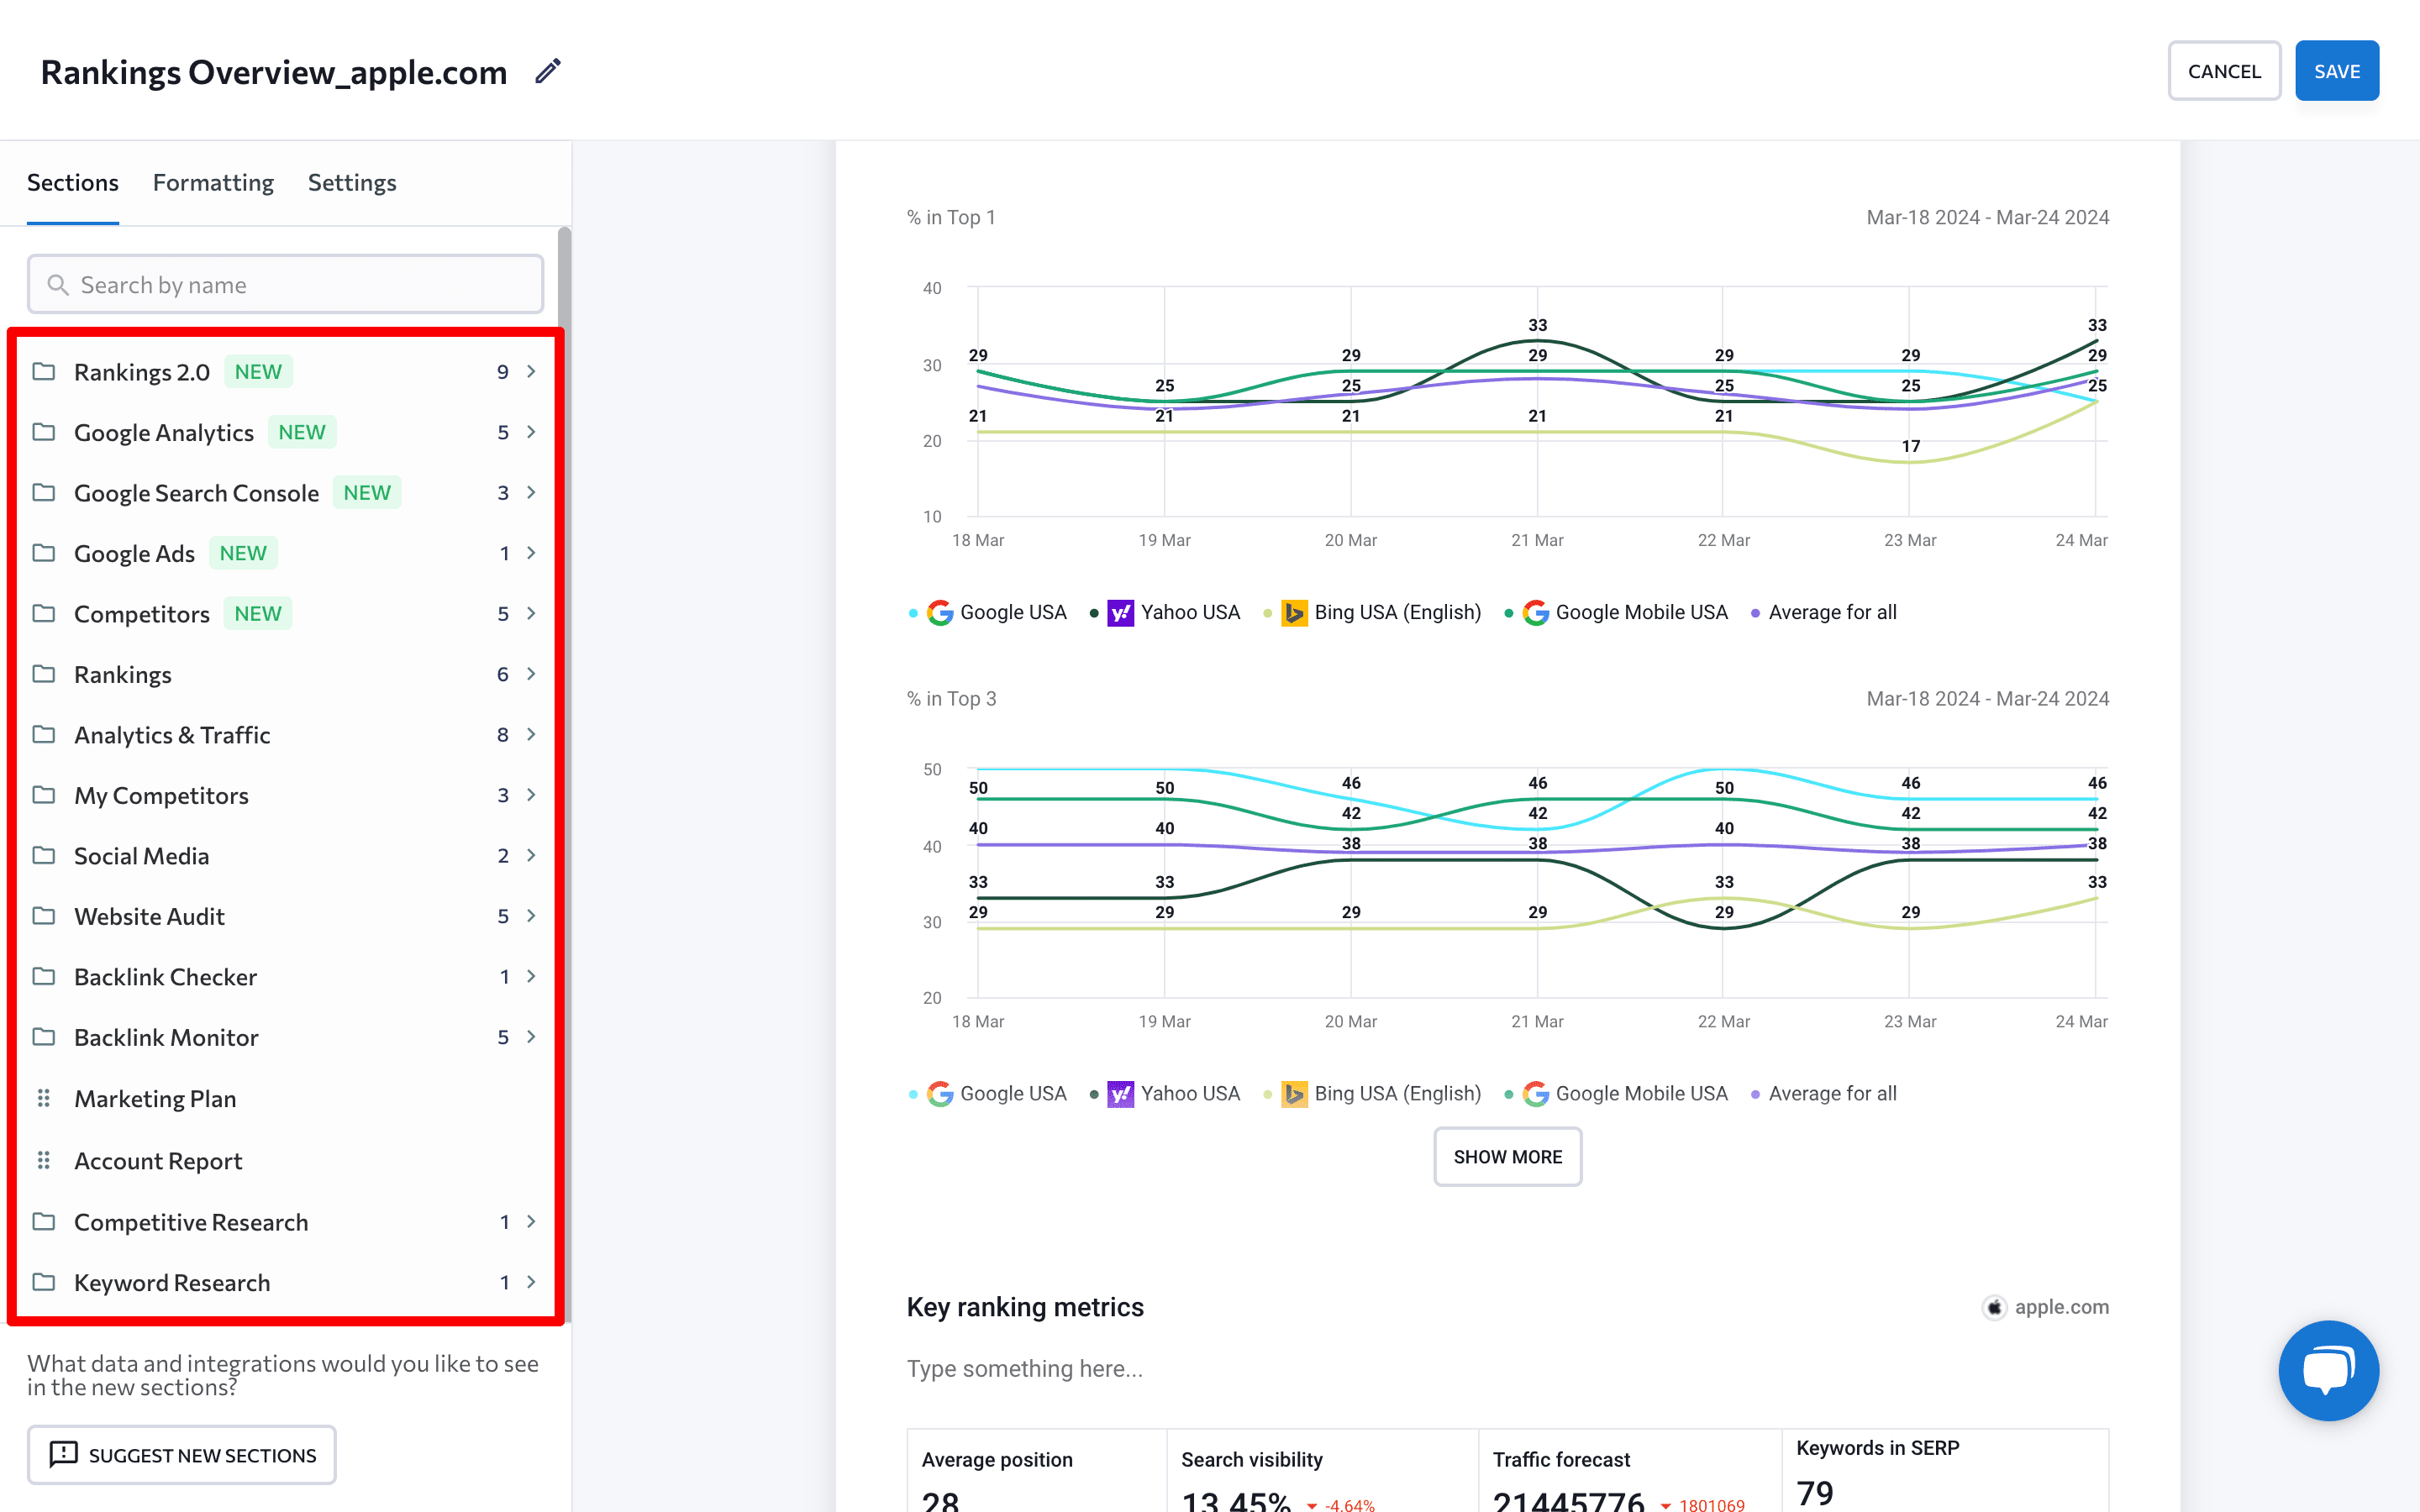
- Customization features. Use the tool’s simple drag-and-drop interface to choose your desired data points and sections in your reports. Create unlimited SEO report templates with the right amount of data for each client. For added clarity and consistency, include the report name, notes, and images.
- Seamless integrations. All data for the report is automatically pulled from SE Ranking’s tools, ensuring accuracy and consistency. You can also incorporate data from GA4 and Google Search Console, or Matomo.
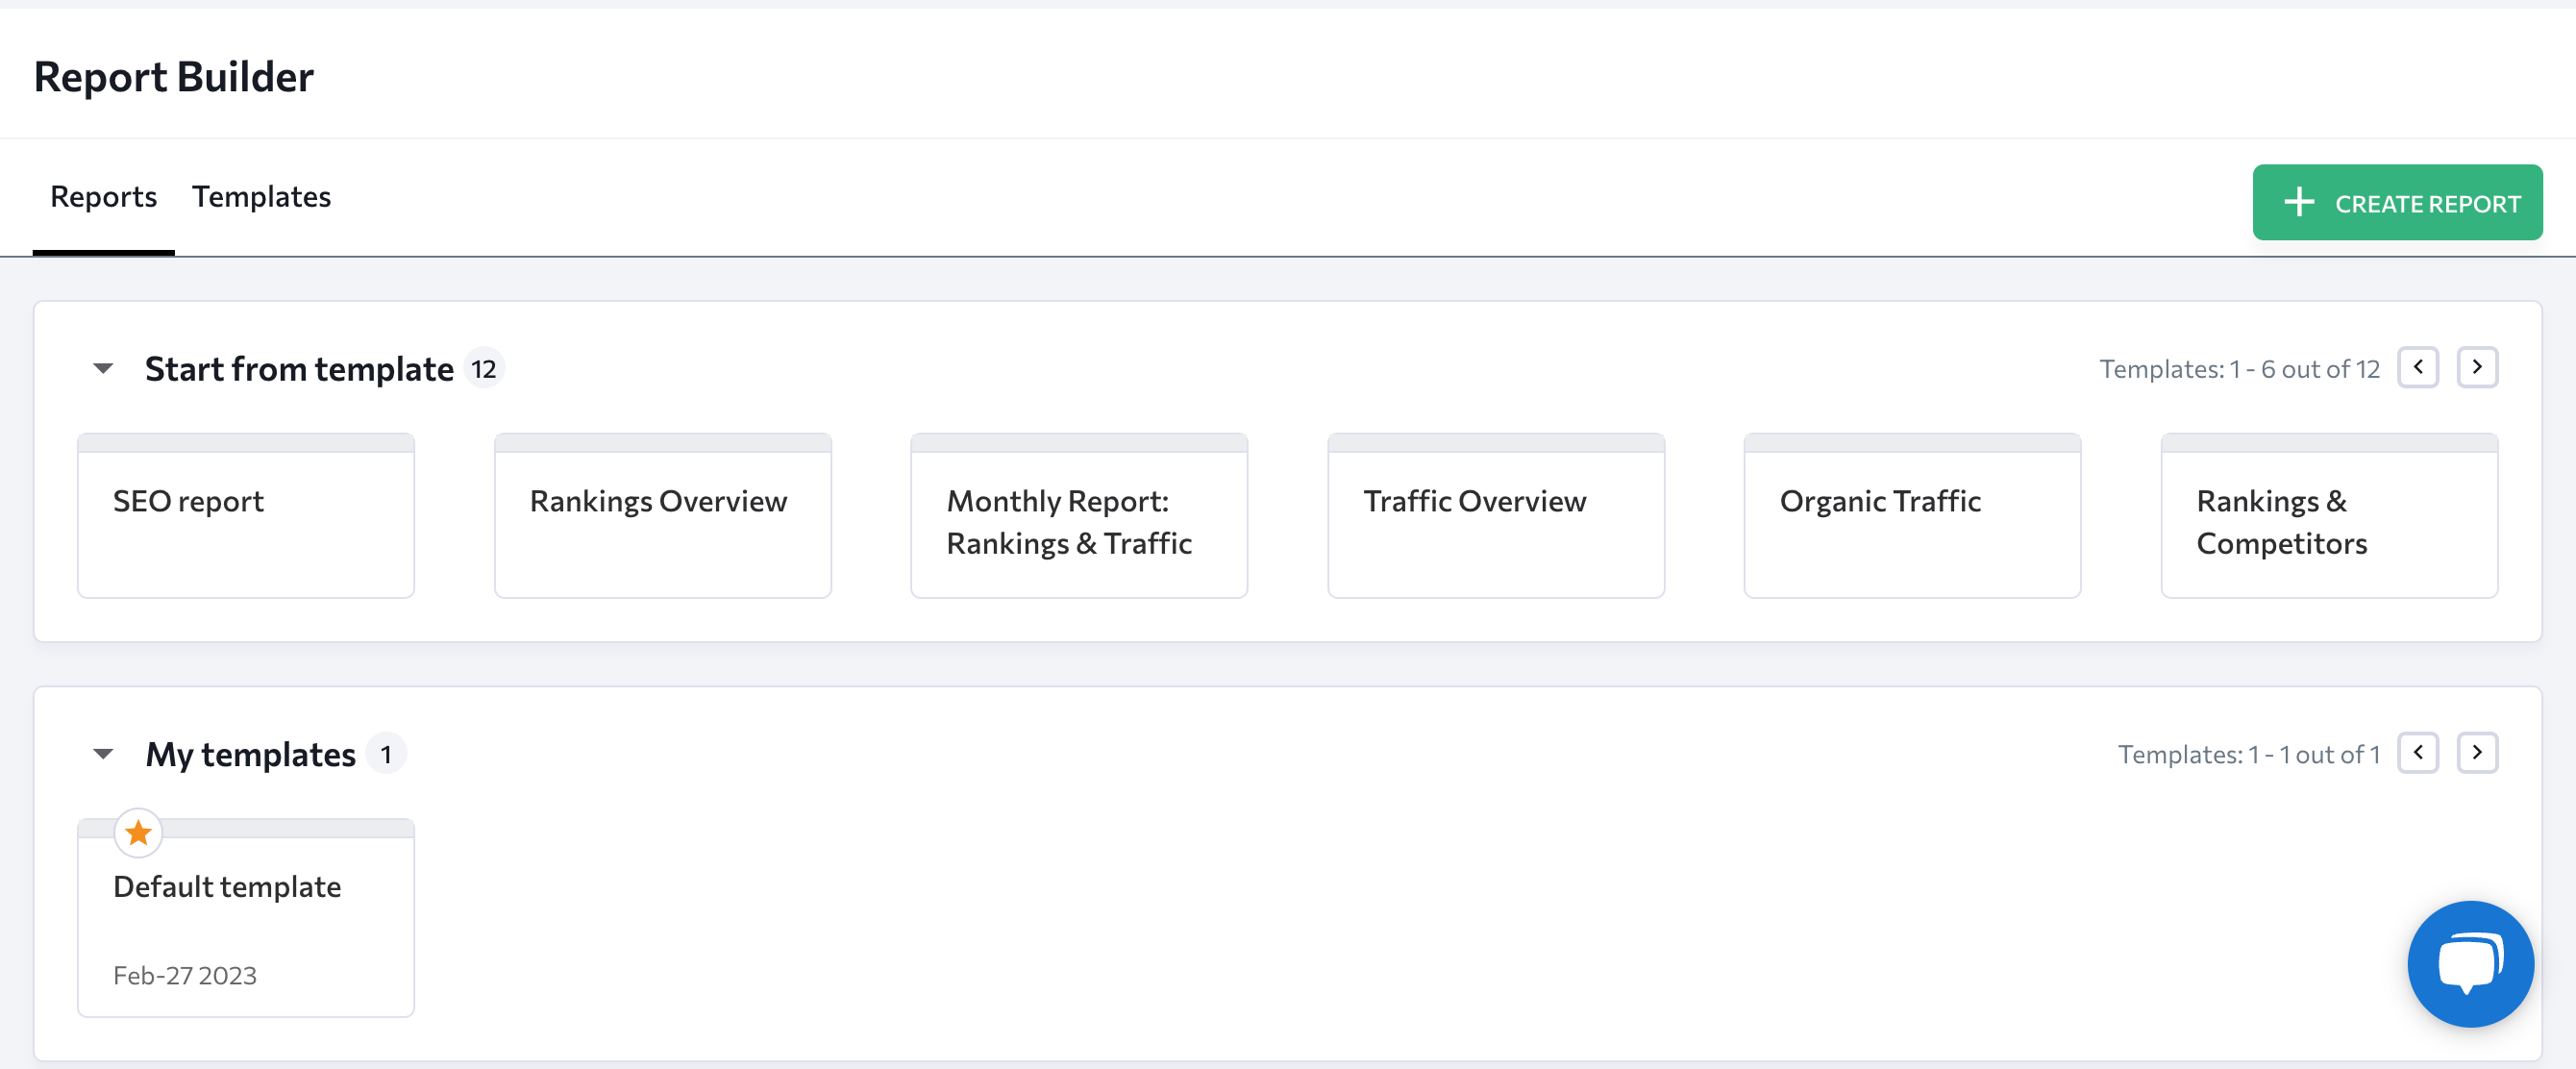
- Ready-to-use report templates. SE Ranking offers 12 SEO templates covering important SEO areas like organic traffic, rankings and SERP competitors, and website audit issues.
SE Ranking’s Report Builder gives you the power to create comprehensive reports covering all essential SEO metrics, using diverse tables and graphs. Here are some key data points to include in your report:
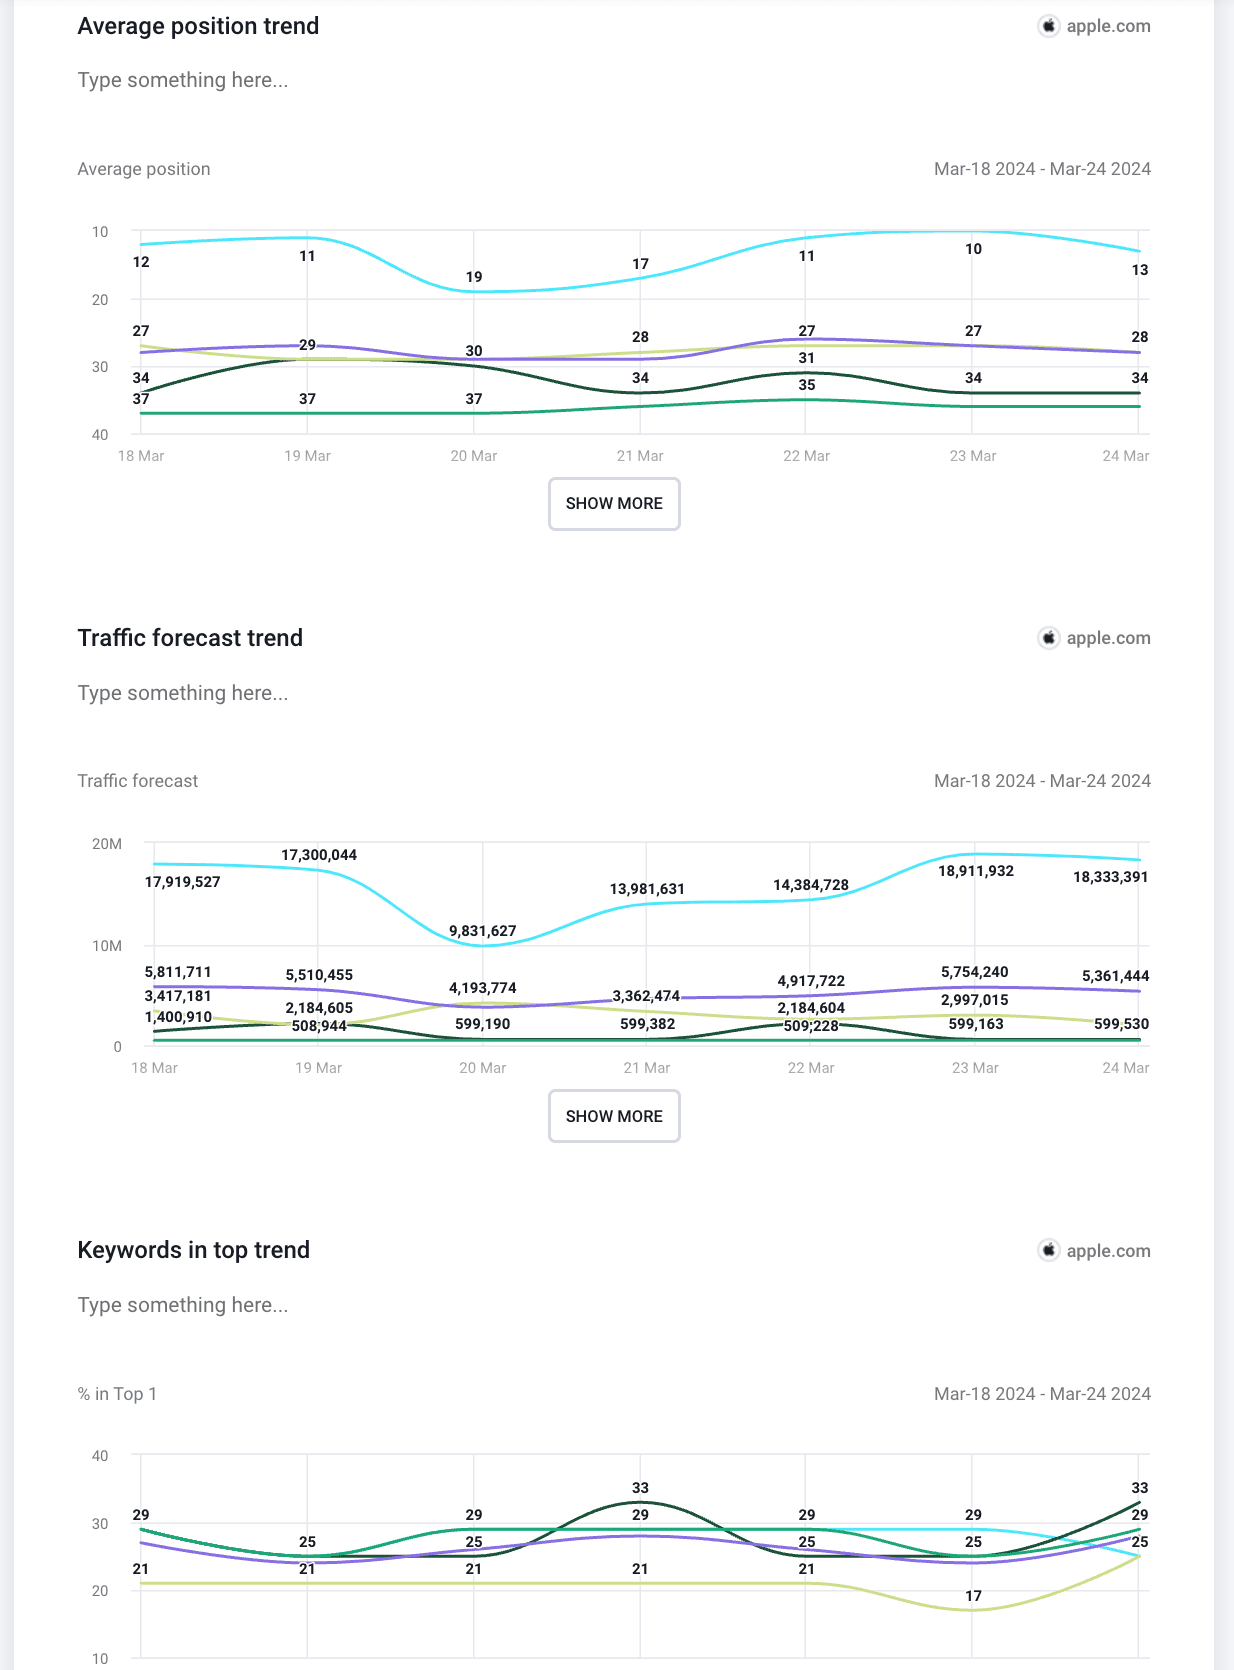
- Keyword rankings: This section offers insights into search visibility, traffic forecast, average position trend, keyword distribution by top positions, and various charts and tables illustrating the website’s SERP progress.
- Analytics & traffic data: Incorporates data from GA4 and GSC, showcasing conversions, traffic, audience insights, and other website performance metrics.
- Backlink data: Provides information on backlink or referring domain count, Domain Trust score, newly acquired or lost links, and the dofollow/nofollow ratio.
- Keyword overview: Presents essential metrics like search volume, difficulty, CPC, and keyword suggestions.
- Competitor overview: Provides insights into competitor visibility and rankings to promote effective benchmarking and analysis.
Business Intelligence Tools
In addition to the tools mentioned above, other popular solutions like Tableau and Power BI are great for automated client reporting. Both offer extensive functionality to fulfill all your reporting needs. Unlike SE Ranking and Looker Studio, these tools aren’t as user-friendly and creating intricate reports with them can be difficult. It can require significant training to fully leverage their advanced functionality.
Now, let’s explore them in more detail.
Tableau
Tableau is a comprehensive data visualization and business intelligence tool used for automated reporting and analyzing vast volumes of data. Create various charts, graphs, maps, and dashboards to show your clients their websites’ progress.
Overall, working with Tableau is similar to working with Looker Studio.
Here’s why:
- It requires you to set up the connector for the necessary tool to display the data on the dashboard (referred to as workbooks here).
- You can find various ready-made templates to simplify the report creation process.
- Tableau features a comprehensive drag-and-drop interface. Drop your data fields into it to create different visual charts, diagrams, tables, etc. You can also customize your data visualizations by adjusting color, size, and labels, and by adding tooltips and text to each chart to enhance visual appeal and understanding.
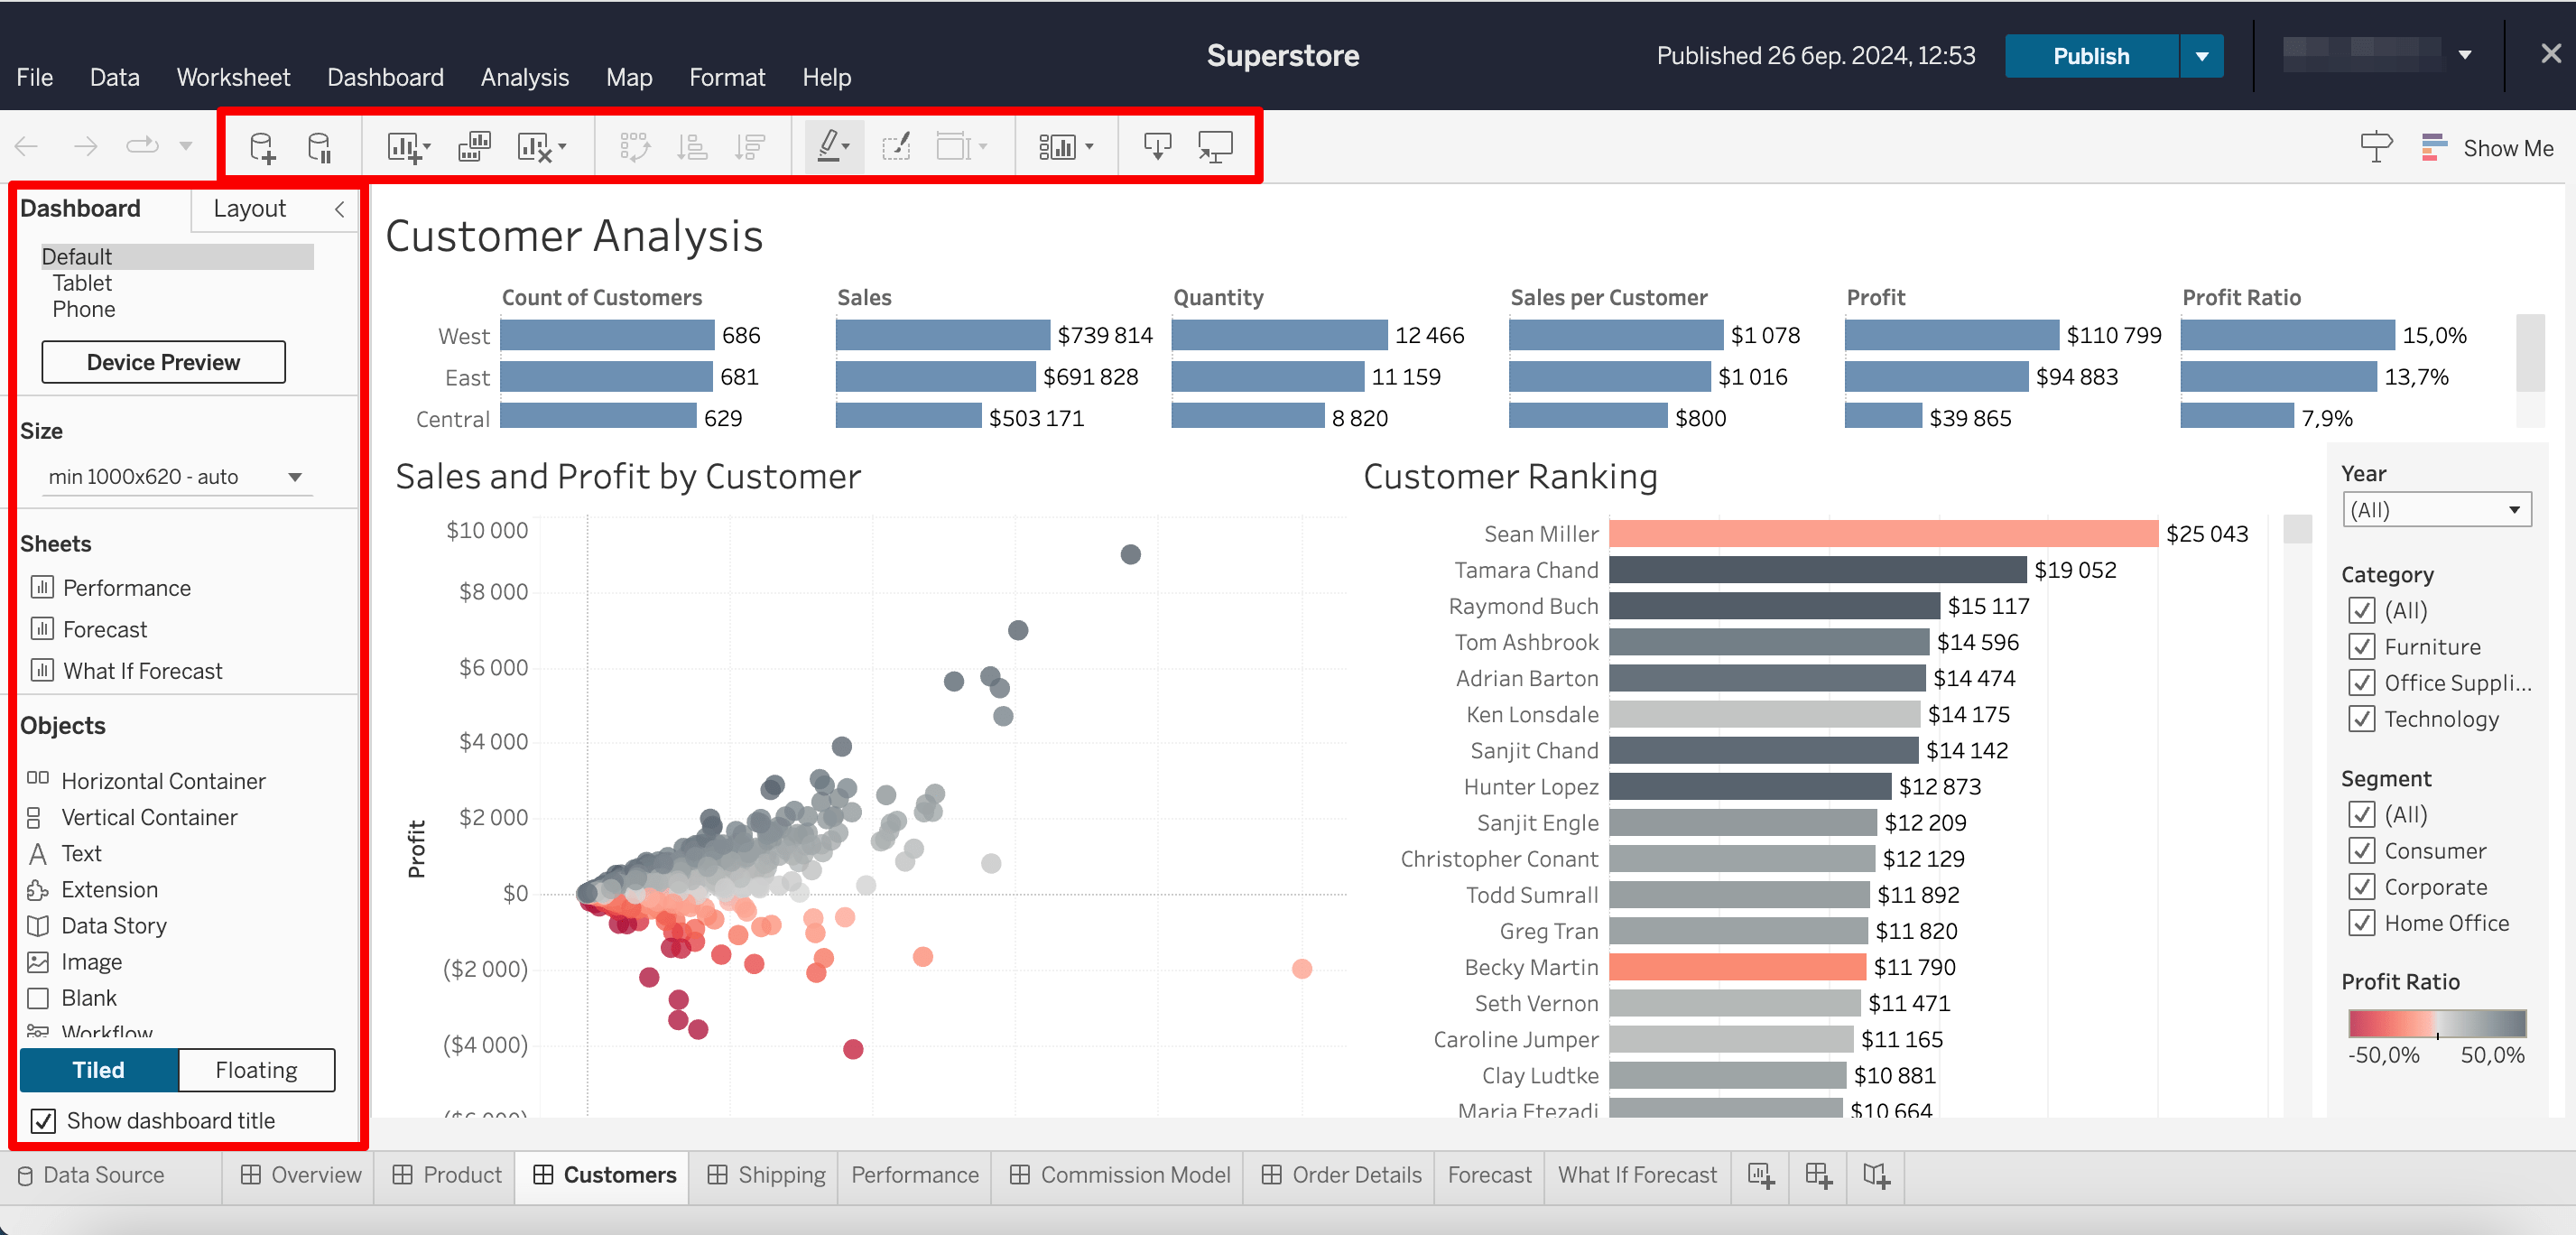
Tableau’s data blending option is one of its biggest advantages. It lets you consolidate data from different sources into one dashboard, even if they have different structures or formats. Tableau also enables you to apply filters to data or organize it based on your preferred method for presenting the selected fields.
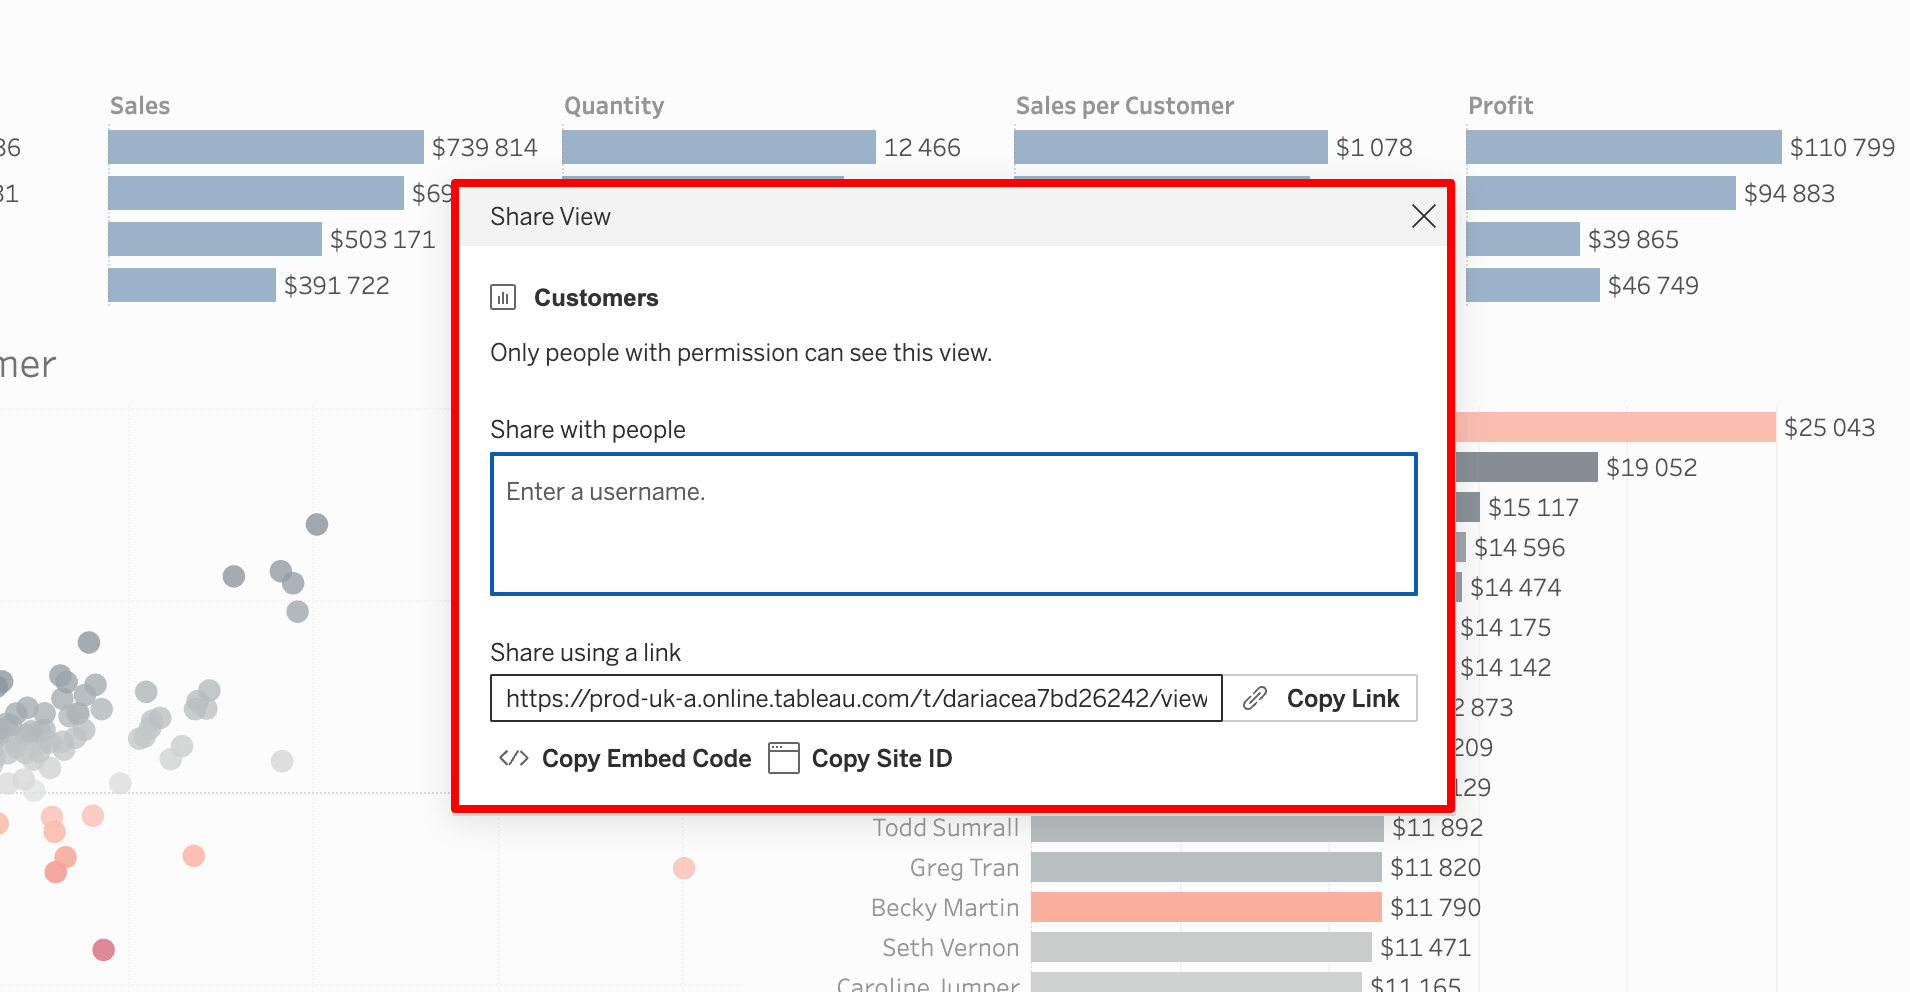
Sharing your Tableau reports with clients is straightforward; either provide a link or add their email to grant them access. You can also export your report as a PDF, image, or Tableau Workbook, or publish it to Tableau Public, Tableau Server, or Tableau Online.
Power BI
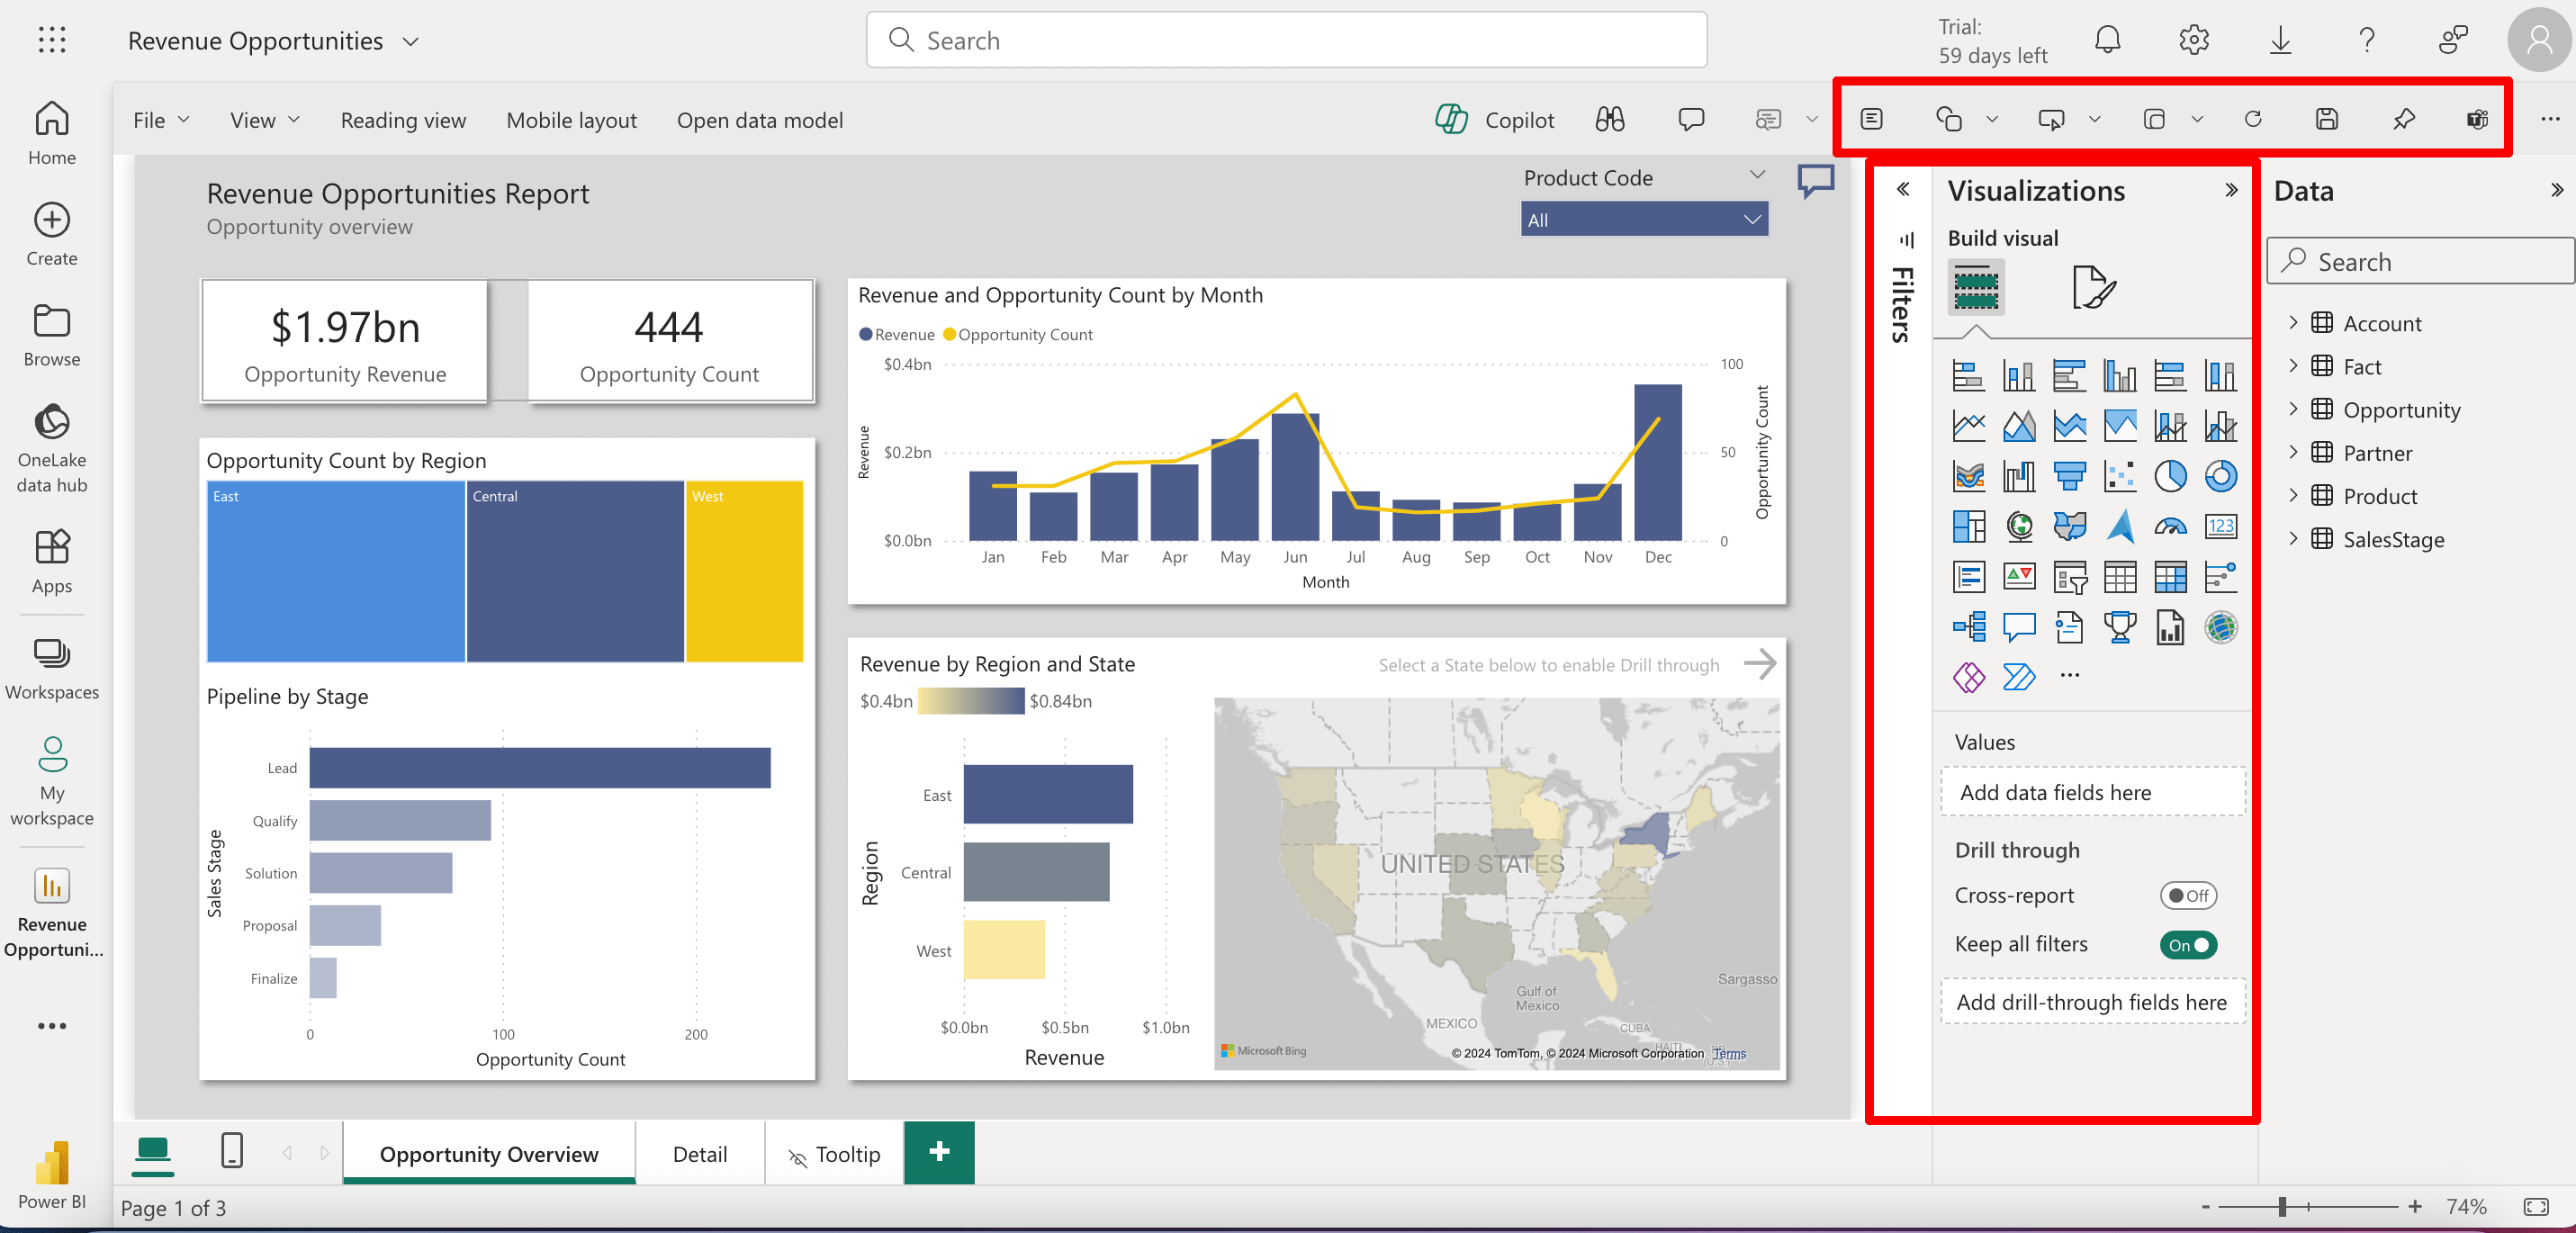
Power BI is an interactive data visualization software that enables you to present your reports in an appealing format. Generate interactive reports from a variety of data sources, such as Excel, databases, or online services. You have the option to choose from ready-made Power BI templates or create a report from scratch.
Power BI is versatile. You can use it for a wide range of business purposes beyond SEO and digital marketing.
It also offers advanced editing features. Make your automated report unique by adding numerous graphics, diagrams, tables, and other elements.
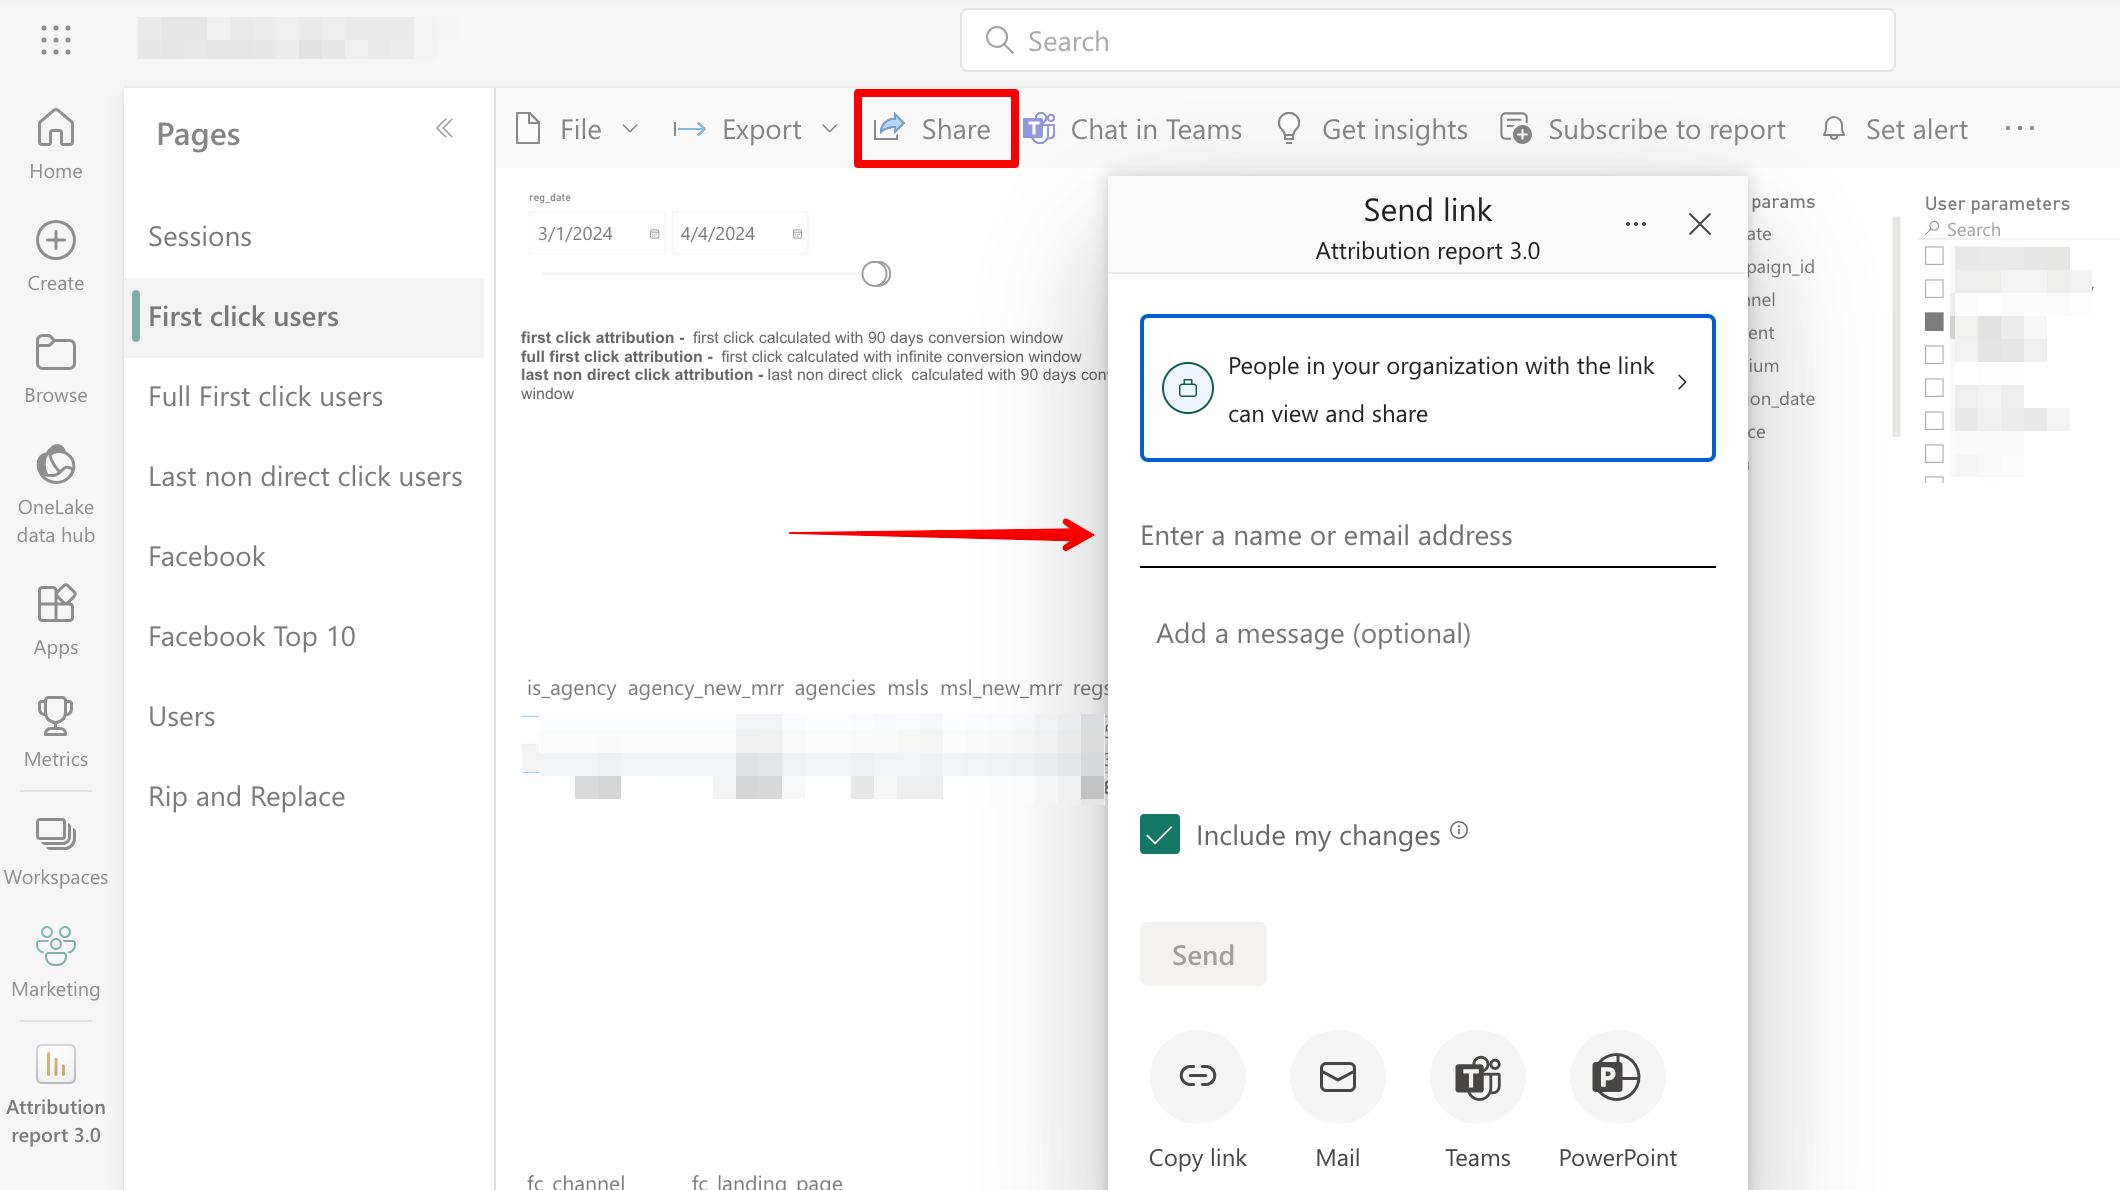
Like other automated reporting software, Power BI provides various sharing options. Copying the link to a report (or dashboard) and sending it to your clients is easy with Power BI. Alternatively, you can share it via Outlook, PowerPoint, and Teams to people in your organization by entering recipients’ email addresses. The tool also allows you to control access by granting either editing or view-only access.
Custom solutions
If you have a large volume of data, you can use an API to automate reporting. APIs can help you consolidate all the data you need into Google Sheets or into your own tool. While this approach demands more expertise and effort, such as configuring code and implementing formulas, it works well for large-scale projects.
It enables you to gather a vast scope of data. For instance, you can gather your keywords and URLs, their positions and changes, or your website audit score and main issues, and compile them into a custom dashboard. You can do this for as many projects as needed, building the structure you require within your own environment, and then share it with your clients.
Read our guide to learn how to extract data for bulk domain analysis.
But if none of the tools mentioned above work for you, consider trying a custom solution instead. This method requires a dedicated development team, and significant effort and time investment. It might be worth it, however, if you have a large agency with unique needs.
How to select a report automation tool
The options described above are great additions to your toolkit. Here are some aspects to consider before picking one.
- Evaluate your business’s needs first. This involves analyzing your report usage, the time your department spends on reporting tasks, your KPIs, reporting schedules, and so on. This will give you an understanding of the kind of functionality your reporting tool should have.
- Find out how much of your budget you can allocate to SEO reporting tools. Each tool in our list varies in pricing and features, so find a balance between your needs and the price. You may even need to invest in training or hire a skilled analyst to set everything up. This can also impact your expenses.
- Consider the integrations the tool supports. For instance, it could be a dealbreaker if one of your primary metrics presented to clients is brand impressions but the reporting tool lacks support for GSC.
- Evaluate the tool’s customizability level. Each client requires an individual approach, varying in their desired color scheme, metrics, delivery days, and more. Depending on the number of projects you have, you need to determine how advanced the customization features should be.
- Consider the technical expertise required. If your team lacks experts who can work with custom reporting solutions like APIs, choose dashboard tools with simple and understandable report setups instead.
Consider the points above carefully. Make sure the tool you choose suits your agency, is easy to use, meets all your needs, and stays within your budget.
How to set up automated reporting for clients
First of all, when setting up automated reporting, you might wonder whether to use dashboards or traditional reports. To understand the differences and choose the best option for your needs, read our guide on dashboards vs. reports.
Now, let’s look at how to set up automated SEO reporting in just three simple steps.
1. Establishing KPIs
The key to a successful automated reporting system is understanding KPIs. This keeps your reporting focused and relevant.
Here are some SEO KPIs that might match your client’s goals:
- Website organic or referral traffic
- Keyword positions
- Conversion rate
- Website technical health
- Backlink profile quality
- User engagement
Figuring out your KPIs helps you understand which information to include in the SEO report.
For instance, if your main KPIs include keyword positions and backlink profile quality, your report should present a thorough analysis of keyword performance (this includes changes in rankings and visibility) and an evaluation of the quality and quantity of backlinks acquired during the reporting period.
When choosing KPIs, prioritize the business goals first and foremost. You should also consider the client’s industry and their business model. Including KPIs in the report is pointless if they don’t help the client achieve their objectives.
2. Creating your report layout
Now that you’ve identified the metrics for your report, the next step is to craft the report and support all relevant sections with data.
Most automated tools offer two ways to create reports: using pre-made templates with sections already included, or starting from scratch. Let’s take a closer look at both approaches while using SE Ranking’s Report Builder as an example.
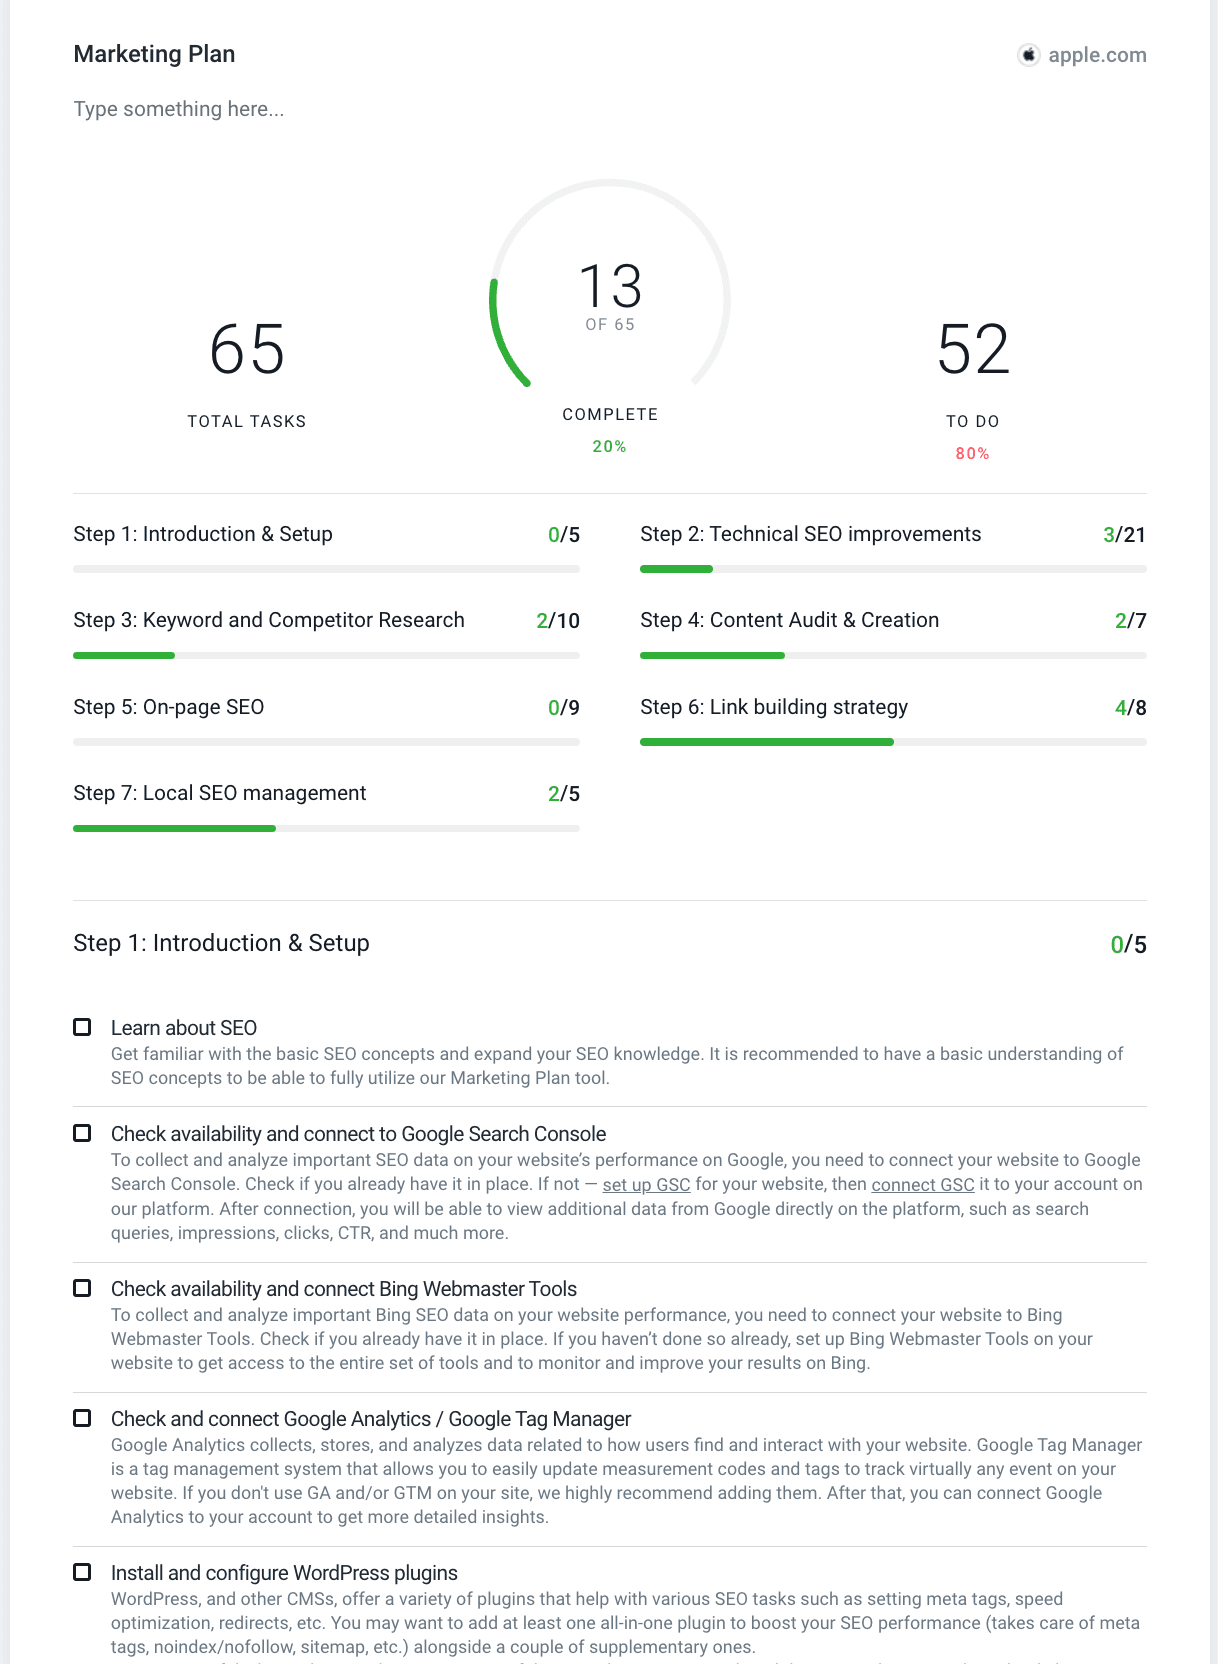
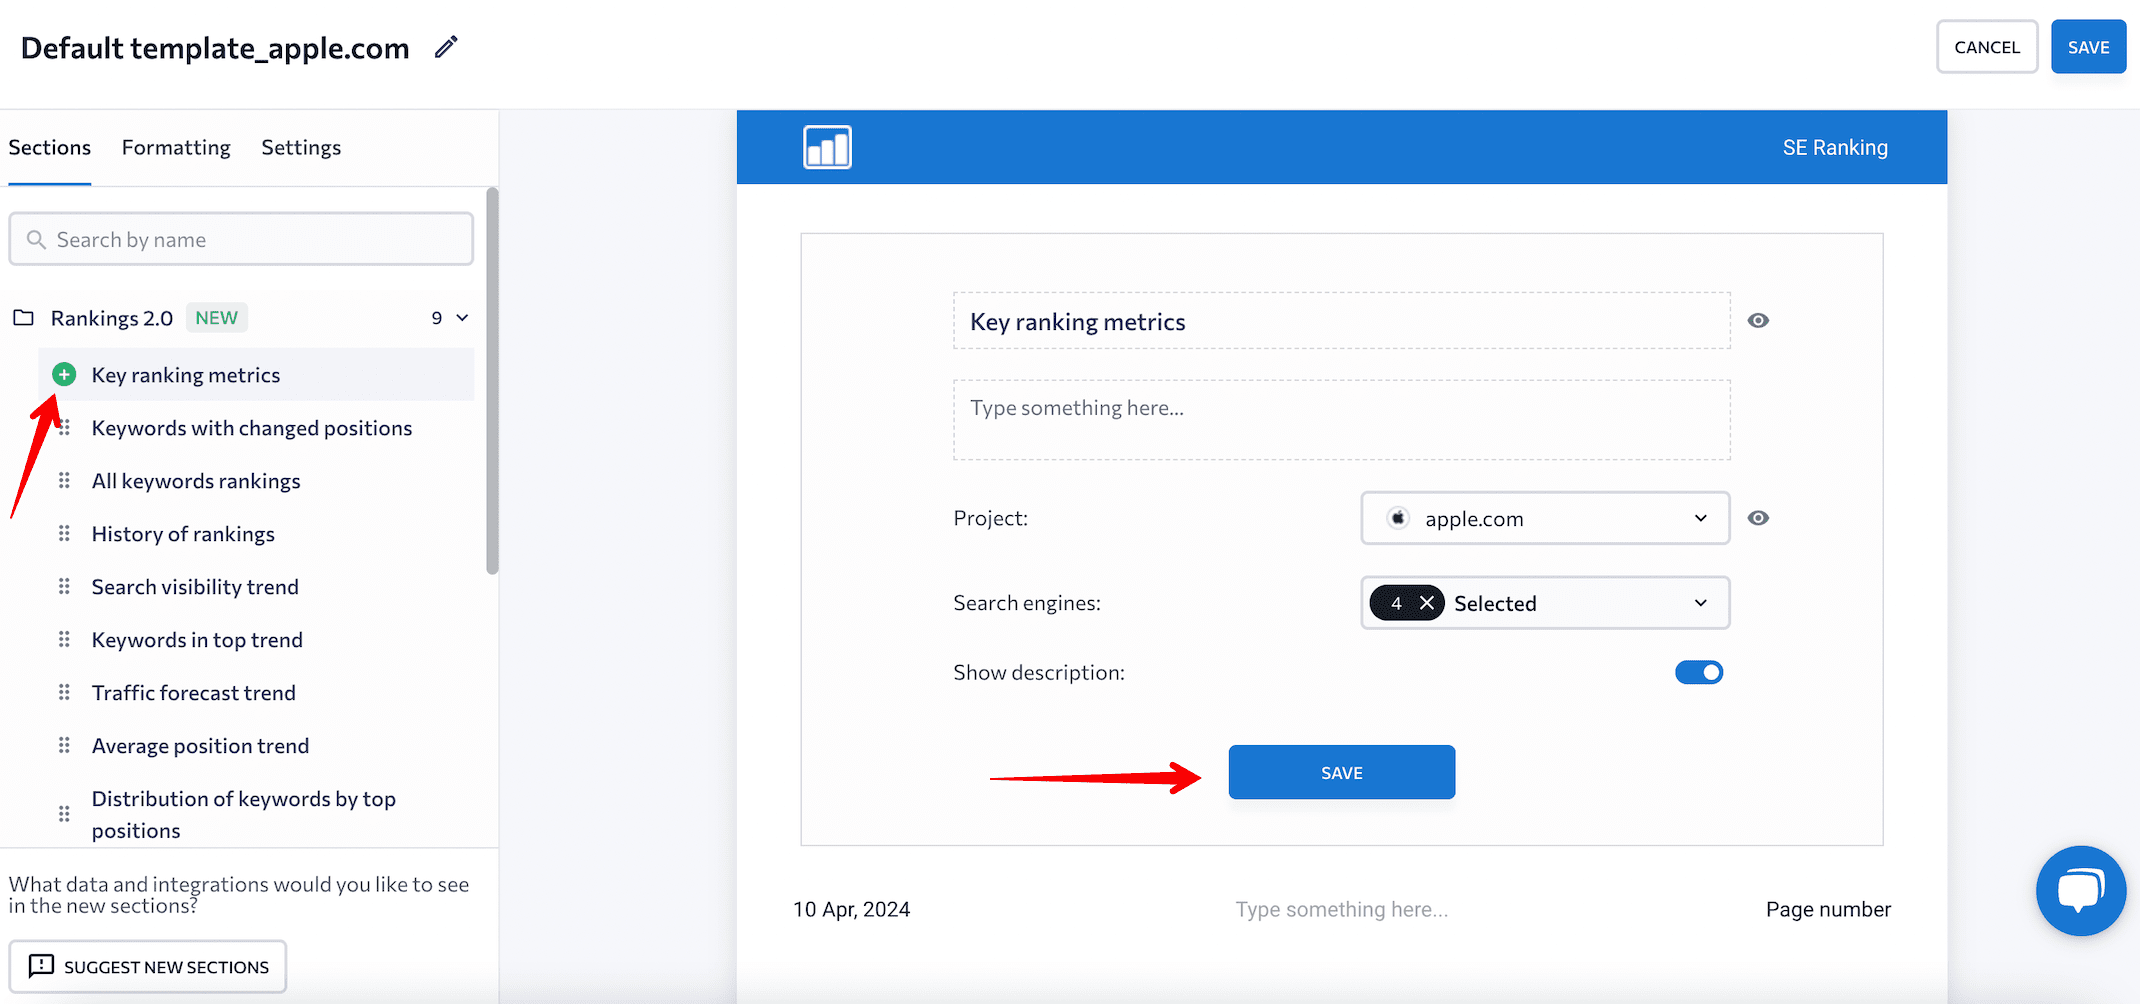
- When creating a report from scratch, you can pick your desired sections and data. Select the pre-made project for your client’s website, choose the reporting period, content language, and then begin creating your report. Add your table of contents and sections containing data on website health, rankings, traffic, keyword research, competitor analysis, and any other metrics you want to cover in the report. Delete or reorder them as needed.
- The tool’s ready-made templates can simplify the report creation process for you. This option includes predefined sections, so just choose the project, report language, and date range. If needed, you can include extra sections in any template. This process usually takes 5–10 minutes.
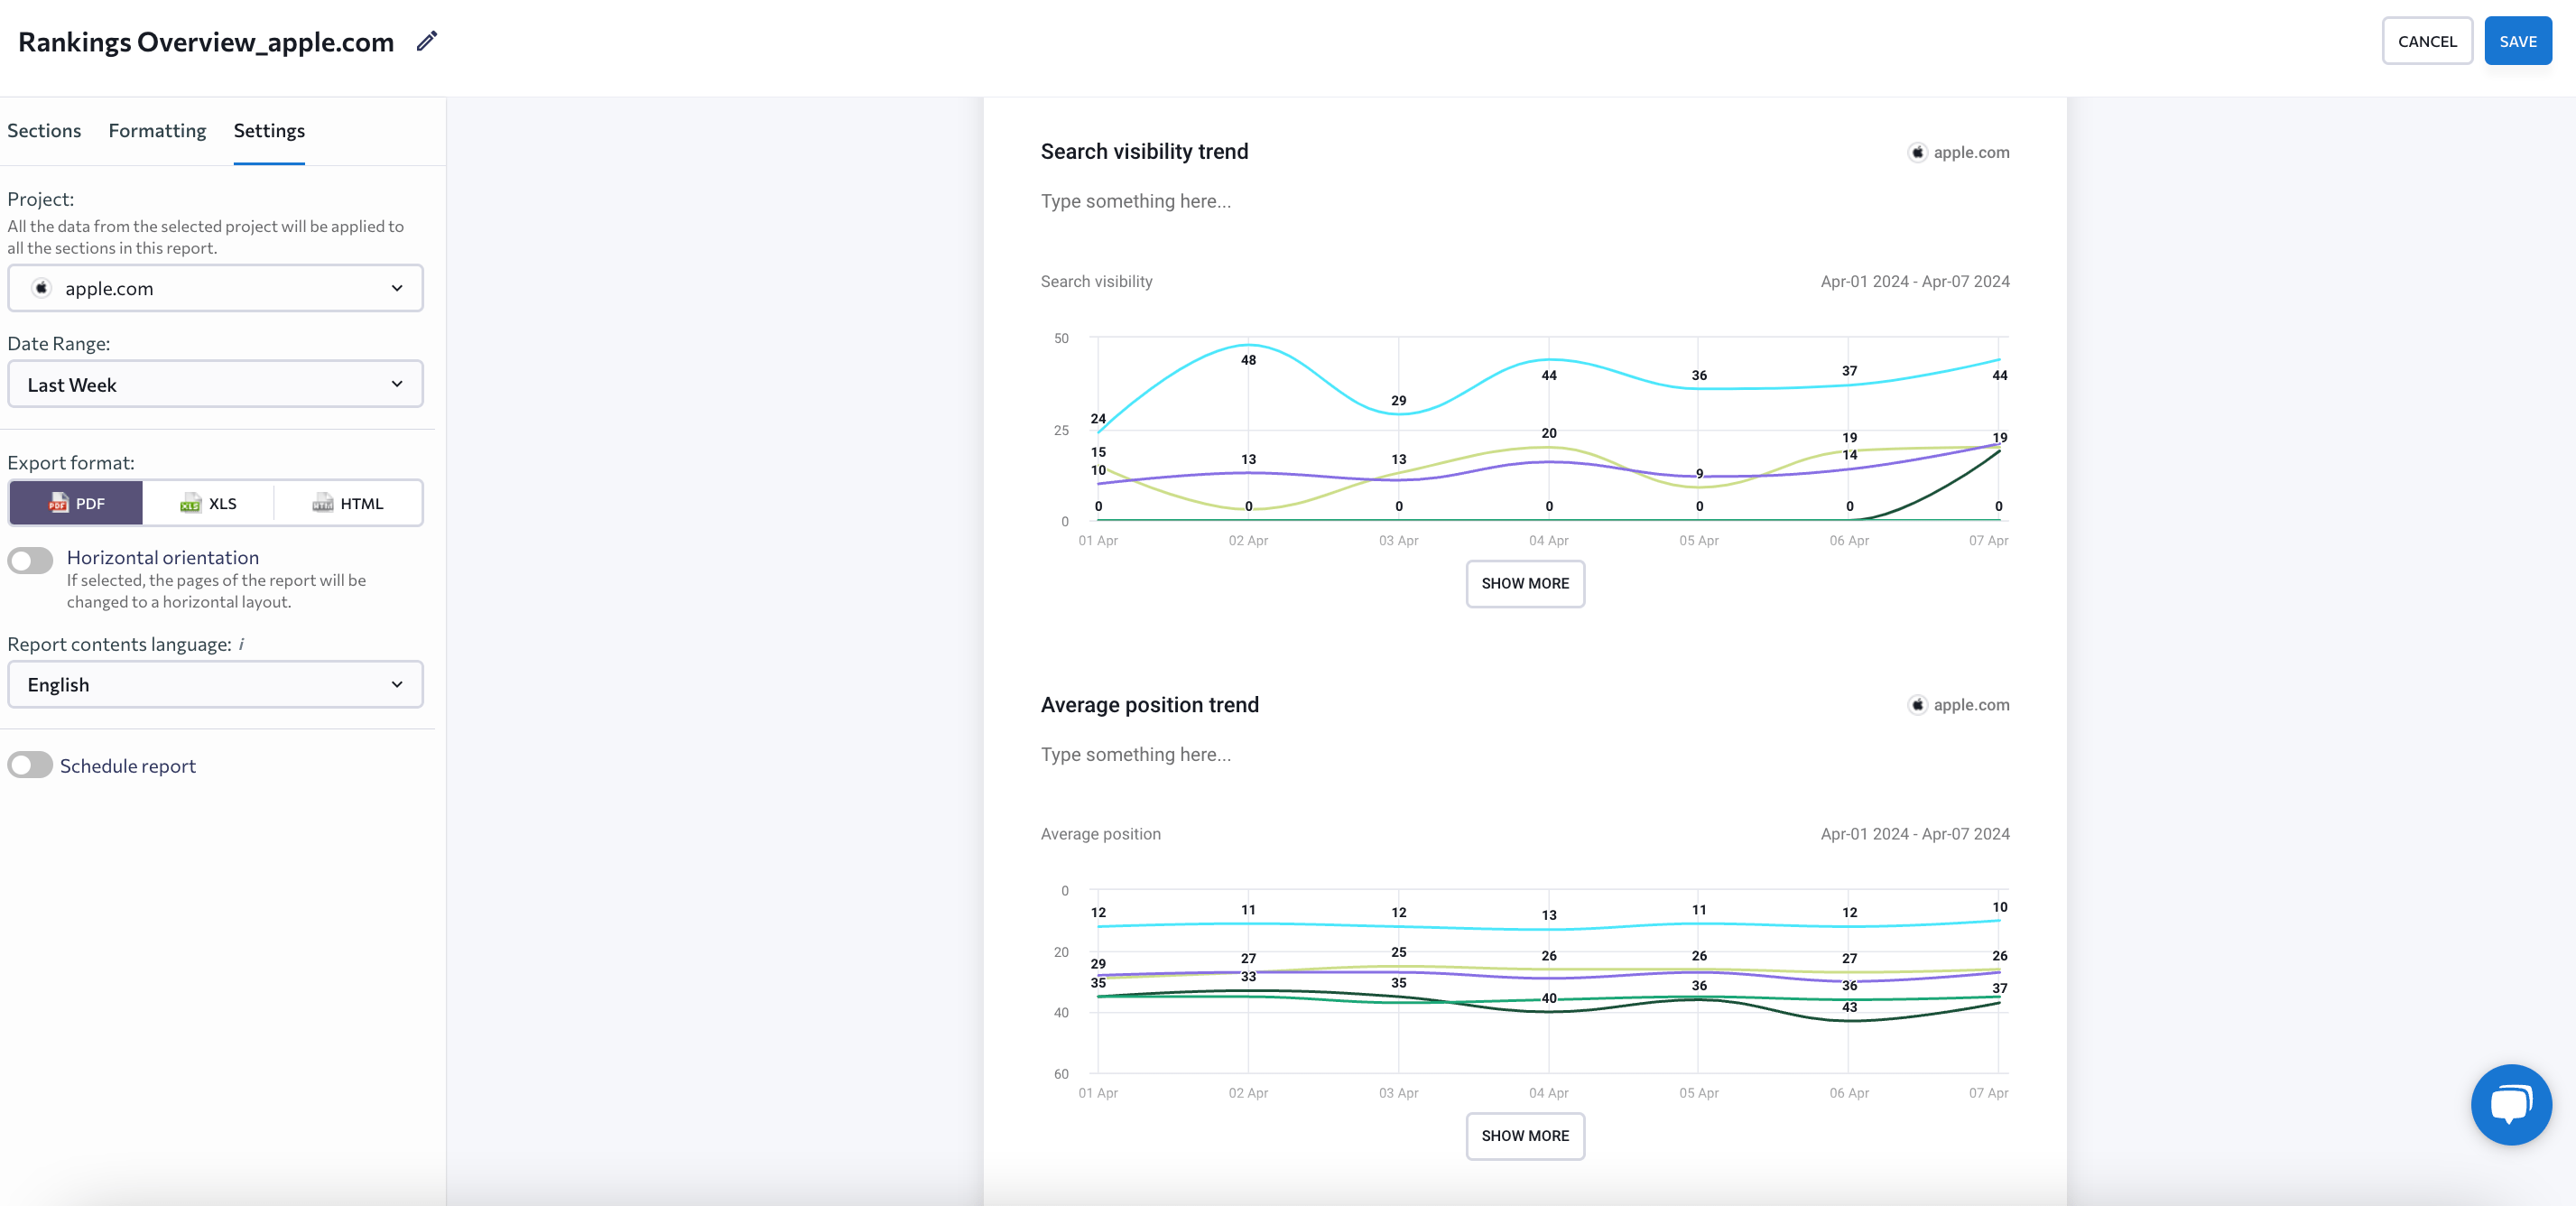
All reports can be downloaded in PDF, CSV, XLS, or HTML format.
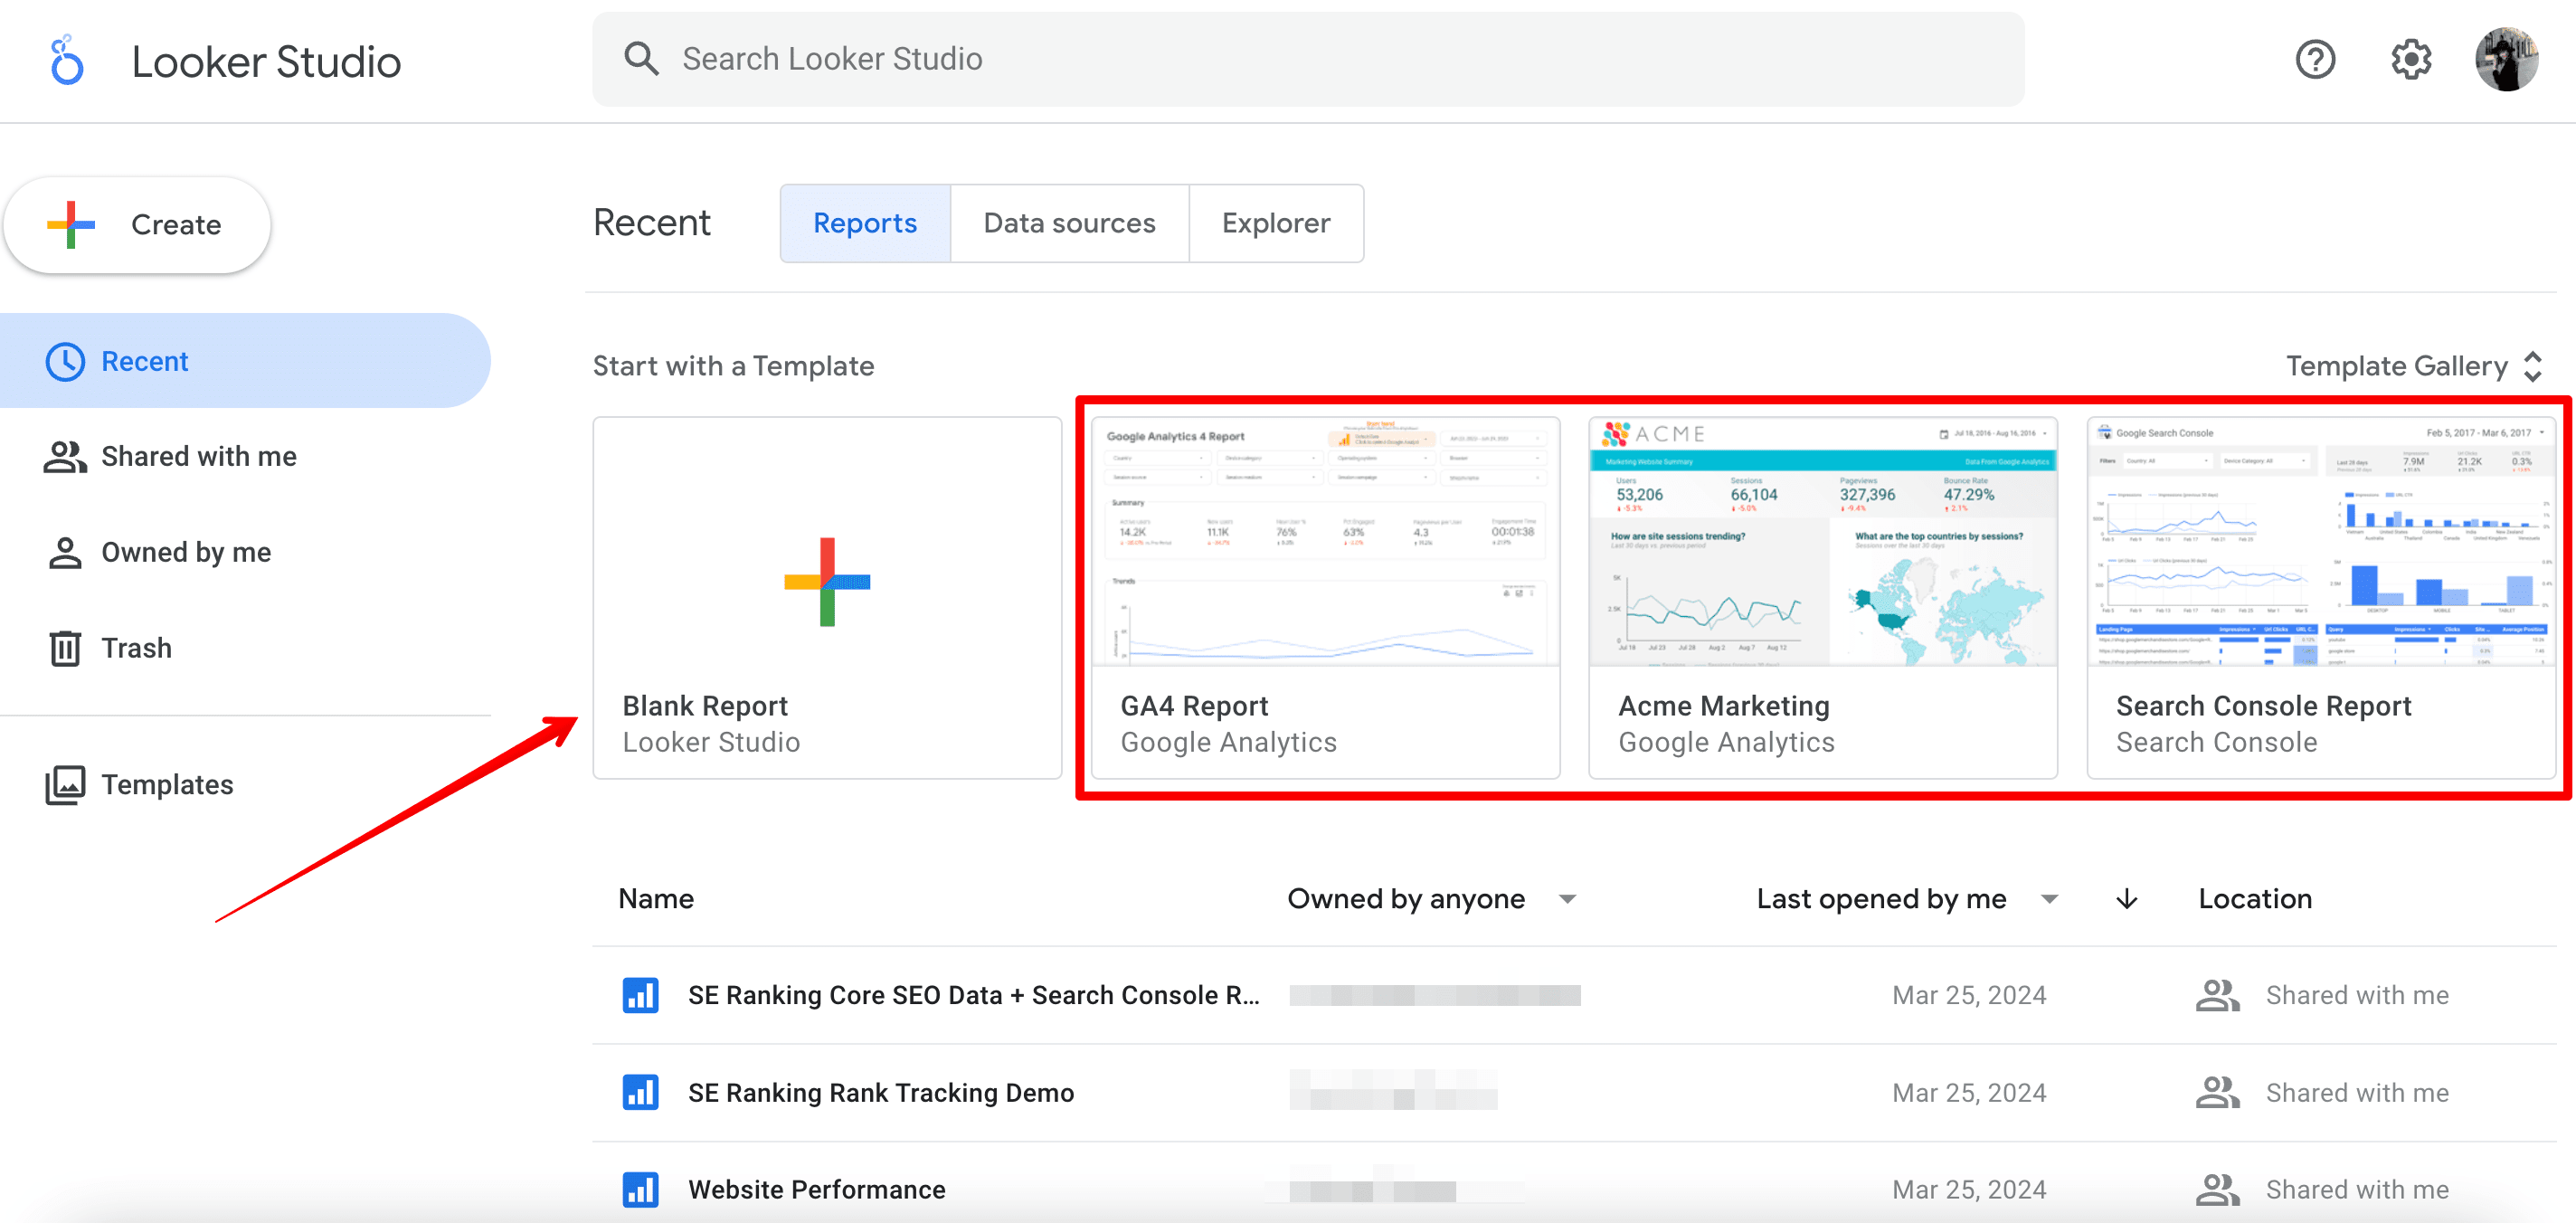
The same goes for Looker Studio. You can either create the report from scratch or select one of the templates. While Looker Studio offers dozens of different templates, don’t hesitate to use the ones we have already mentioned.
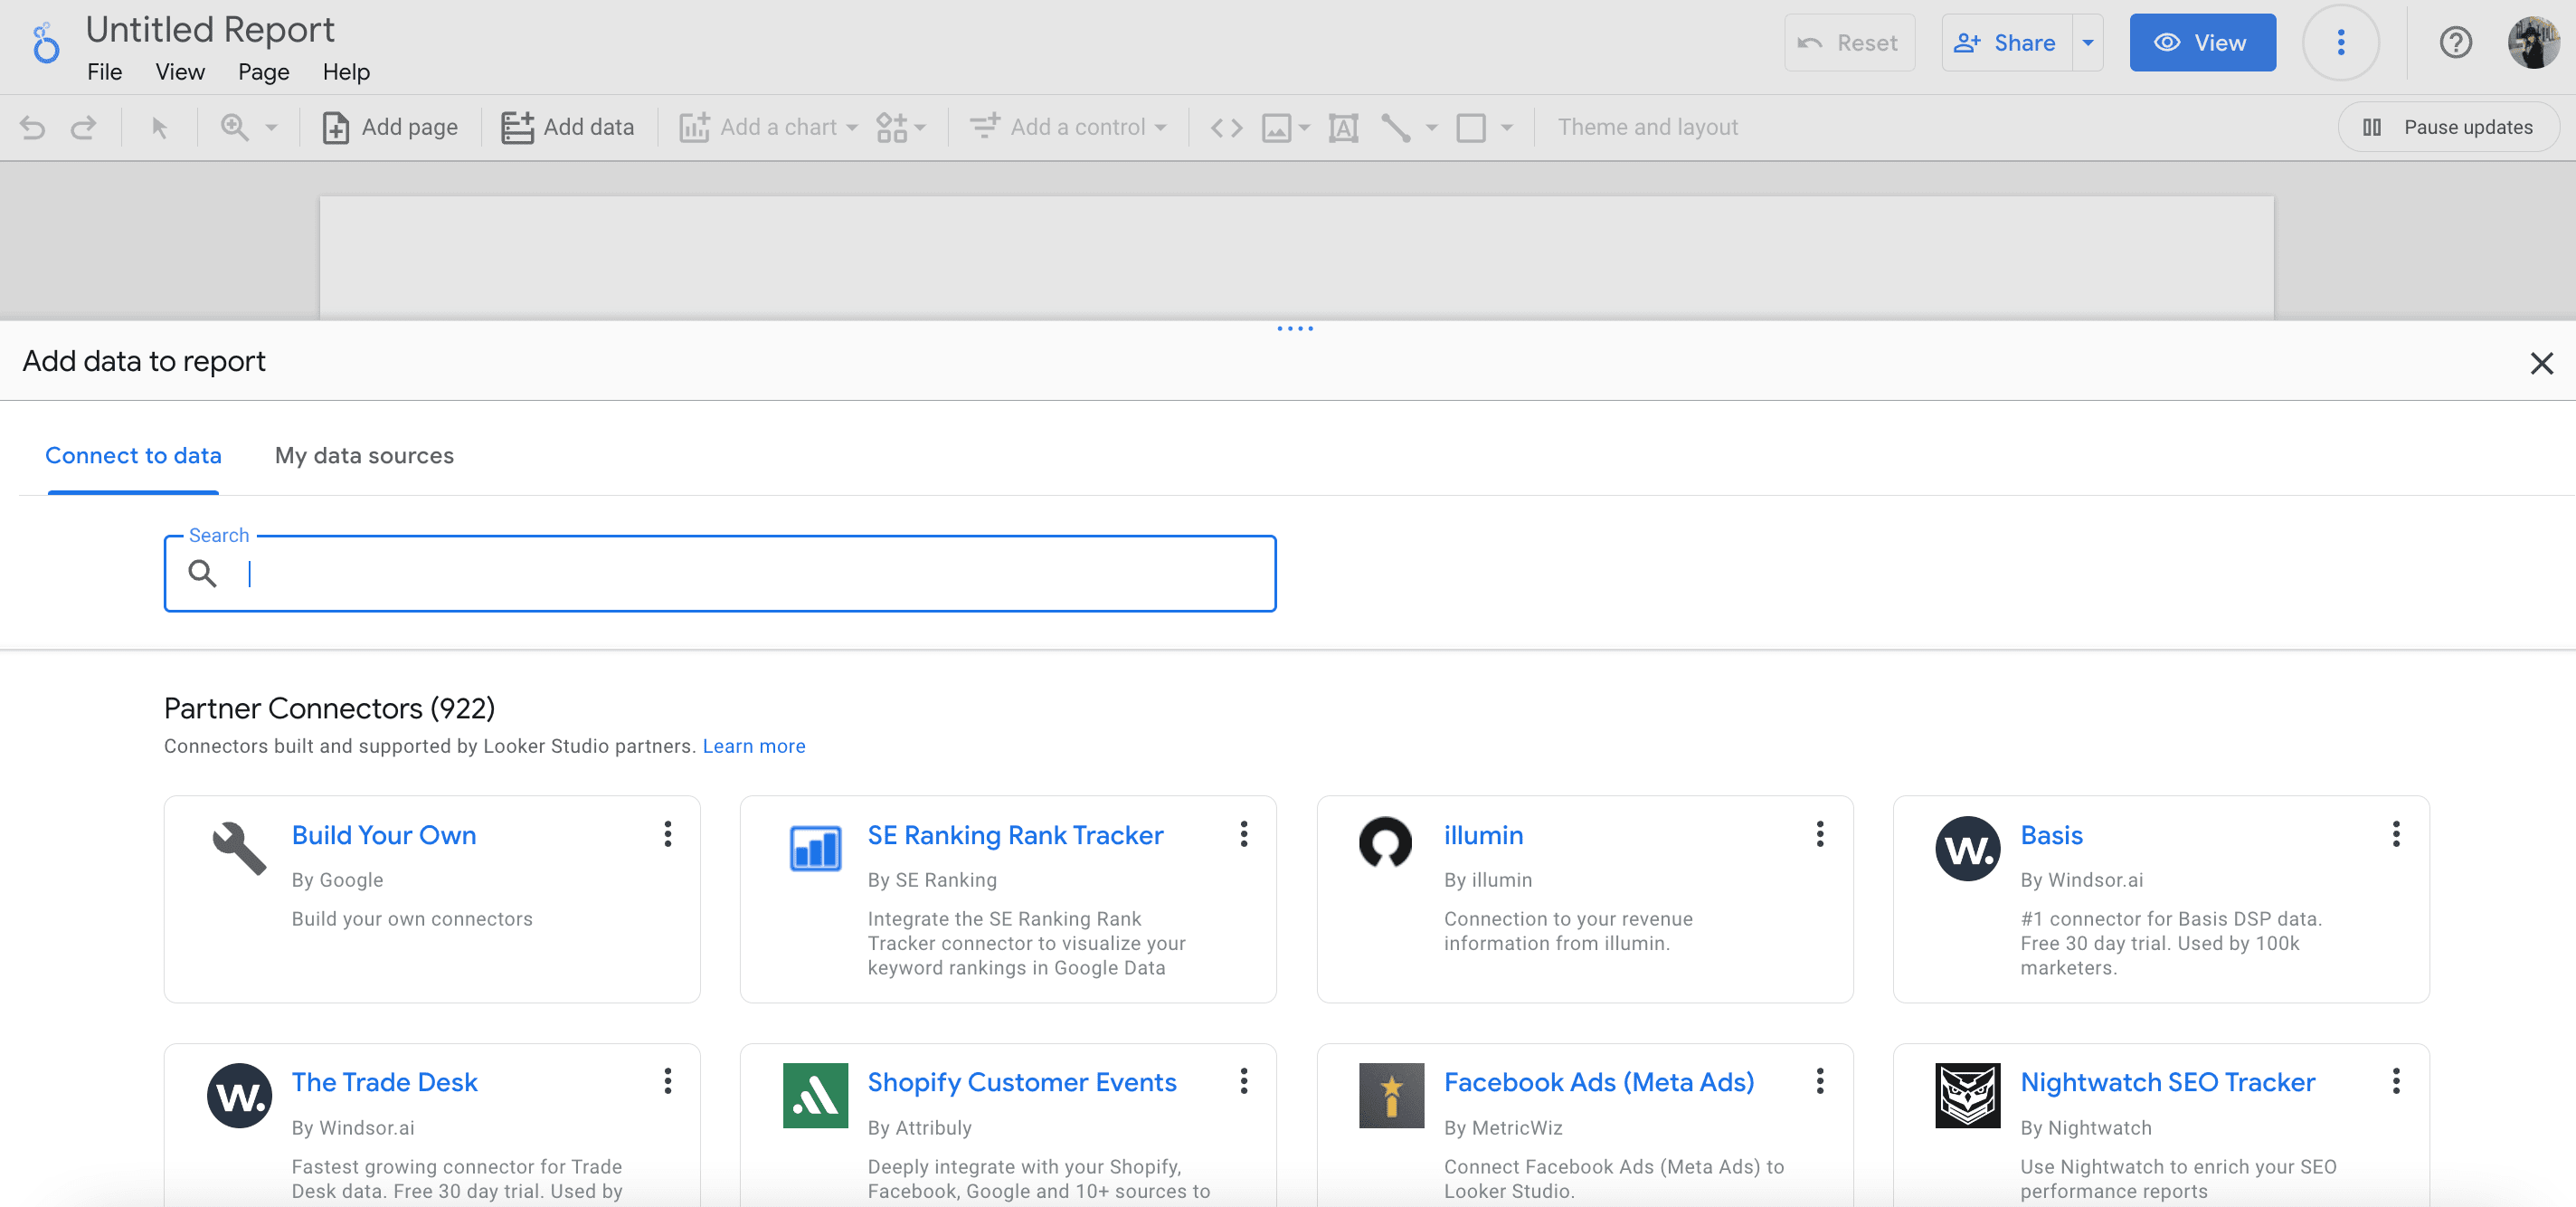
Looker Studio differs from SE Ranking’s Report Builder in that it requires you to connect data from other platforms to create reports. There are more than 1000 data sources available for connection in Looker Studio. When you connect, you’ll be asked to authorize and choose the data sources to pull from. Then you can either customize the report yourself or view a ready-made report with your data.
3. Deciding on delivery
Once your report has been generated, it’s time to deliver it to the client.
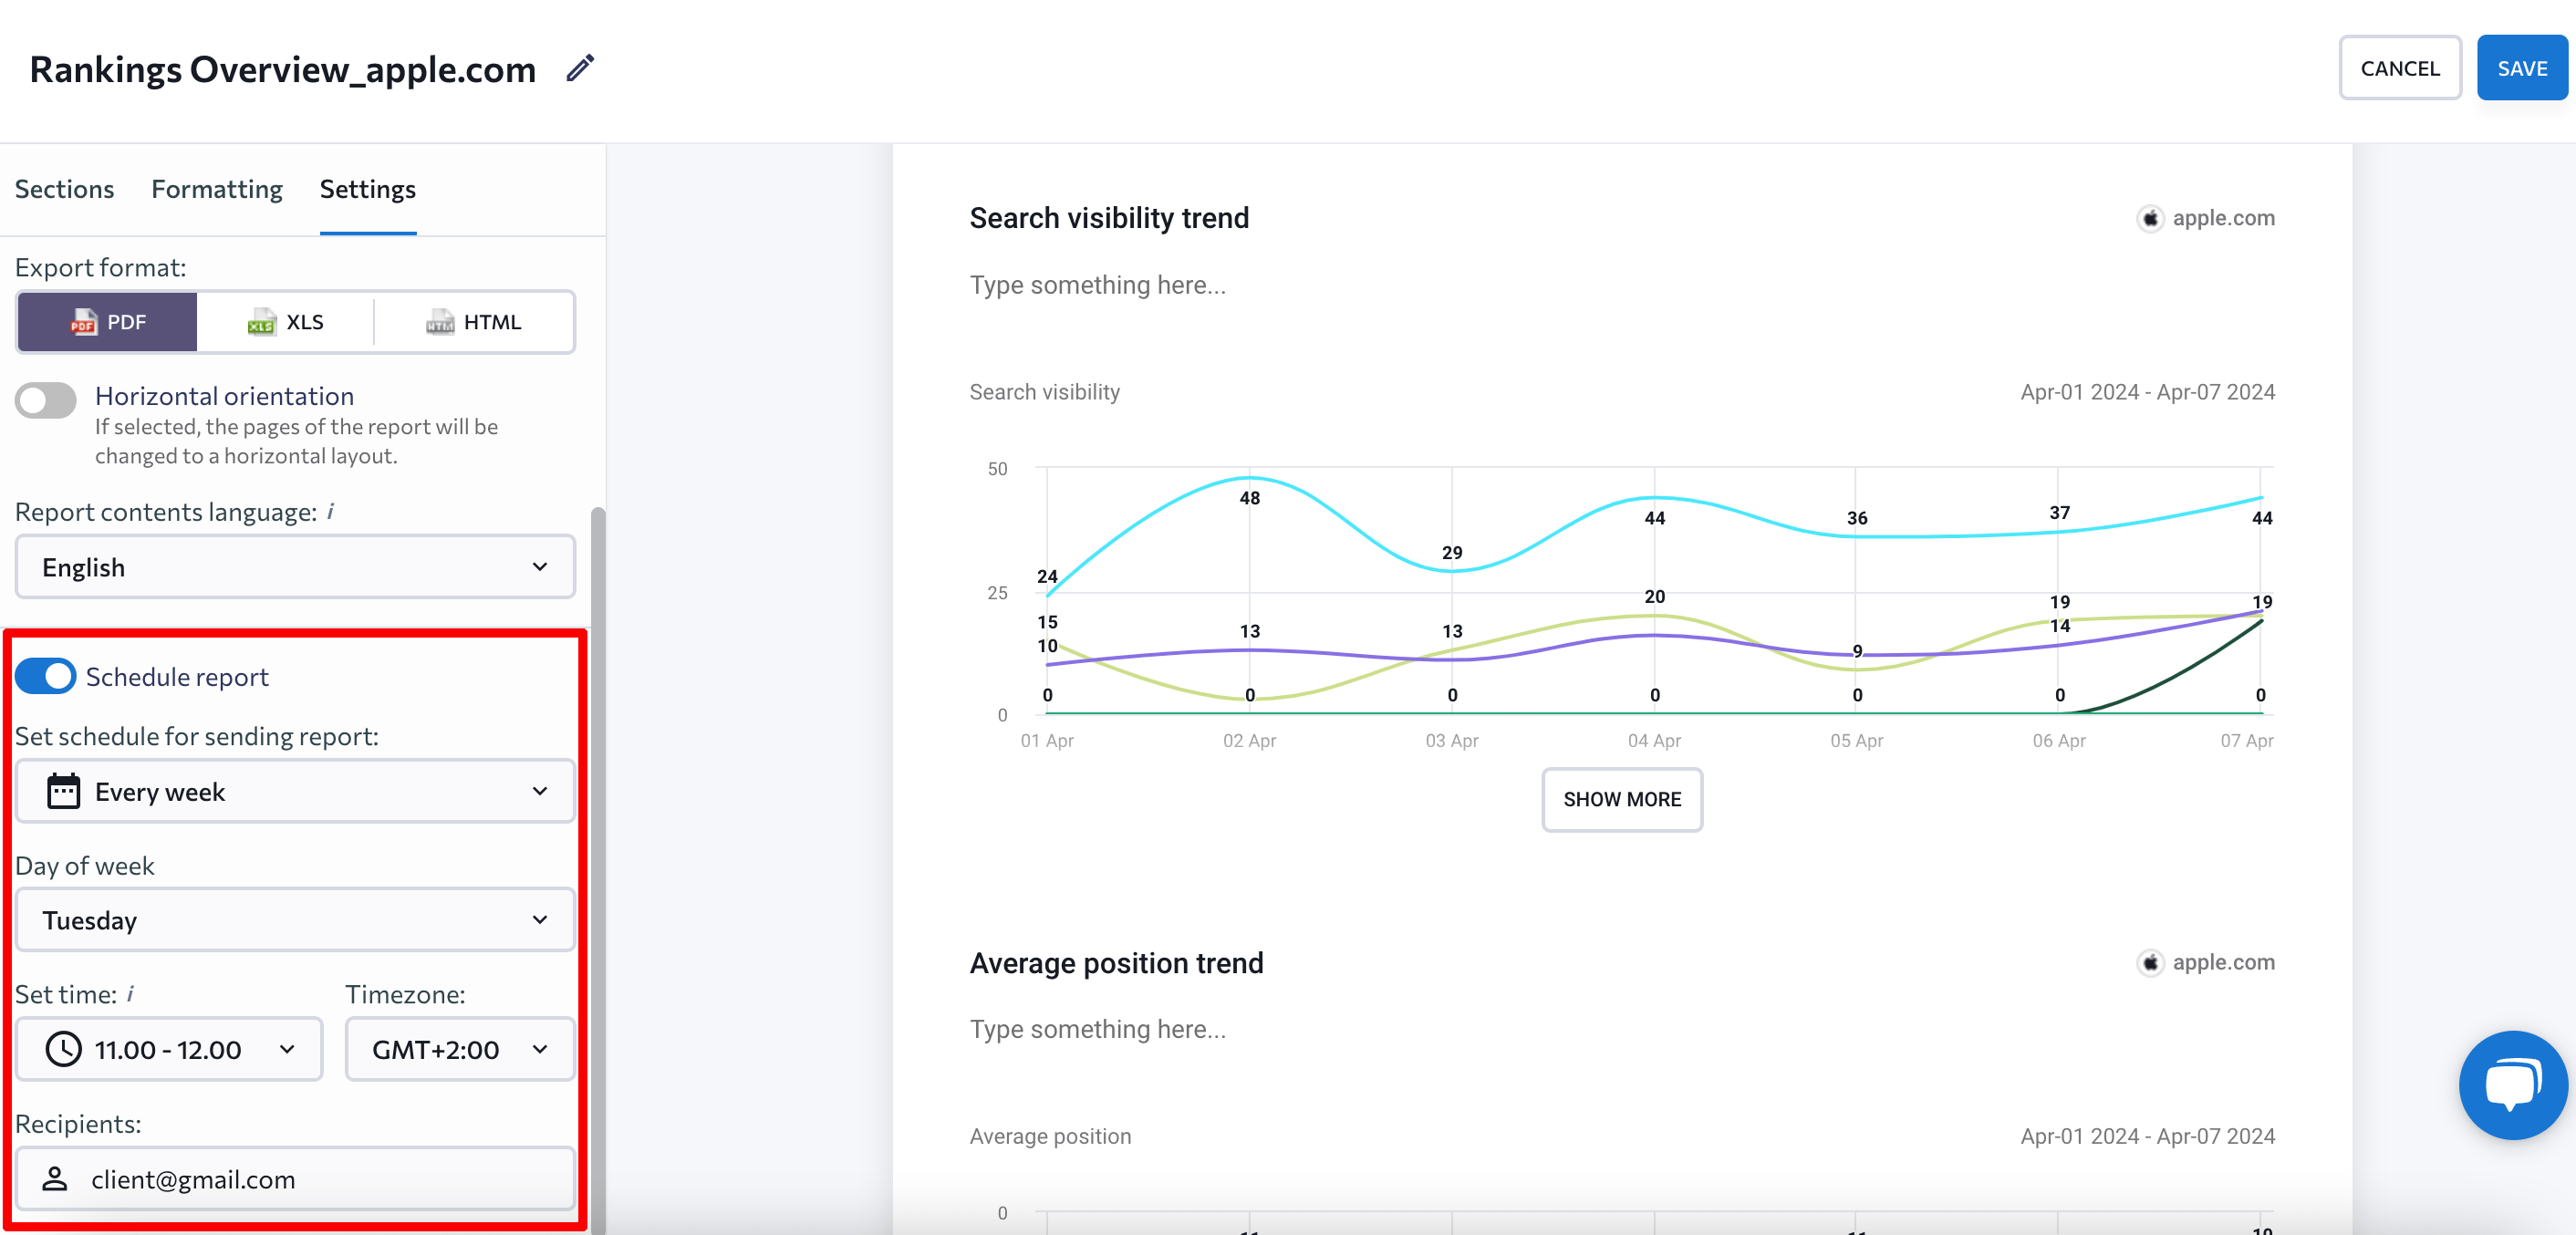
Many reporting tools offer automatic report scheduling. All you have to do is choose how often to send the report (like weekly or monthly) and which day of the week to send it. Then add the client’s email address, and that’s it! The report will now be generated and sent automatically on the day you specified.
SE Ranking has a similar option called “Schedule report,” where you can set up scheduling in as little as 5 minutes.
Bonus: Add your branding
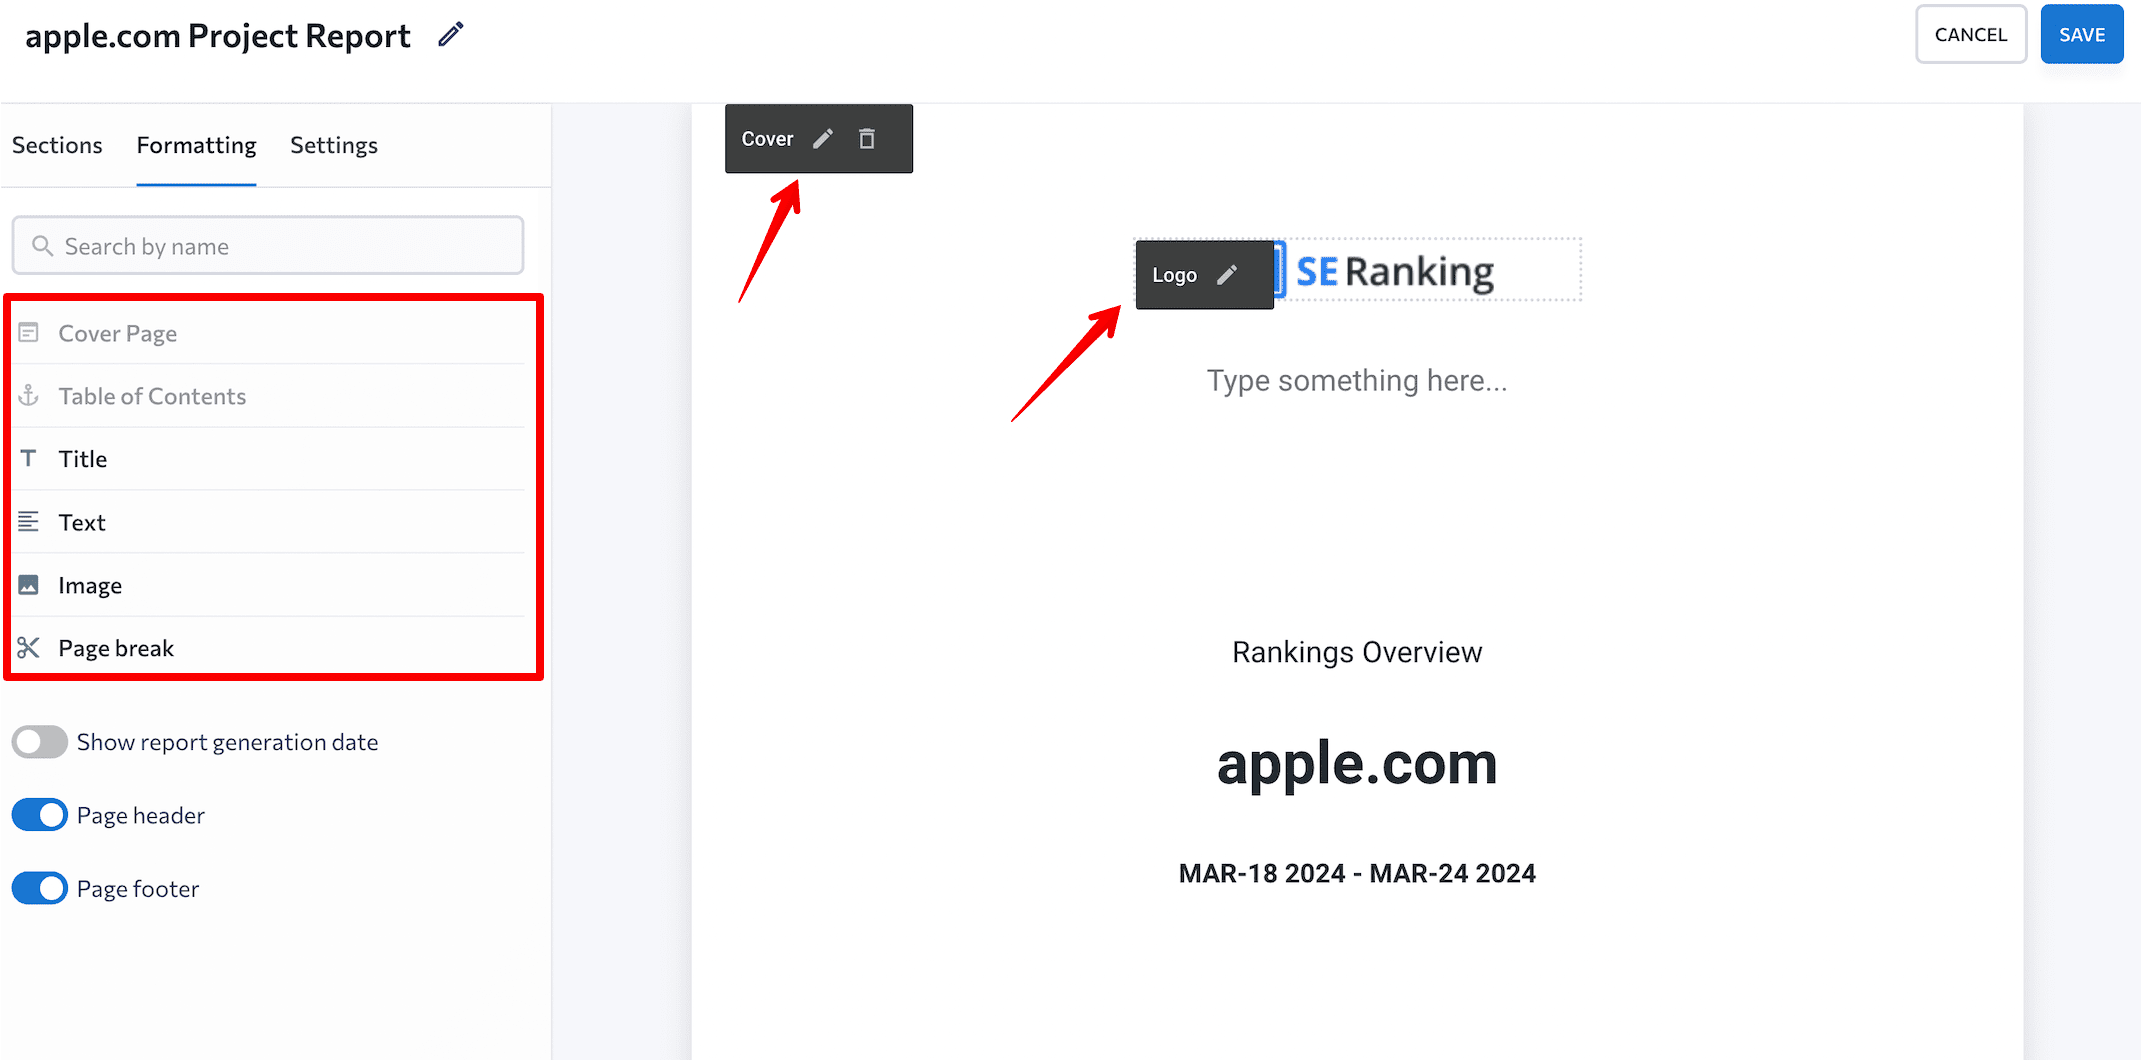
Paying attention to branding is also very important. You must personalize your reports to impress your clients and maintain a professional image. To accomplish this, choose report colors that match your agency’s branding, add your logo, and adjust the cover page. You can also set your scheduled reports to be sent from your corporate email address. This makes them appear as if they’re from you and not SE Ranking. This customization demonstrates to your clients that you’re committed to delivering top-quality work.
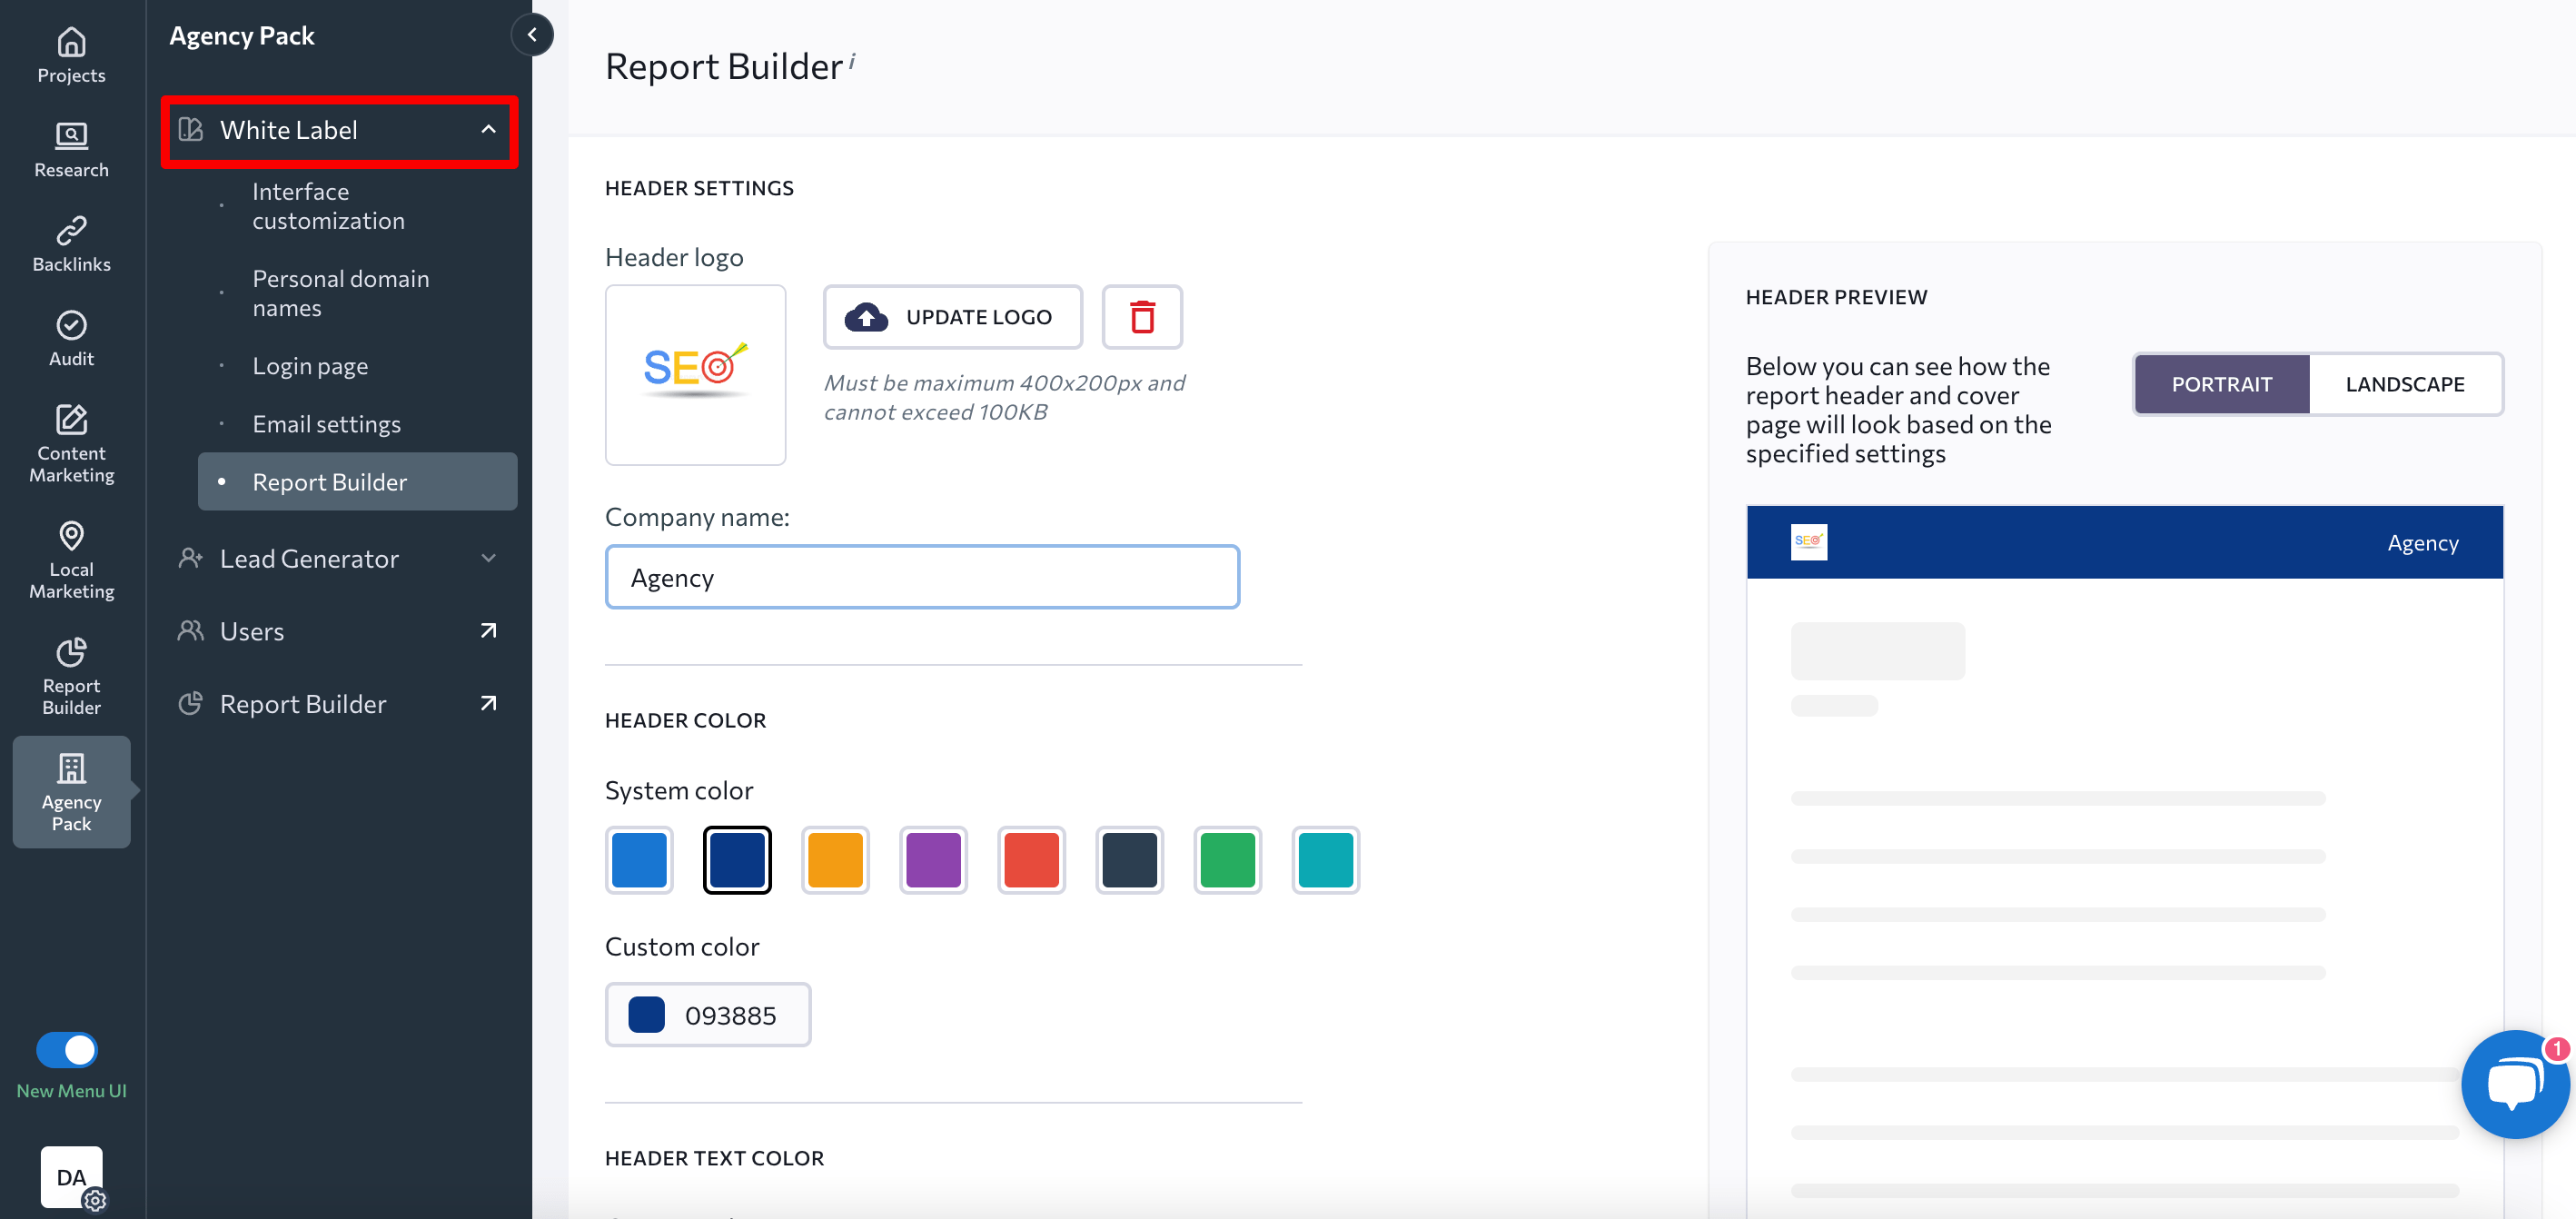
SE Ranking also gives you the flexibility to customize not only the reports but also the entire platform to fit your needs. You can personalize the platform even more with the platform’s White Label feature, even eliminating any mention of SE Ranking. This enables you to share custom access to various platform dashboards, each of which are fully representative of your brand.
Conclusion
Automated SEO reporting isn’t just about saving time. It’s also about improving the client-agency relationship. Automating reporting processes enables you to provide clients with more accurate and transparent information. This demonstrates your dedication to their success. Instead of using various tools and trying to manually analyze and track data, automated reporting pulls in accurate data, which opens up space for your agency to focus more on strategic and creative aspects of the campaigns.
Be mindful when choosing a reporting tool. Make sure it matches your ideal price, functionality, and ease of use.
Also, approach report creation responsibly. This involves considering the client’s business KPIs to reflect the data needed in the report, generating report pages, and deciding on how to deliver the report to the client. Keep report personalization in mind as well.
Follow each of these steps to ensure your reporting set up yields maximal results. Effective reporting goes beyond satisfying existing clients and into scaling and growing your agency.

