Looker Studio connectors: Your go-to for SEO integrations
-
Looker Studio connectors link various data to the platform, including data from Google, SEO and other tools. This makes it a versatile tool for comprehensive data visualization and SEO reporting.
-
Looker Studio offers over 1000 connectors, including 21 Google-owned and over 1017 third-party options. Create various insightful reports and dashboards.
-
Some examples of Looker Studio connectors for core SEO tasks include Google Search Console for tracking search performance and indexing data, Google Analytics for user behavior and traffic insights, SE Ranking for comprehensive SEO analysis, and Google Sheets for integrating custom datasets. Each of these combined give you a complete picture of your SEO efforts.
-
SE Ranking’s connector provides in-depth SEO data, including keyword rankings, website health, competitor insights, and backlink analysis.
Looker Studio has earned its place among the best reporting tools for SEO. It’s the most widely-compatible data visualization and SEO reporting tool. It works with almost any marketing tool and is great for SEO pros, agency managers, and digital marketers. It’s a more easy and effective tool for presenting complex data points to your clients because you don’t have to switch between tons of tools and tabs.
With its over 1000 Looker Studio connectors, including Google products and third-party marketing tools, you can get data on rankings, traffic, backlinks, sales, and other marketing metrics.
Let’s introduce our list of top Looker Studio integrations, zero in on the best ones for core SEO tasks, and then explain how to use them.
What are connectors in Looker Studio
Connectors in Looker Studio are for interlinking different data sources from within one Looker Studio environment. When you use a connector, it adds a data source in Looker Studio. For example, you can pull the search performance data of your client’s website from Google Search Console, then use SE Ranking to pull data on its technical health. After that, you can blend them to create comprehensive, centralized reports that showcase the most important metrics. See our dashboard example later in this article.
Looker Studio connectors list
Connectors are specific to the different types of data you want to visualize. There are currently 21 Looker Studio connectors offered directly by Google, including Google Analytics, Google Search Console, etc.
See all of them in the table below.
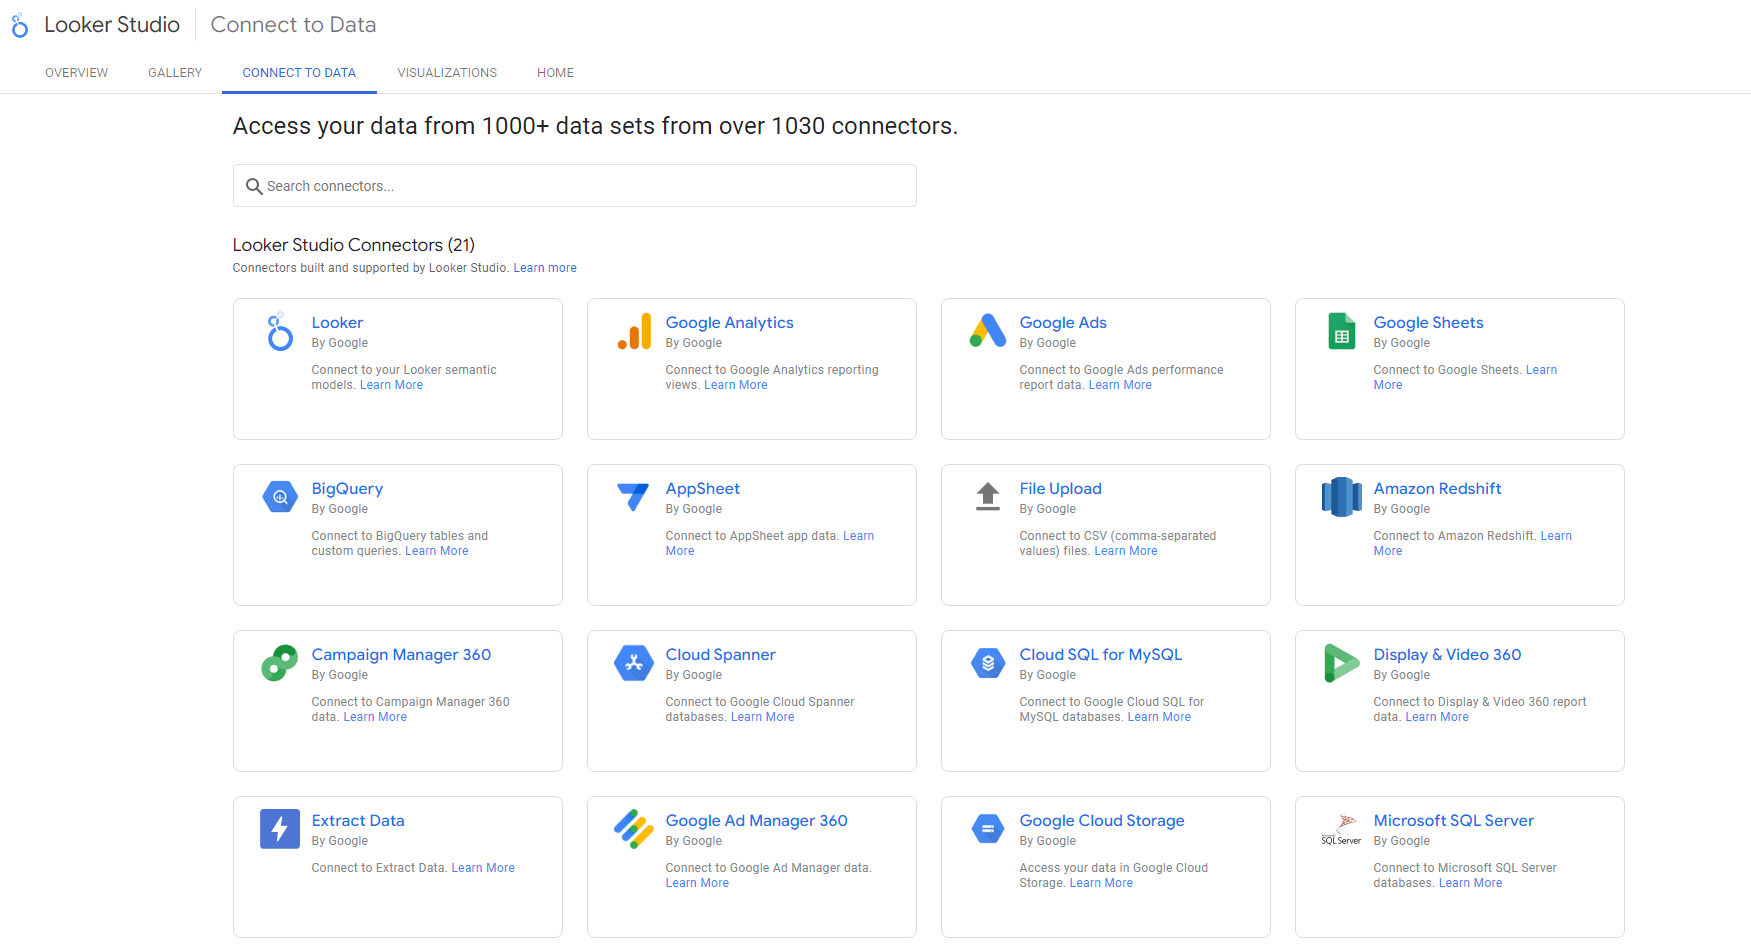
Google-owned Looker Studio Connectors
Data provided
Custom data models, business metrics, KPIs
Data provided
Website traffic, user behavior, event data
Data provided
Ad performance and campaign metrics
Data provided
Spreadsheet data, calculations
Data provided
Large-scale data analysis, custom queries
Data provided
Custom app data, user-generated content
Data provided
CSV files, spreadsheets, custom data sets
Data provided
Data warehouse queries, business intelligence
Data provided
Display ad performance, campaign metrics
Data provided
Globally distributed relational database data
Data provided
Managed MySQL database information
Data provided
Video ad performance, audience insights
Data provided
Data from various sources in Looker Studio
Data provided
Ad inventory, revenue, yield management data
Data provided
Stored files and data in the cloud
Data provided
Relational database queries and analysis
Data provided
Relational database information
Data provided
Open-source relational database data
Data provided
Search ad performance across platforms
Data provided
Website search performance, indexing data
Data provided
Video performance, viewer engagement metrics
Custom data models, business metrics, KPIs
Website traffic, user behavior, event data
Ad performance and campaign metrics
Spreadsheet data, calculations
Large-scale data analysis, custom queries
Custom app data, user-generated content
CSV files, spreadsheets, custom data sets
Data warehouse queries, business intelligence
Display ad performance, campaign metrics
Globally distributed relational database data
Managed MySQL database information
Video ad performance, audience insights
Data from various sources in Looker Studio
Ad inventory, revenue, yield management data
Stored files and data in the cloud
Relational database queries and analysis
Relational database information
Open-source relational database data
Search ad performance across platforms
Website search performance, indexing data
Video performance, viewer engagement metrics
There are also 1017 third-party or partner connectors, including SEO automation tools like SE Ranking, Semrush, Ahrefs, etc. Also note that the list of partner connectors is constantly growing.
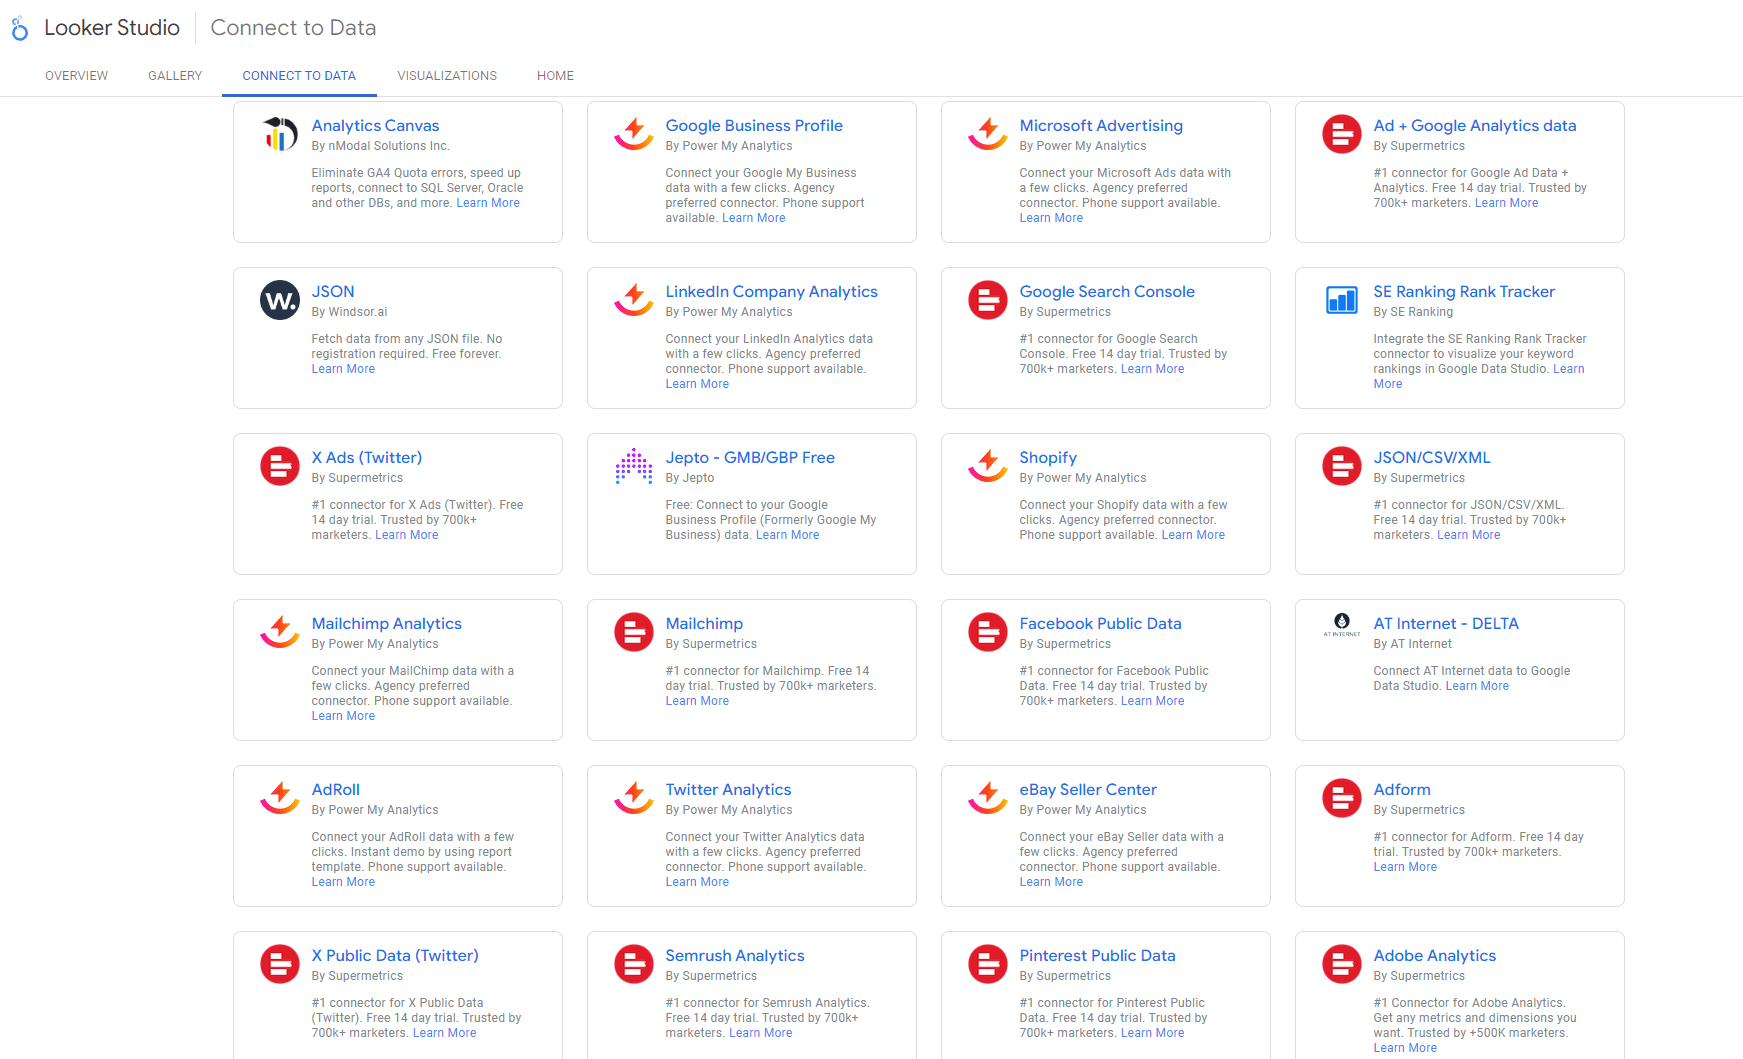
We will highlight 12 of them in the table below.
Partner connectors
Data provided
Keyword rankings, website audit, competitor analysis, backlink data
Data provided
Position tracking, domain analytics
Data provided
Data from site audit, site explorer, and rank tracker
Data provided
Local search performance, customer reviews, business listing insights
Data provided
Data from multiple marketing platforms, custom metrics
Data provided
Email campaign performance, subscriber data, list growth
Data provided
Campaign data, cross-channel attribution
Data provided
Ad performance, engagement rates, audience targeting data
Data provided
Sales data, listing performance, buyer behavior
Data provided
Advertising data, campaign performance
Data provided
Post engagement, follower demographics, story performance
Data provided
Page performance, post reach, audience engagement
Keyword rankings, website audit, competitor analysis, backlink data
Position tracking, domain analytics
Data from site audit, site explorer, and rank tracker
Local search performance, customer reviews, business listing insights
Data from multiple marketing platforms, custom metrics
Email campaign performance, subscriber data, list growth
Campaign data, cross-channel attribution
Ad performance, engagement rates, audience targeting data
Sales data, listing performance, buyer behavior
Advertising data, campaign performance
Post engagement, follower demographics, story performance
Page performance, post reach, audience engagement
Note the Data provided column gives you a general overview of the type of data typically available through each connector. The exact data points may vary based on specific configurations, permissions, etc.
Looker Studio also lets you create your own Community Connectors using Google Apps Script. These custom connectors can work with any internet-accessible data source, from social media platforms to private company databases. You can build, test, and deploy your connector, then share it directly with colleagues or even submit it to the Looker Studio Connector Gallery for everyone to use.
Also note that Google-owned connectors are easy to use but may have limited data coverage, granularity, and quotas. This can be tricky for larger businesses or ones that need more specific insights.
To close these gaps, third-party tool connectors like SE Ranking offer specialized data that can be blended with primary source data for more detailed insights. For instance, SE Ranking’s keyword position data is more accurate compared to GSC’s. Additionally, SE Ranking provides metrics not offered by GSC, such as search visibility, which enhances SEO analysis depth.
4 Looker Studio connectors for core SEO tasks
We define the following Looker Studio connectors as the primary sources of material for you to paint a clear picture of your SEO efforts with, specifically as they relate to your core SEO tasks. Each of these connectors brings crucial insights to the table. Let’s explain how and why in more detail.
Google Search Console
Google Search Console is a must-use free tool from Google that helps you track your website’s presence in Google. This integration helps you visualize and analyze your site’s appearance and performance in Google search, making it easier for you to track SEO progress and identify areas for improvement.
Data provided:
- Search performance metrics, including clicks, impressions, click-through rate (CTR), and average position
- Search terms with all performance metrics
- Page data with all performance metrics
- Country data of users finding your site along with performance metrics by country
- Types of devices used (desktop, mobile, tablet) with all performance metrics by device type
- Performance data for different search result types (e.g., rich results)
- Indexing issues
- Core Web Vitals
- Etc.
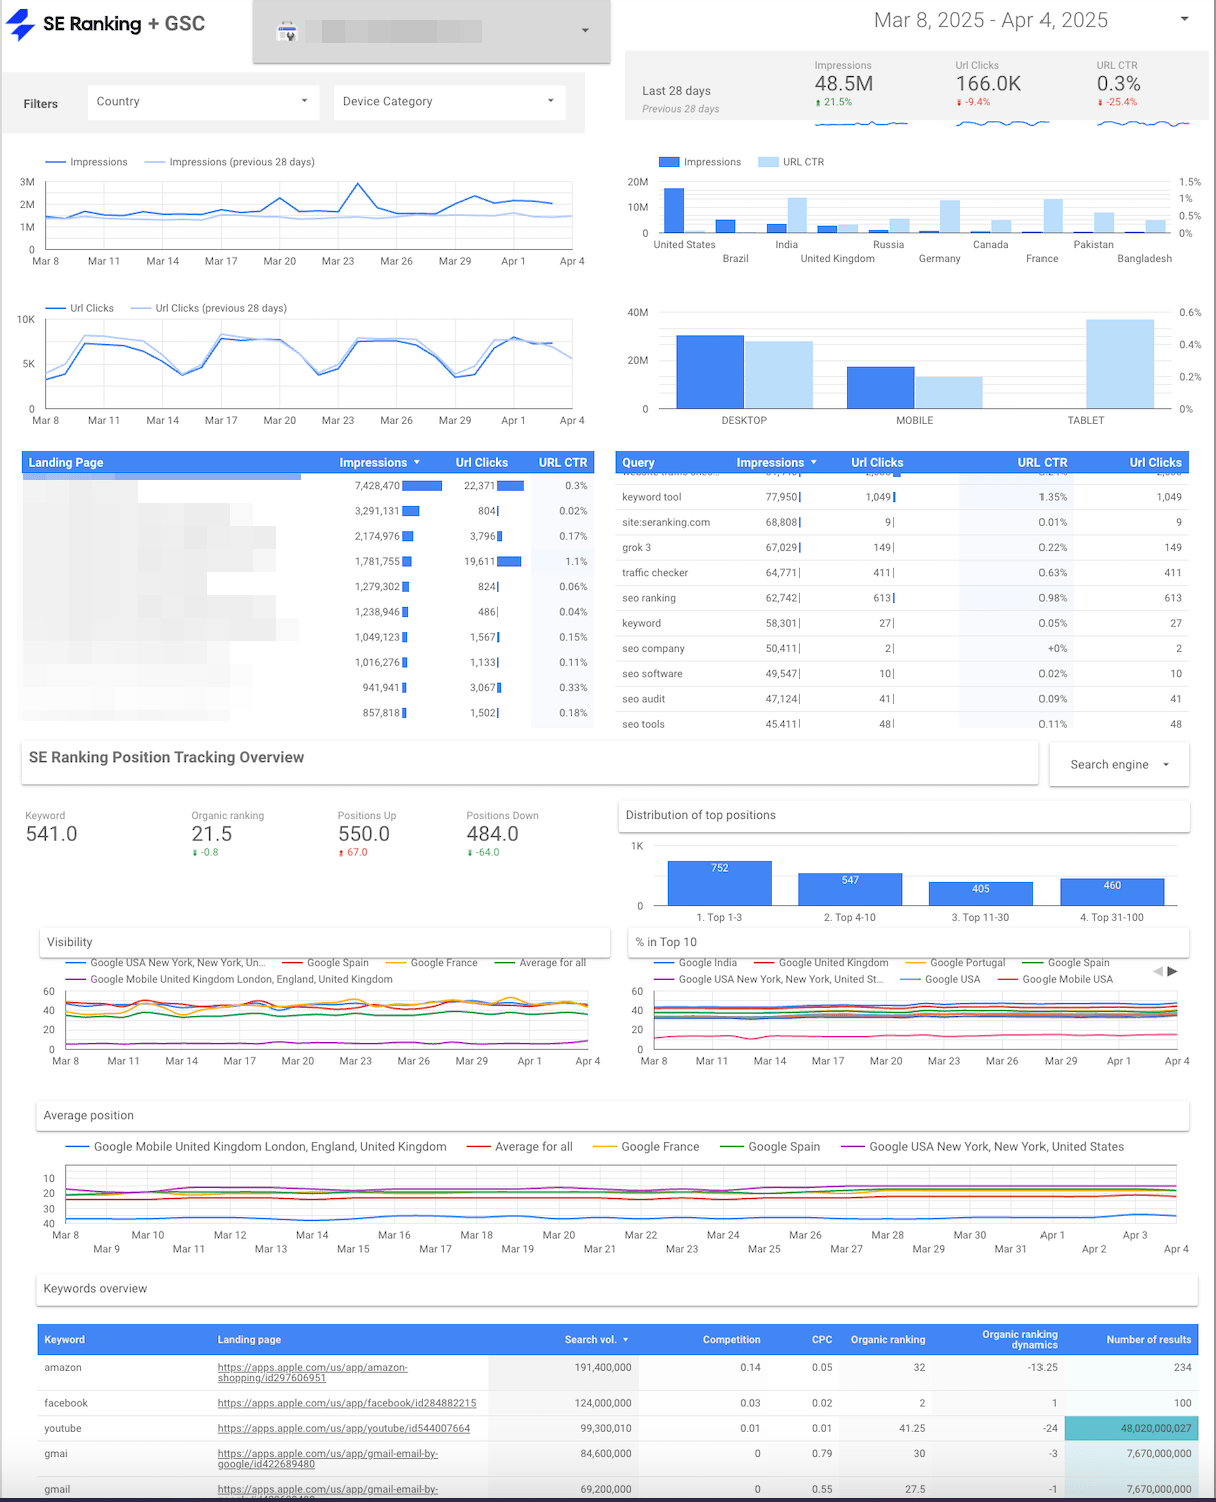
In the example below, you can see SE Ranking’s Core SEO performance monitoring dashboard. This visualization uses data from Google Search Console to provide a real-time view of your website’s SEO performance in search results, while incorporating SE Ranking data to offer a comprehensive position overview.
Also read: How to connect to Search Console
Google Analytics 4
Google Analytics 4 (GA4) helps businesses get data from websites and apps to better understand their audience, track conversions, and optimize their online presence. The Google Analytics connector offers a deeper understanding of a website’s performance and key website metrics. This data helps you connect the dots between your SEO efforts and real user behavior.
Data provided:
- Sessions and users
- Bounce rate and time on site
- Conversion rates and other key events
- Landing page performance
- User demographics and interests
- Detailed breakdown of traffic sources (organic, referral, etc.)
- Etc.
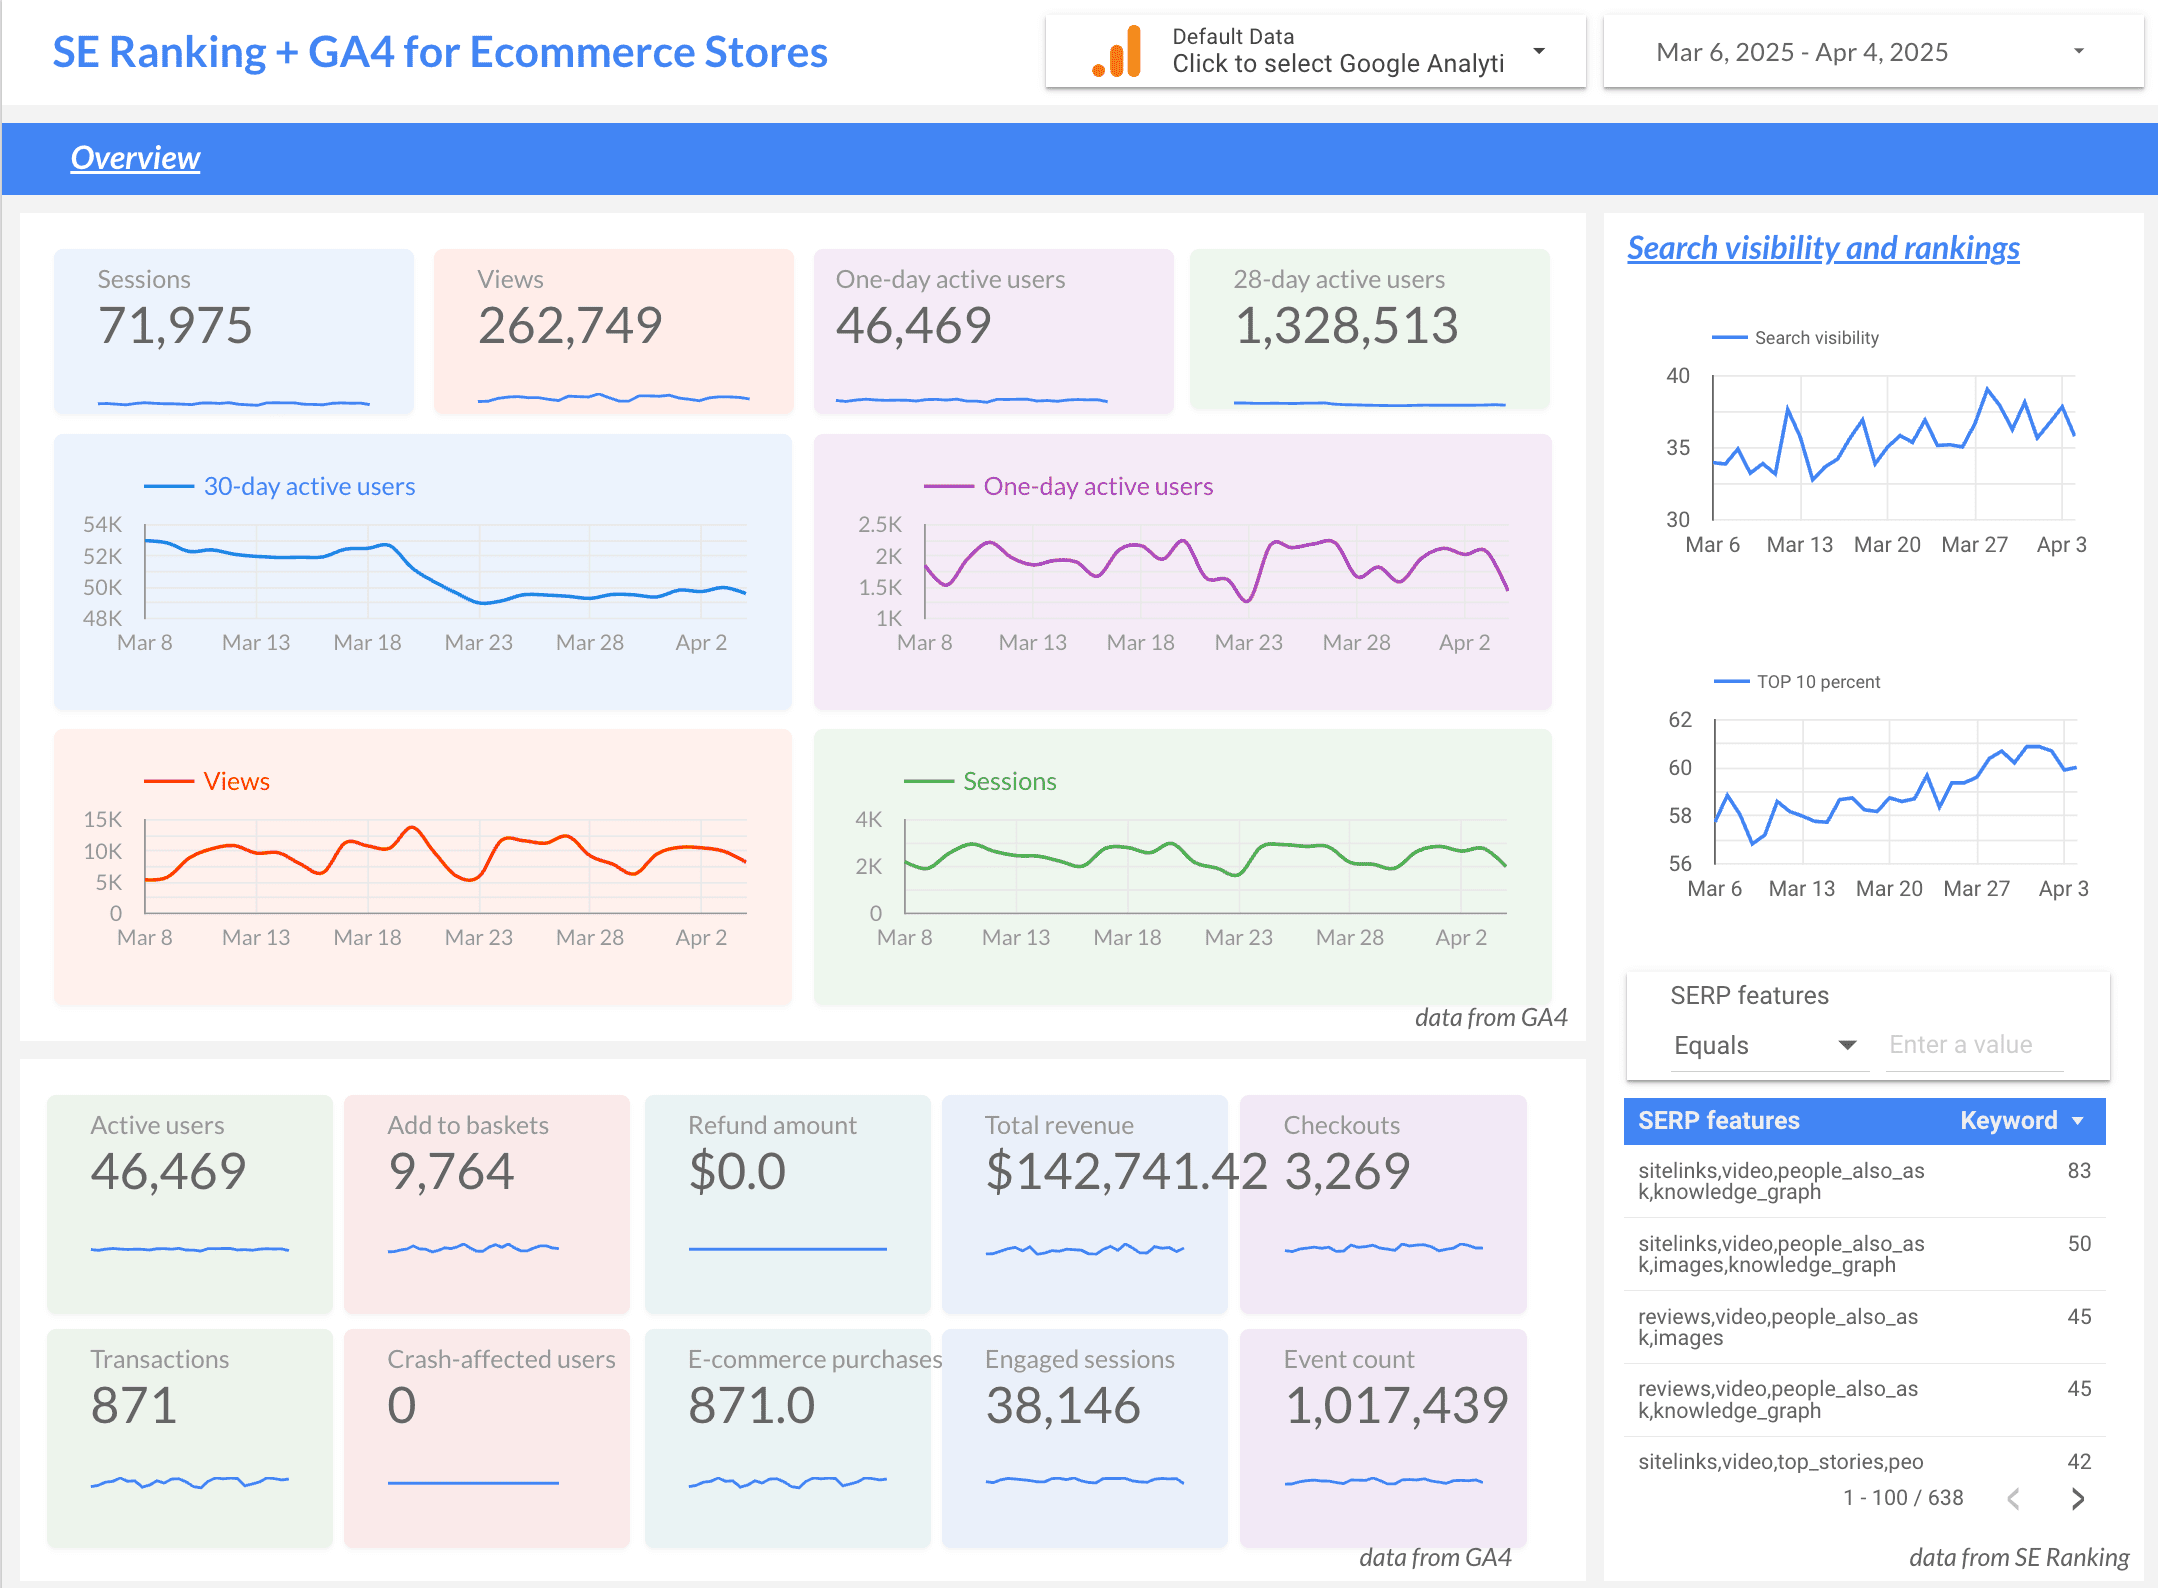
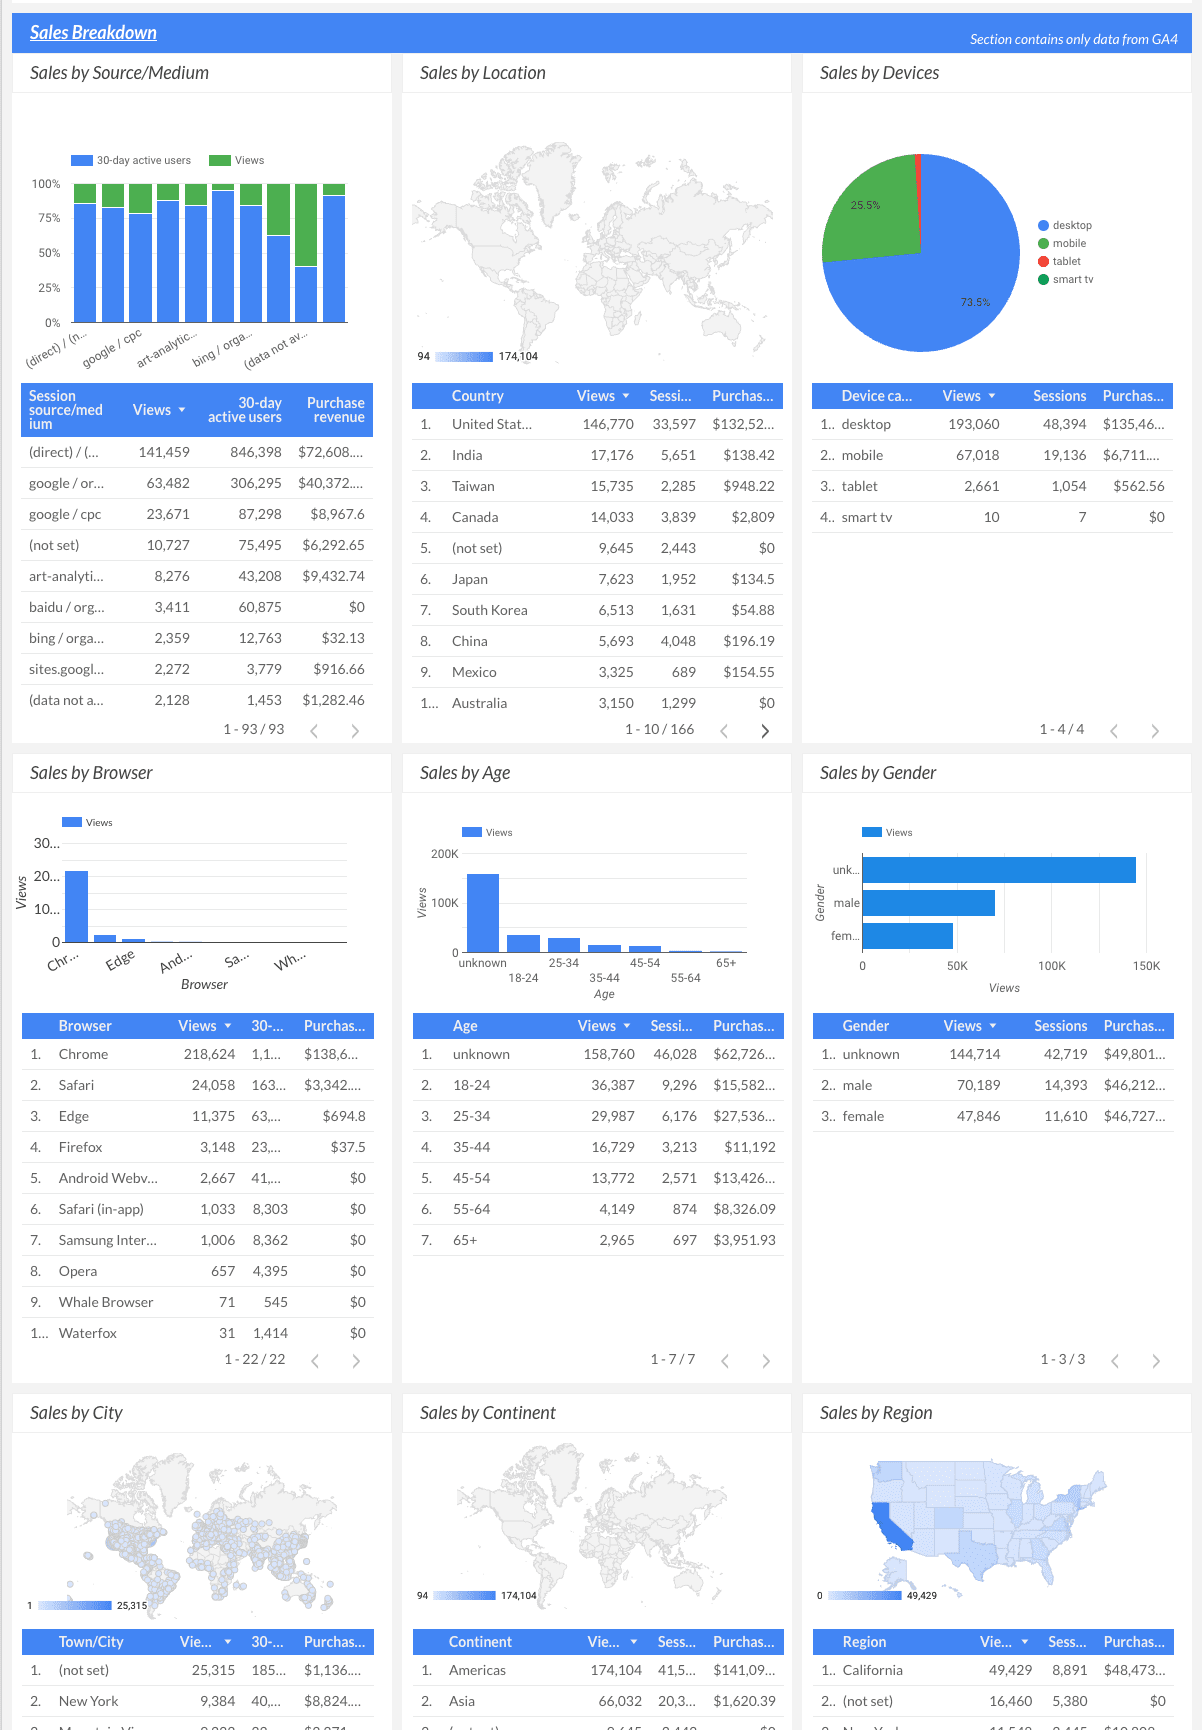
In the example below, you can see how GA4 e-commerce data from Google Analytics typically appears in Looker studio dashboards. This template combines Google Analytics 4 e-commerce data with SE Ranking’s data. It provides a comprehensive view of the online store’s performance, including key metrics like revenue, active users, search visibility and rankings, and more.
Also read: How to connect to Google Analytics 4
SE Ranking
SE Ranking is a powerful SEO toolkit that is frequently cited as one of the top SEO tools for agencies and in-house teams, based on a wide variety of criteria. The platform offers a comprehensive suite of SEO tools, including SEO Rank Tracker and AIO Tracker, in-depth Website Audit, Keyword and Competitor Research tools, a Backlink Checker, a dedicated Agency Pack, and more.
The SE Ranking Looker Studio connector brings in detailed data about your keyword rankings, competitor performance, backlink profile, and website SEO health to promote more in-depth SEO analysis and strategy planning.
Data provided:
- Keyword performance data: Number of keywords, average positions, and ranking changes, distribution across top positions (3, 10, 30, 100), search visibility and percentage in top 10, keyword metrics (search volume, competition, CPC), organic and paid rankings with dynamics, etc.
- Website health: Site Health Score, crawled pages, HTTP status code distribution, technical issues by severity and category, etc.
- Competitor insights: Traffic forecast for competitors, competitor rankings for tracked keywords, visibility and average position comparisons, etc.
- Backlink data: Backlinks with new, lost, referring domains, domain trust score, its dynamics with all backlink metrics, etc.
SE Ranking Looker Studio connector is available for Pro and higher pricing plans. The Pro plan starts at $119 per month.
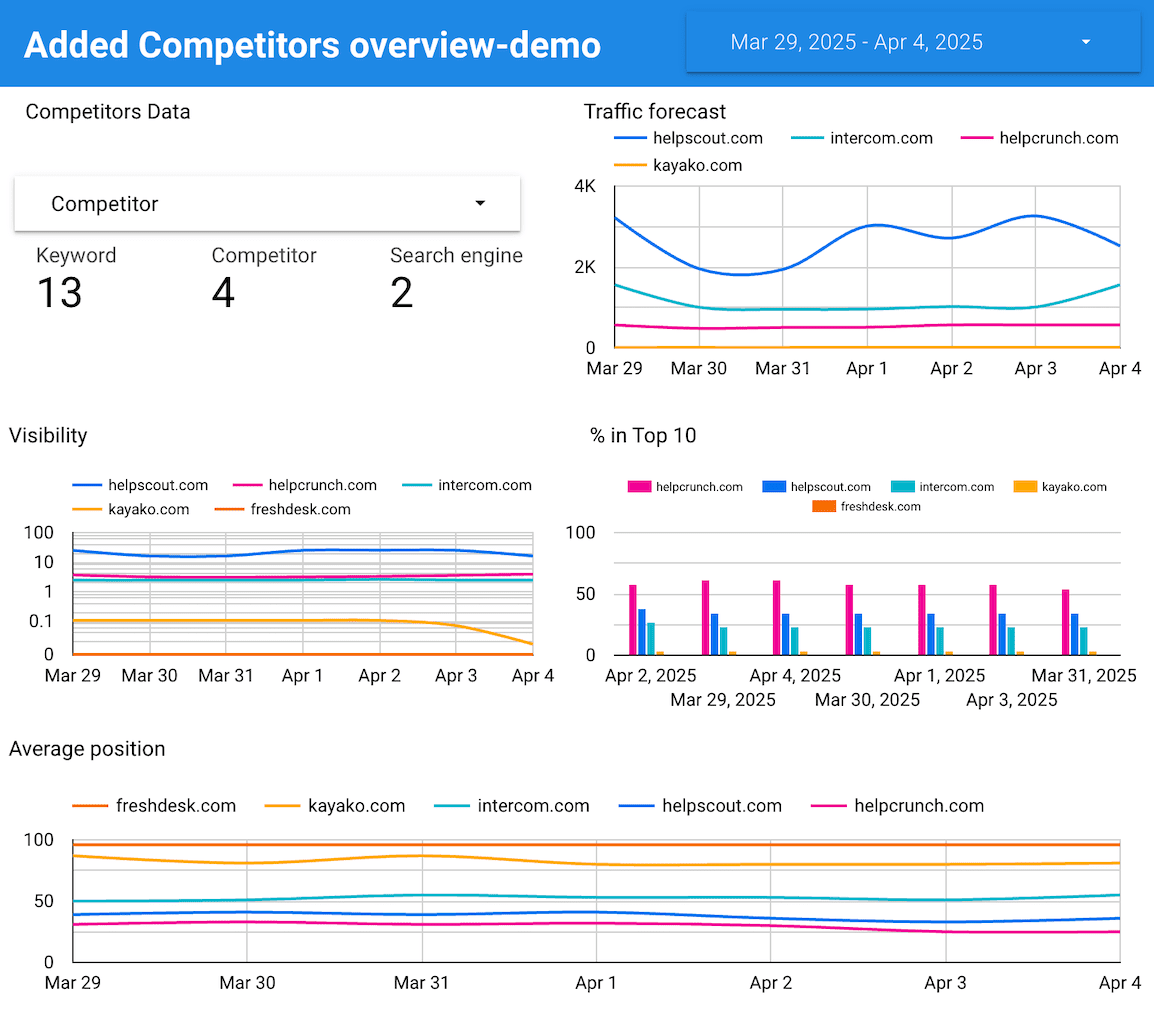
The example below shows how the Competitors Looker Studio template looks. The tool’s dashboard uses data from SE Ranking’s My Competitors feature. This helps SEO professionals quickly compare their site’s performance with their competitors’, identify market leaders, and spot opportunities for improvement.
Note that SEO pros have two main options for data visualization. They can use Looker Studio to handle data from different sources or use SE Ranking’s SEO Report Generator. This tool offers over 12 ready-made templates, making it easy to create and share client-friendly reports manually or set up automated client reporting using data directly from SE Ranking’s toolkit.
Also read: How to connect to SE Ranking
Google Sheets
Google Sheets is a free, web-based spreadsheet application and part of the Google Docs Editors suite. The Looker Studio Google Sheets connector allows you to visualize and analyze data stored in Google Sheets spreadsheets. This tool is useful for SEO professionals and digital marketers with custom datasets who want to blend each set with data from Google or third-party tools. For example, you can use Google Sheets to store custom data about your site’s URLs, including priority levels and recent page updates. You can then combine this information with click data from GSC.
Data provided:
- Any data stored in Google Sheets, e.g., website data, content calendars, KPIs or goals, etc.
- Manually collected or imported data
- Data from tools without direct Looker Studio connectors
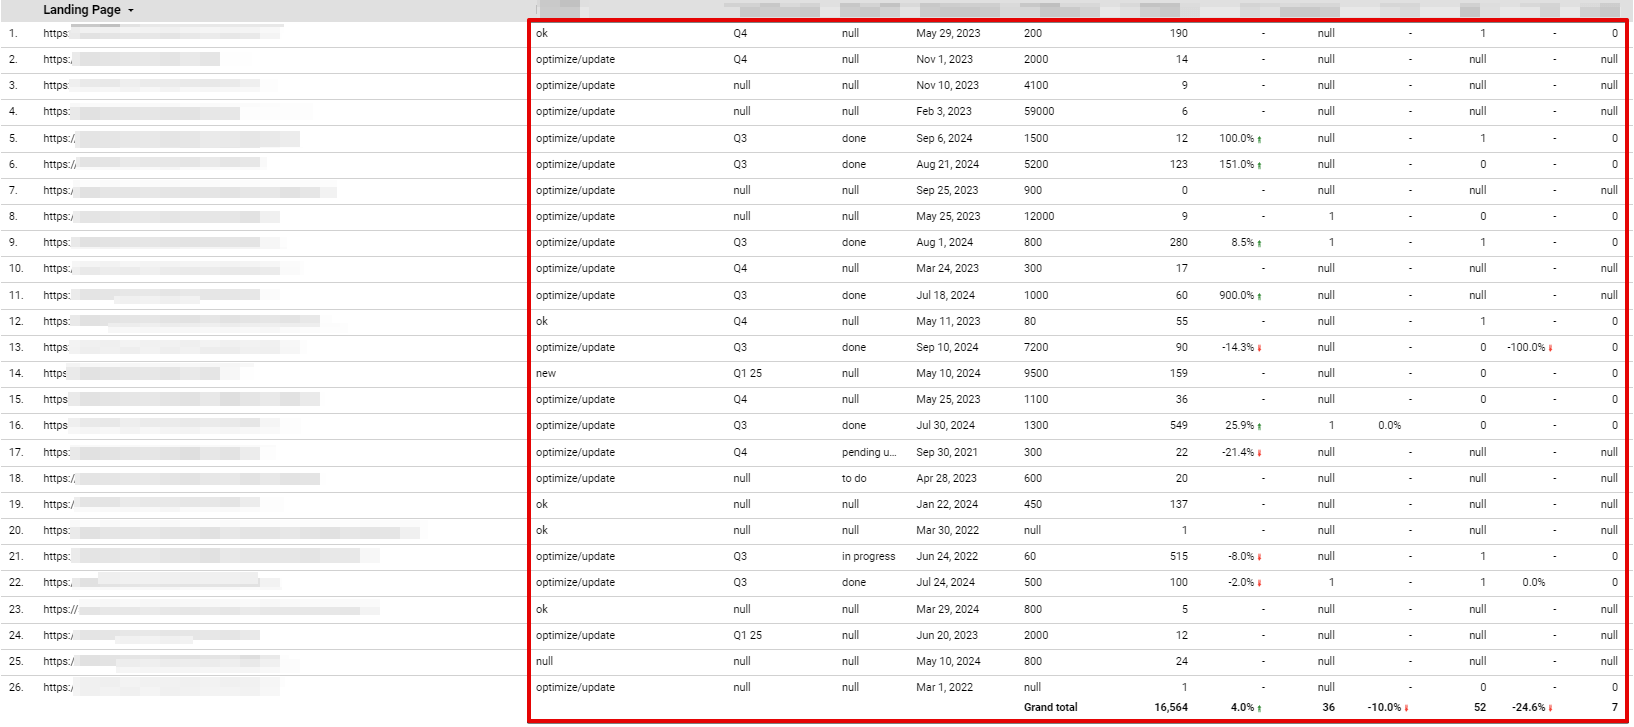
See in the example below how your custom marketing data (in our case blog performance data) from Google Sheets can appear from within Looker Studio.
Also read: How to connect to Google Sheets
How to use Looker Studio connectors
In SEO reporting, once you’ve decided on the key data points to report on for your clients, it’s time to set up your Looker Studio reports and dashboards. Here’s a step-by-step guide to get you started:
1. Log into your Google account and go to Looker Studio.
2. Click Create. You can either connect a new data source or create a new report to visualize your existing data.

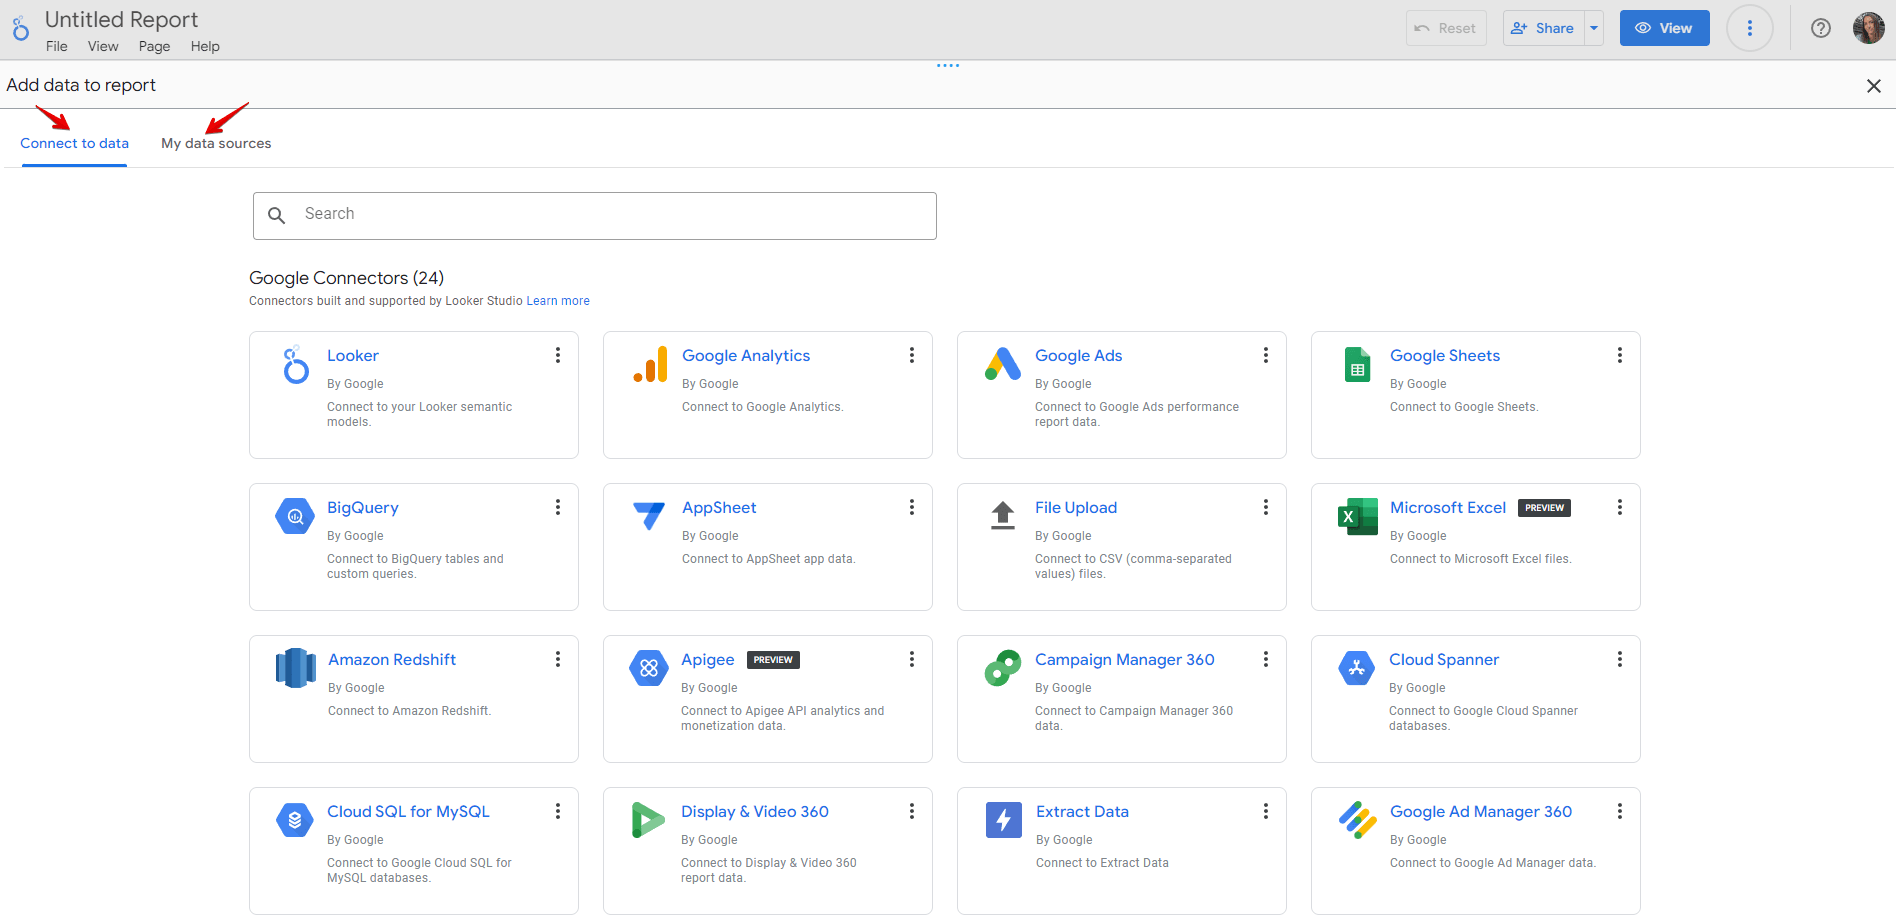
3. The tool will redirect you to the connectors gallery. You can either add the data you have already connected under My data sources or add it from scratch under Connect to data. Select the connector for the data you want to use (e.g., Google Analytics, Google Ads, Google Sheets, SE Ranking, etc.).
4. Follow the prompts to give Looker Studio access to your data. You may need to log in to your account for the specific data source.

5. The next steps in configuration may vary based on the chosen connector. See the resources we’ve added for four of them in the previous section.
Either way, once you’ve configured your data sources and selected relevant metrics and dimensions, you can start building your reports from scratch or choose any Looker Studio SEO template of your choice.
6. Make sure to configure your Looker Studio connectors by:
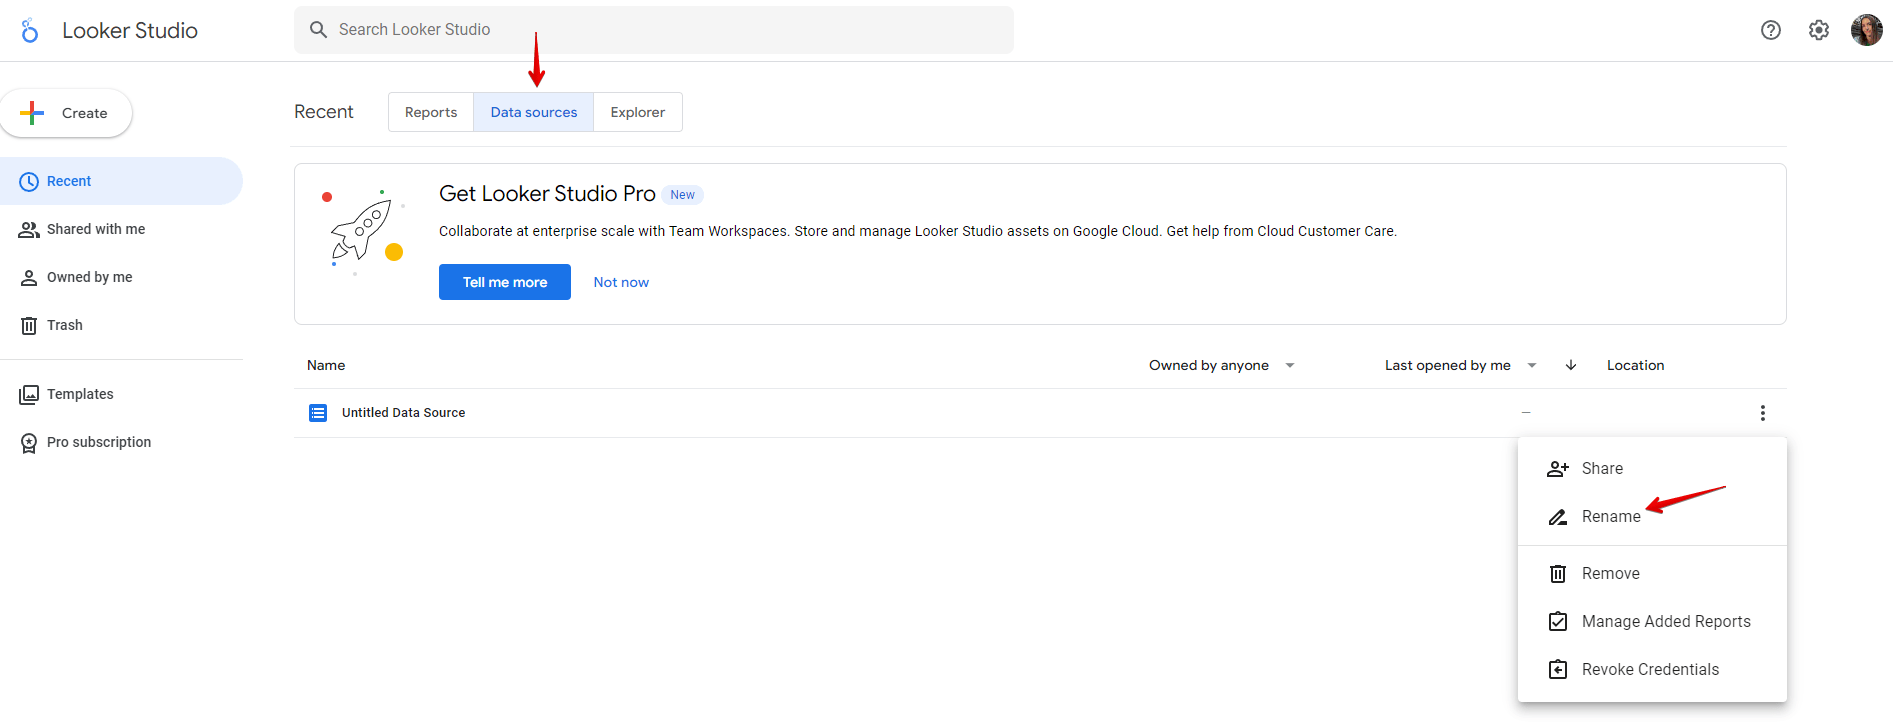
- Changing connectors name: Click on the Data sources, then three dots and select Rename to modify the name field.
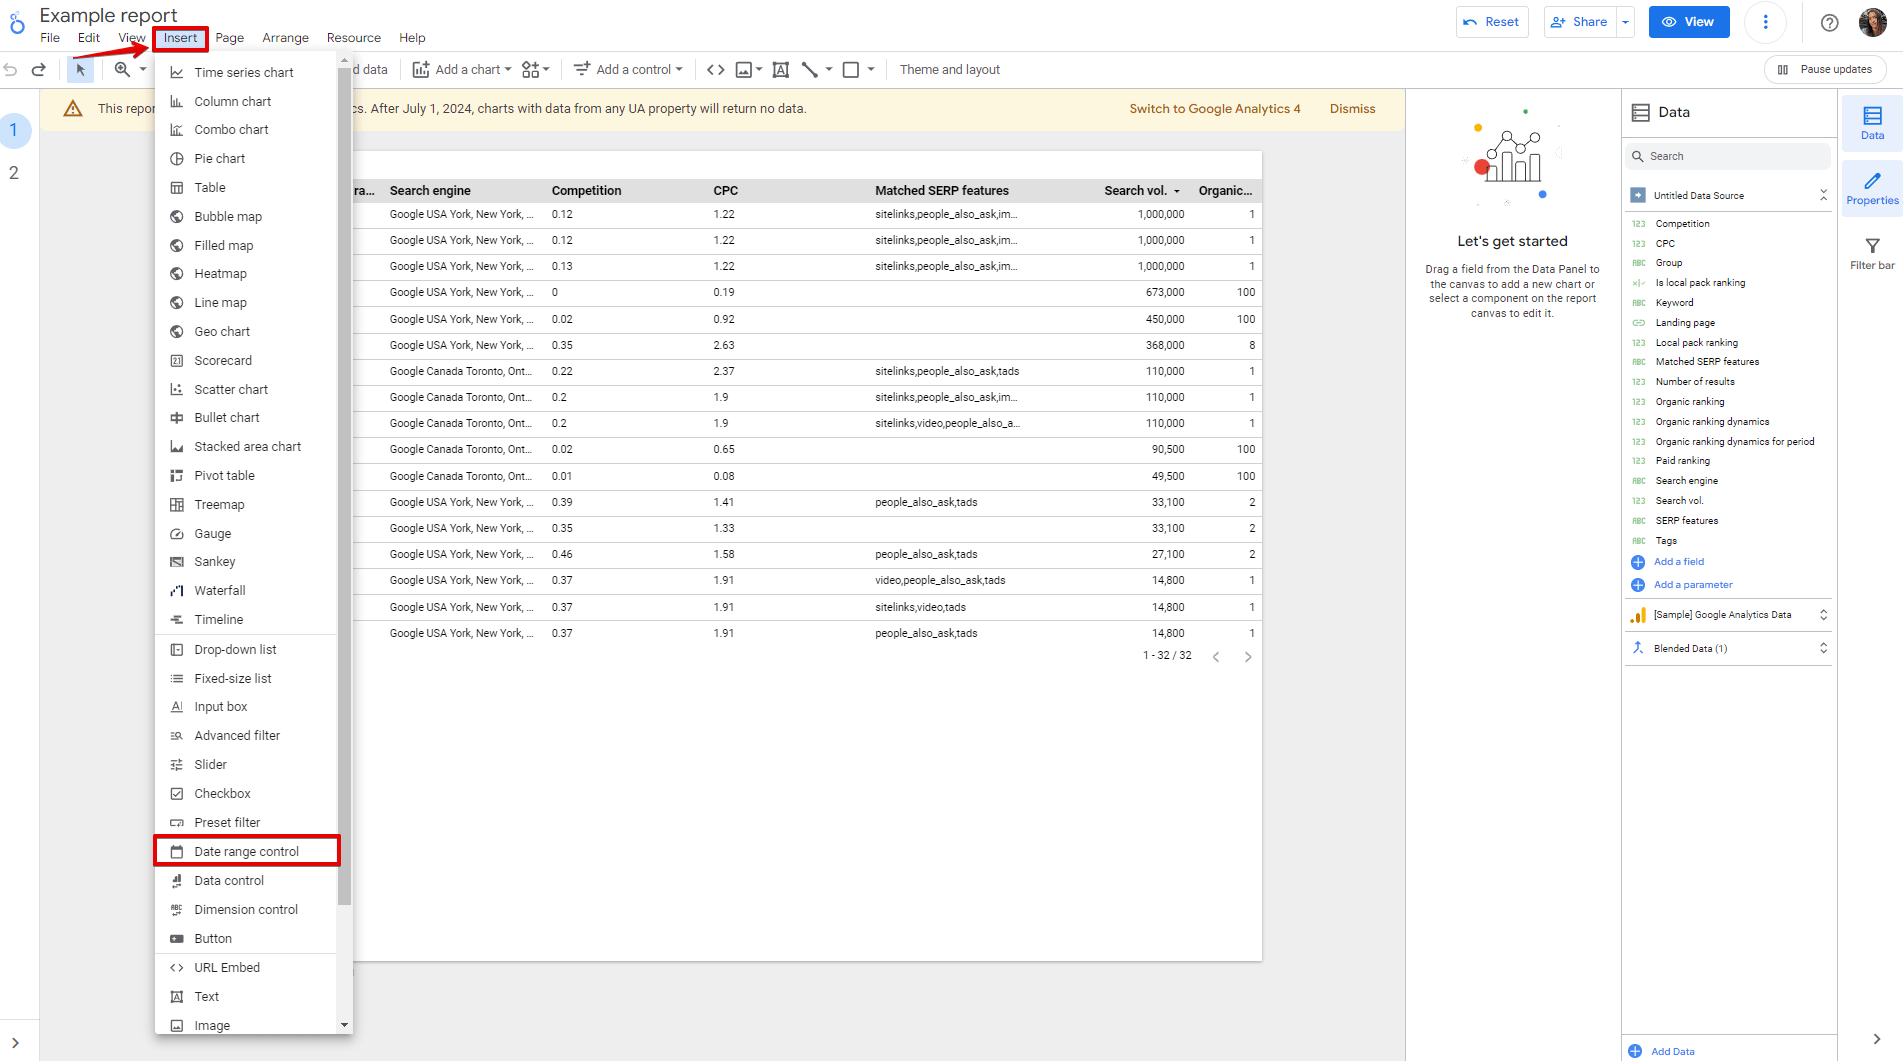
- Setting appropriate date ranges: To add a flexible date range control, go to the Insert tab on the top panel, select Date range control, and place it on your report.
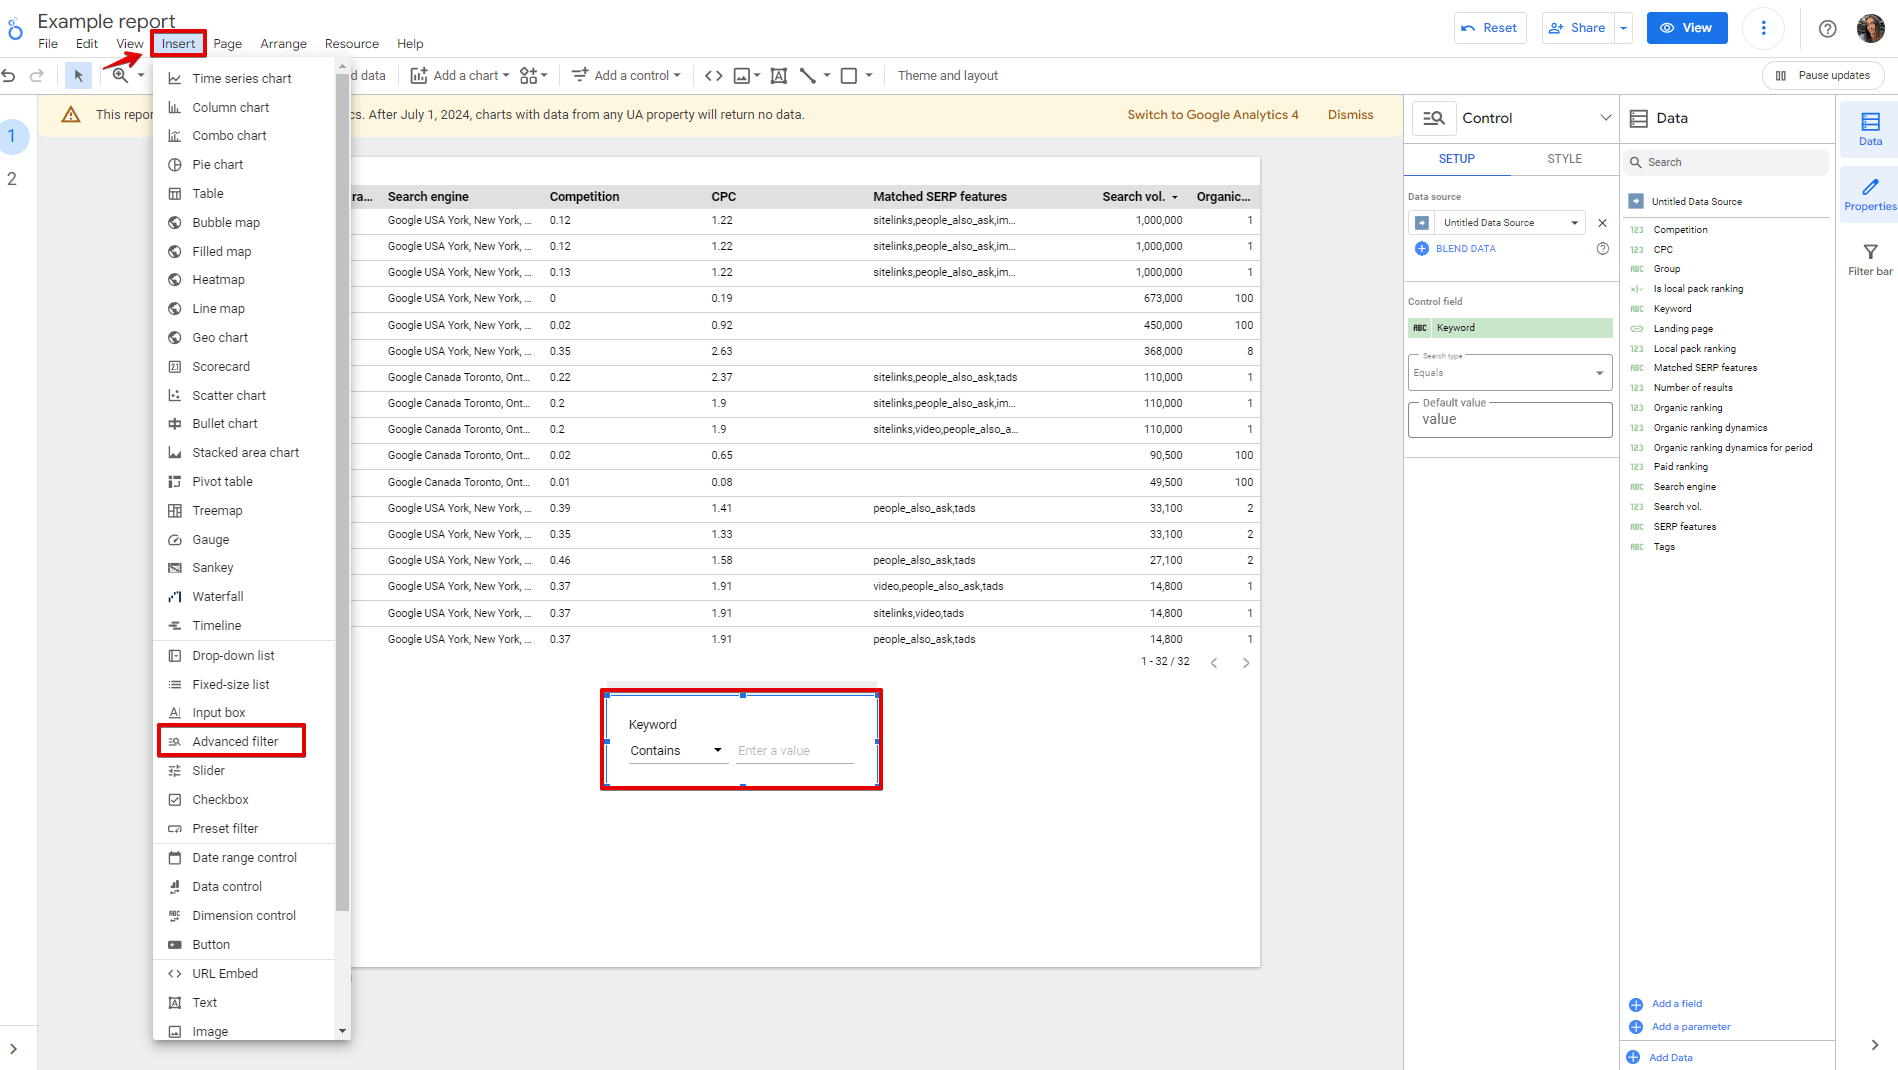
- Applying essential data filters: Go to the Insert tab, select Advanced filter, and set the comparison operator and value. This will allow anyone from your team who is using this dashboard to filter data when needed.
- Scheduling regular data refreshes: The auto refresh feature is available to Looker Studio Pro users. In the Resource menu, click Manage auto refresh settings, enable Automatically refresh report data, select your desired refresh interval (ranging from every 5 minutes to once a day), and click Save.
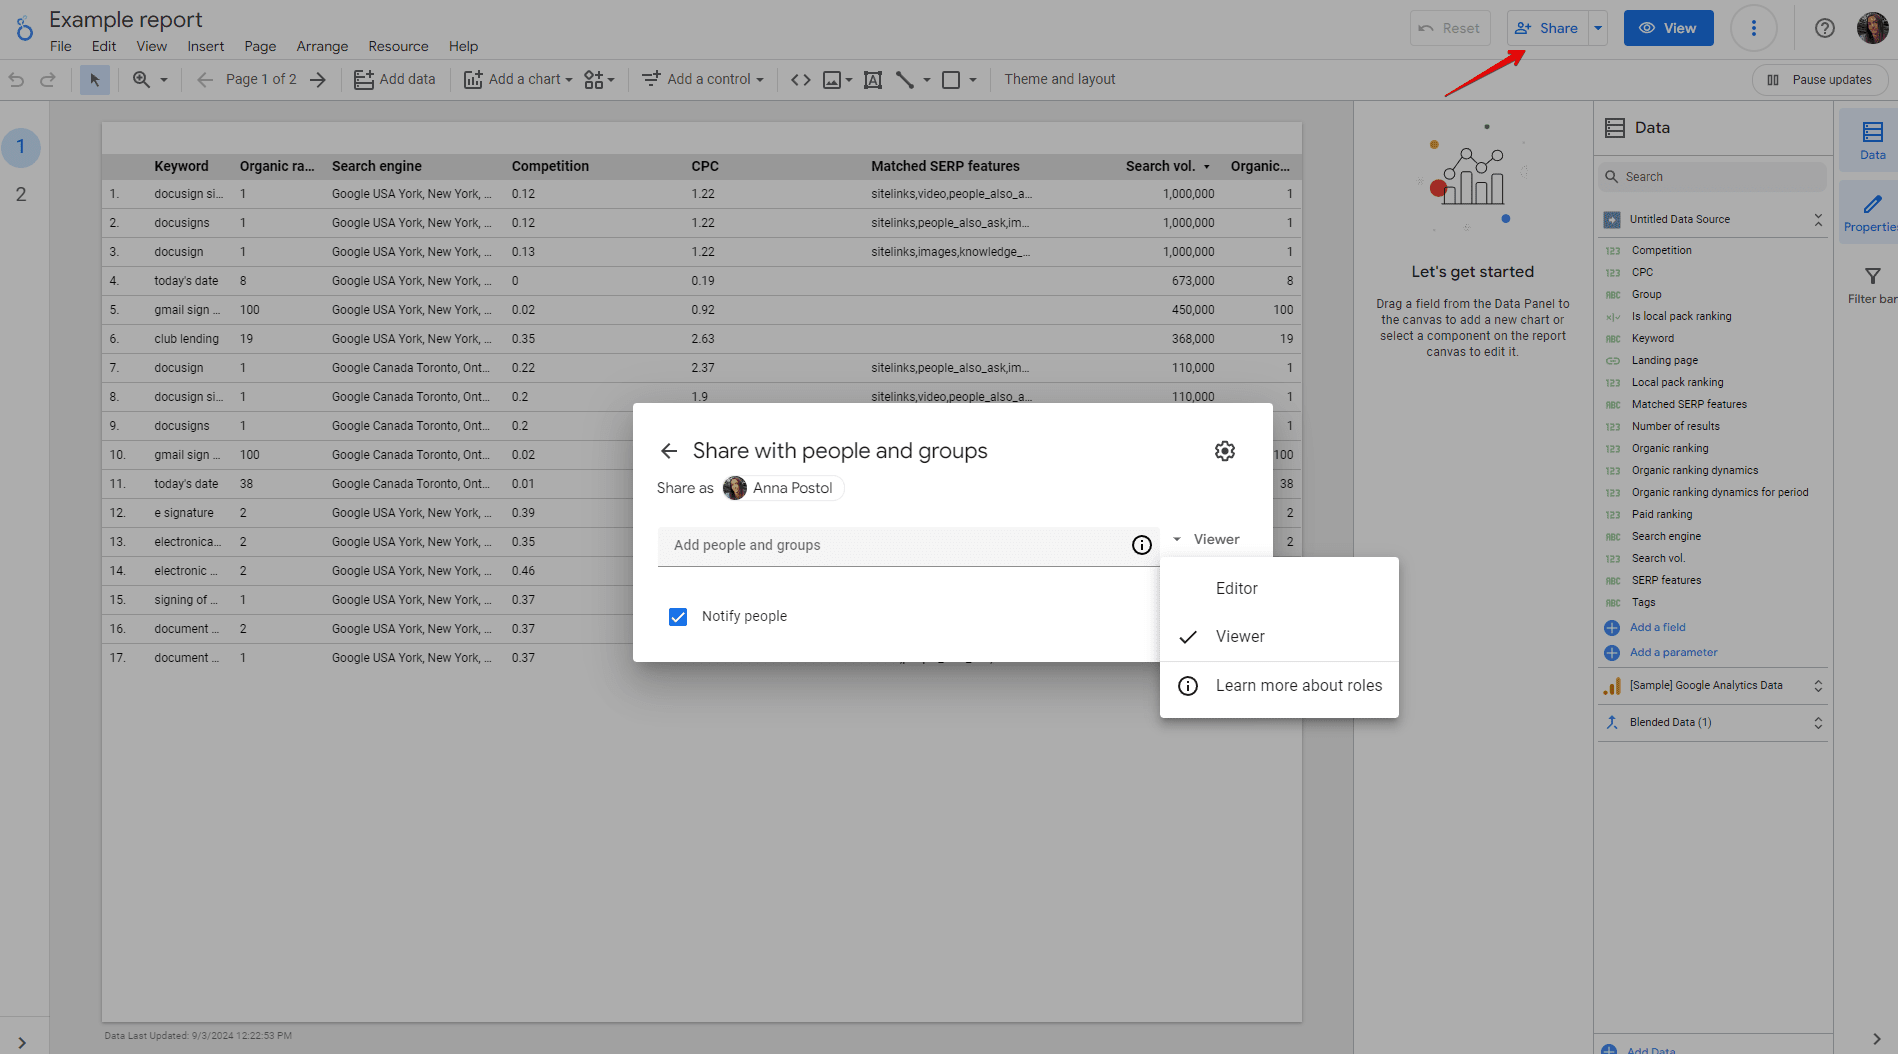
- Managing access permissions: Use the Share button to control who can view or edit your reports and data sources. Read more info about roles and permissions.
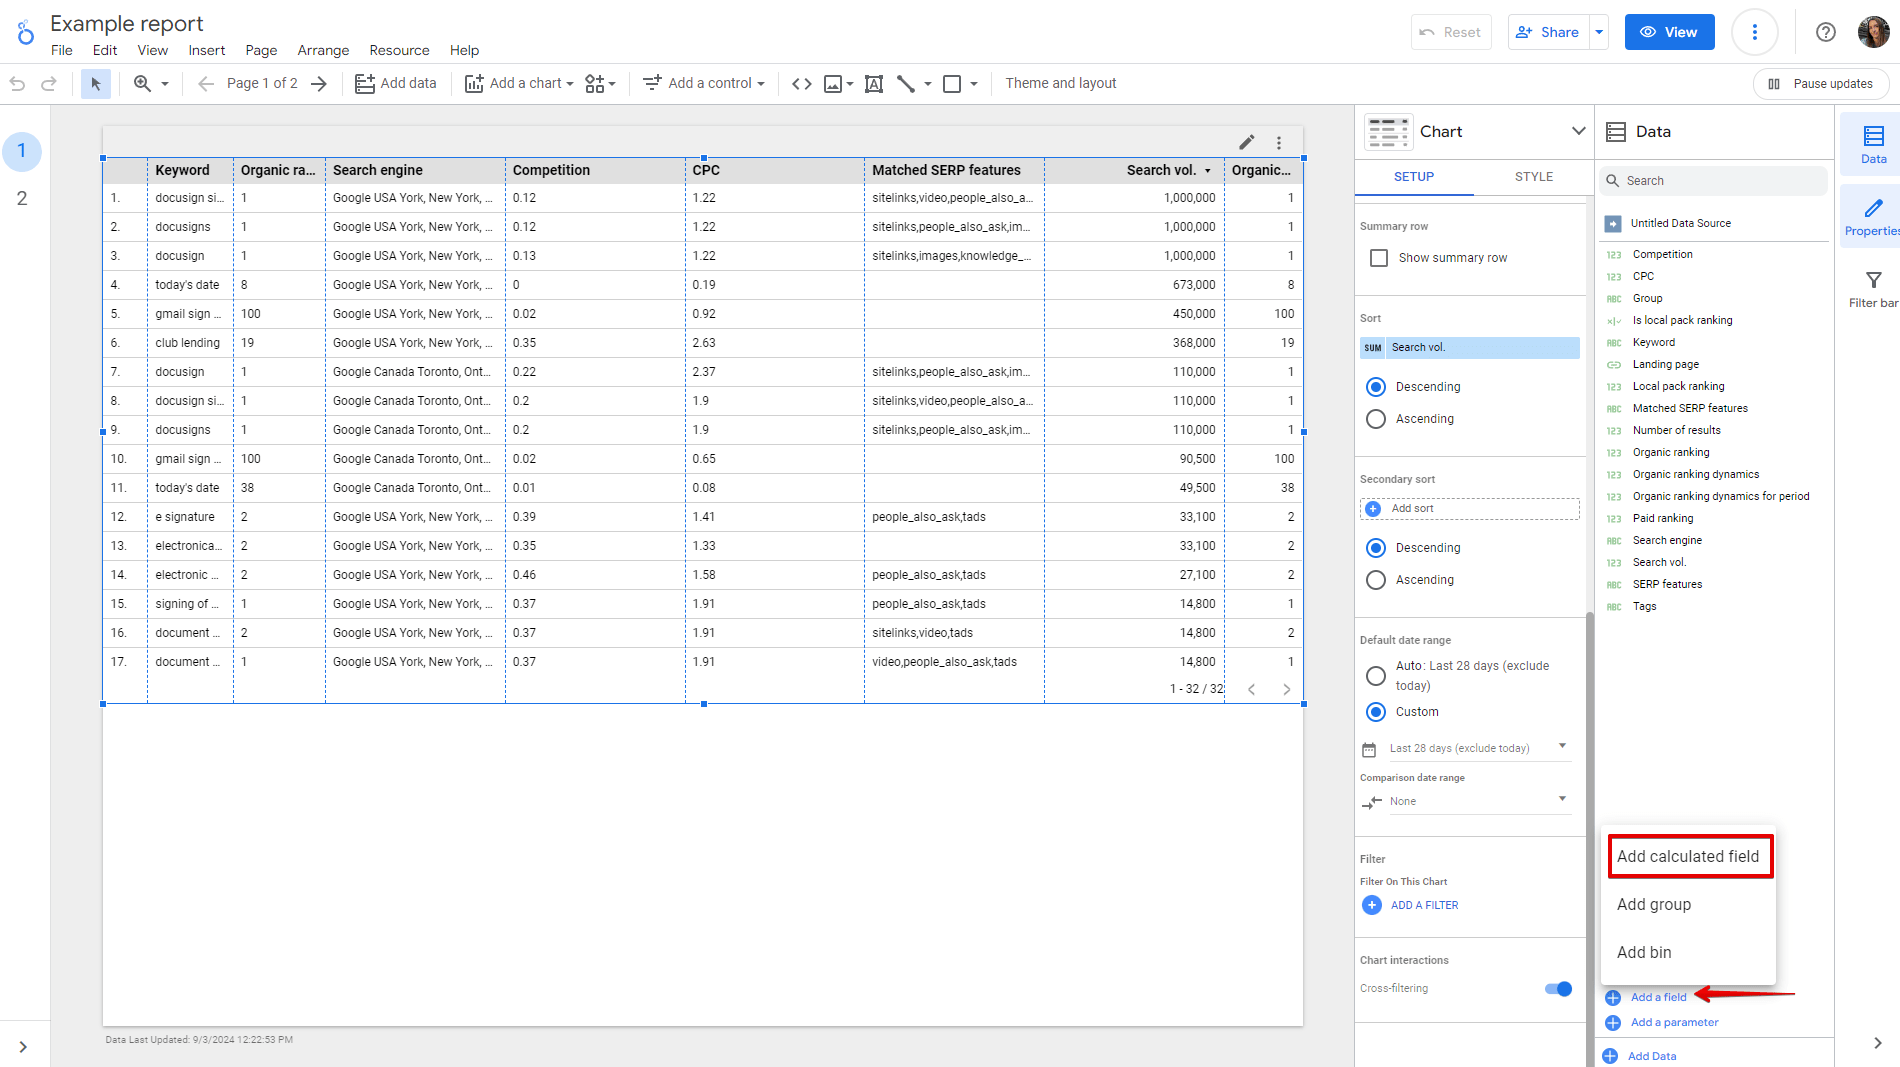
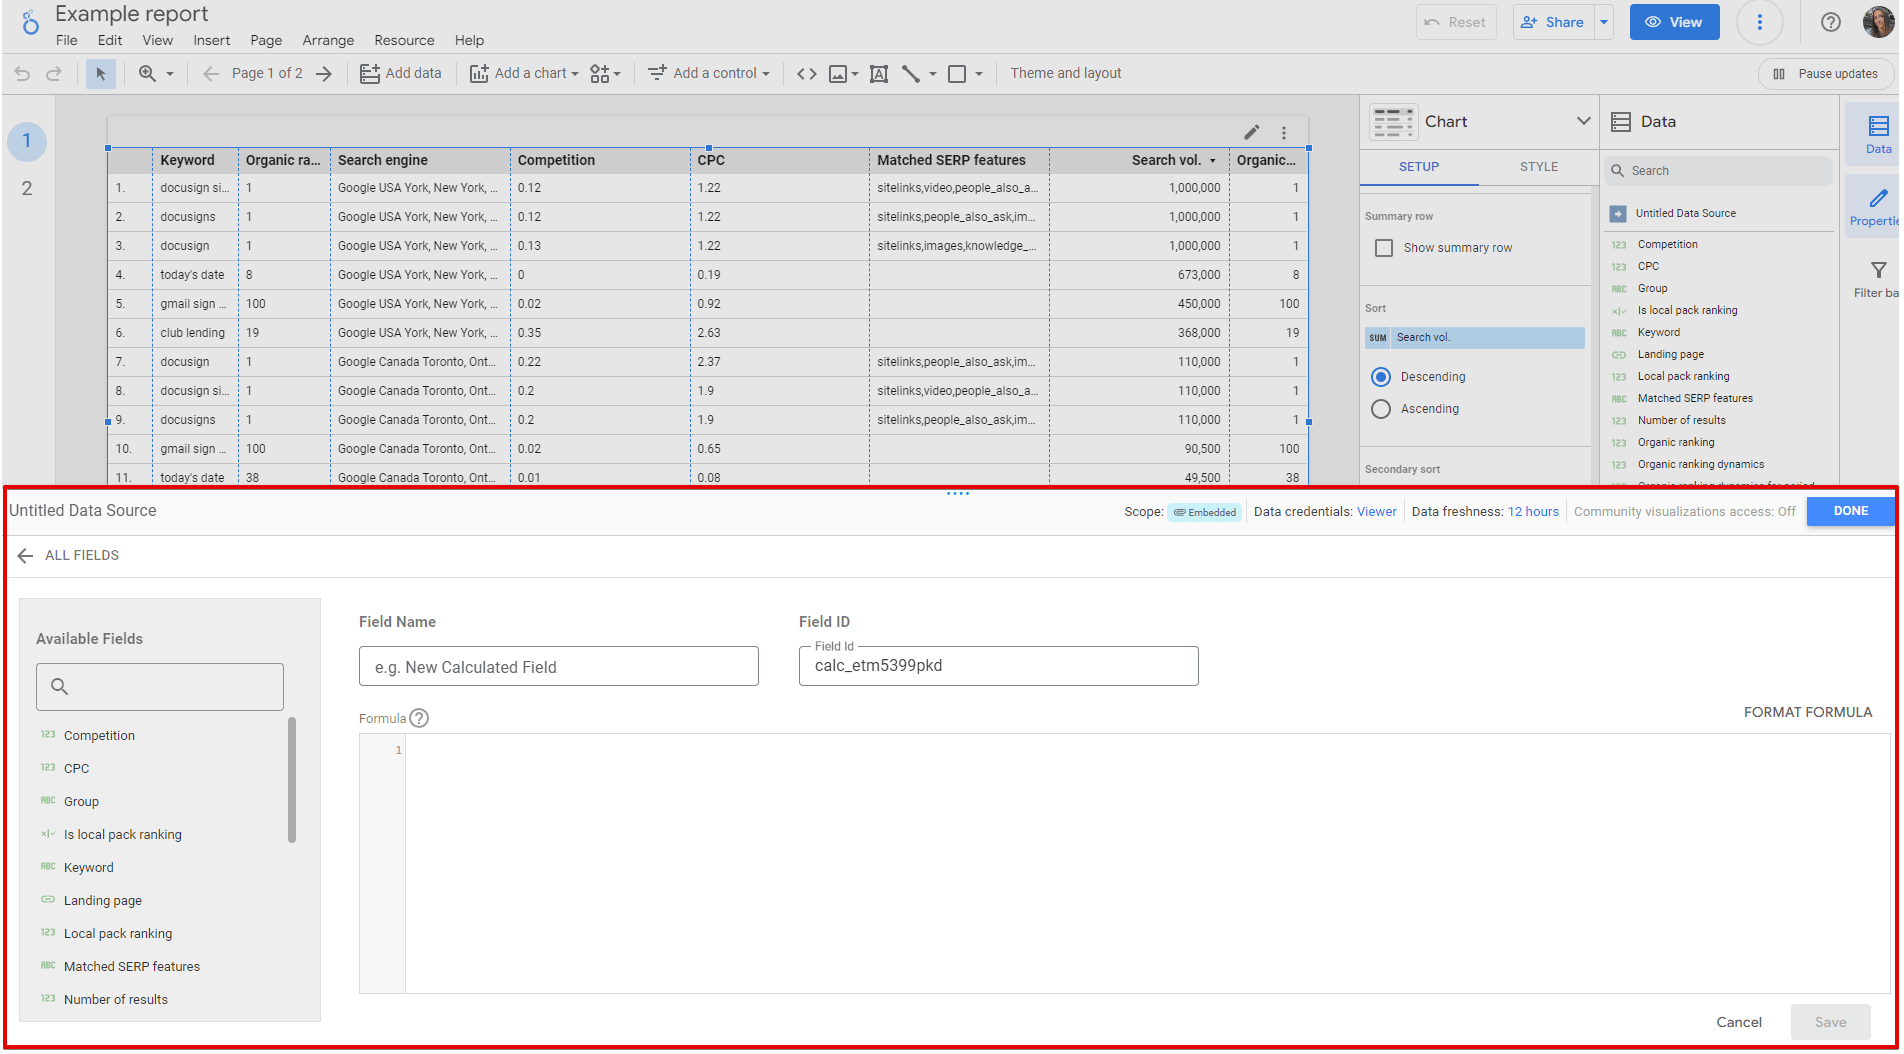
- Creating custom formulas: Click Add a field, select Add calculated field, enter a unique name, input your formula using available fields and functions, then click Save or Update.
Now, let’s say you’ve created your first dashboard or report using data from some of the Looker Studio connectors. The next task is to report on your data points to clients or colleagues. For this, there’s a data storytelling technique you should know about and learn, as it helps you communicate complex SEO insights and metrics more clearly and drives action.
Conclusion
Looker Studio integrations offer a wealth of data to create custom dashboards, visualize advanced SEO and marketing data, and produce tailored client reports. It’s easy to use, and you can quickly customize reports on the fly, which is always a win when you’re juggling multiple clients or campaigns.
With data from the SE Ranking connector, you get the breadth and depth required to drive successful SEO campaigns and track their progress over time. Let’s wrap up here and recommend starting your free 14-day trial to discover the benefits it can bring to your SEO efforts.

