How to use Google Analytics 4 for SEO: Organic, AI traffic, and more
Google Analytics 4 helps you understand your overall SEO performance: it shows how much traffic comes from organic search, which pages drive results, how those visitors behave, and how search compares with other channels sending users to your site.
In 2026, that last point matters more than it did a year ago. Our research shows that traditional organic search still accounts for 42.75% of all website traffic, but AI traffic keeps growing fast (up 16x from 2024 to 2026). And visitors referred by AI engines spend 68% more time on site than those from traditional search. So, the sessions that reach your site are often more intentional.
That doesn’t make organic search less important, but it does make GA4 more important for understanding where visitors come from, how those sources differ, and what users do once they arrive.
This guide walks through the GA4 reports and settings SEOs use most often, from organic traffic and landing pages to conversions, user journeys, and AI-referred visits.
-
GA4 shows what organic visitors do after they reach your site. You can analyze which landing pages attract traffic, how users engage across devices and locations, and whether those visits lead to conversions.
-
GA4 also helps you separate traditional organic traffic from AI-referred traffic. This makes it easier to compare visits from Google with traffic from AI assistants like ChatGPT, Perplexity, Claude, and Gemini.
-
For stronger SEO analysis, GA4 works best when connected with Google Search Console and SE Ranking. GSC adds search query data, while SE Ranking adds rankings, technical health, backlinks, competitor insights, and AI visibility.
-
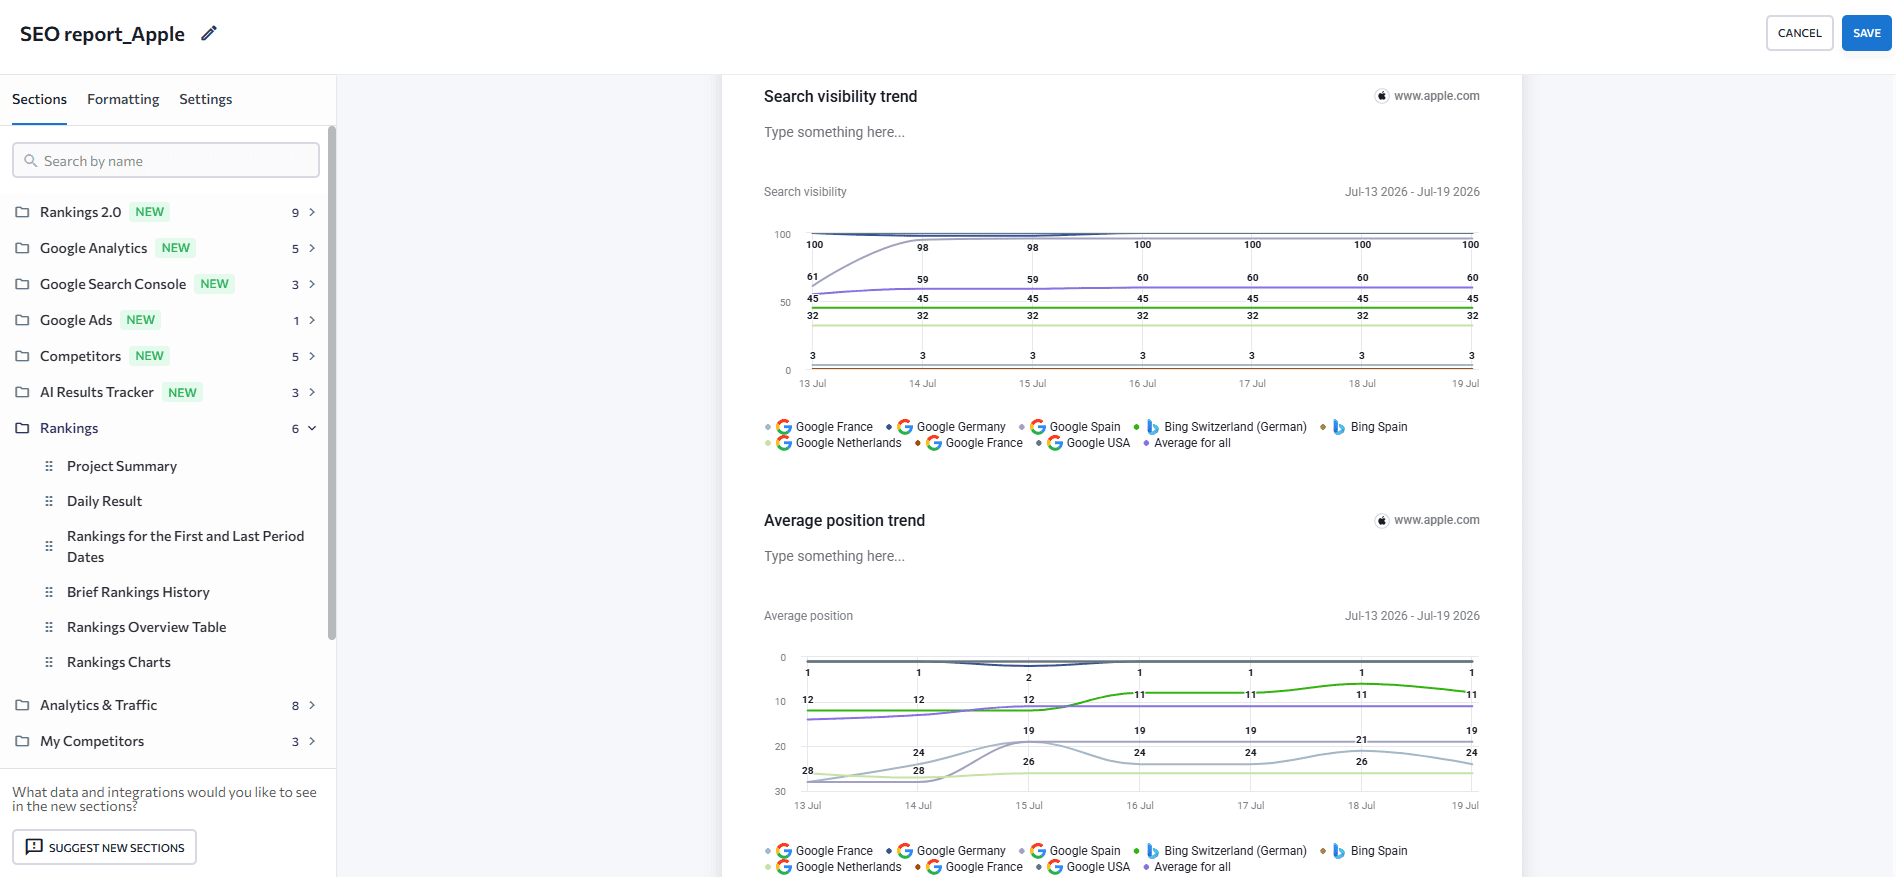
Google Data Studio helps you turn this combined data into custom SEO dashboards. It’s useful when you need to visualize trends, compare performance across sources, and share clear updates with clients or internal teams.
-
SE Ranking’s API, MCP connector, and Claude skills are useful when you need more than dashboards. They help teams automate data pulls, build custom workflows, query live SEO data inside AI assistants, and repeat common SEO or GEO analyses without rebuilding prompts from scratch.
How to get SEO insights from Google Analytics
The questions below are the ones SEO teams return to most often: what’s working, what’s declining, what’s converting, and what the data doesn’t explain on its own. Each section points to the specific report or setting in GA4 that answers it.
But if you haven’t set up Google Analytics yet, start with our step-by-step Google Analytics setup guide. If you’re managing multiple domains, GA4 cross-domain tracking explains how to handle users moving between sites.
1. How much organic traffic are you getting, and is the volume growing?
Organic search remains a primary acquisition channel for most sites, though interpreting session volume in 2026 requires more context than it used to. A decline in organic sessions doesn’t automatically signal an SEO problem — it may reflect the shift toward zero-click behavior on informational queries, especially those now answered by AI Overviews. Understanding the trend alongside what’s happening in search is the starting point.
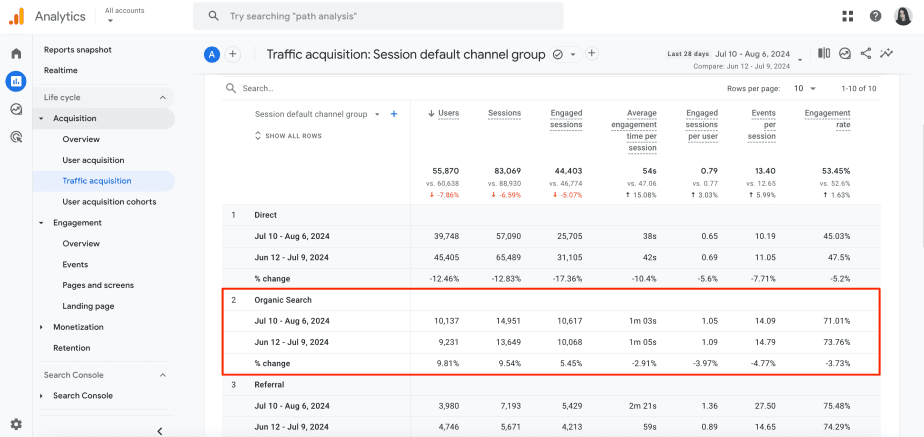
To see organic traffic data in GA4, go to Reports > Acquisition > Traffic acquisition: Session default channel group. The table breaks out organic search alongside direct, referral, paid, and other channels, and lets you compare date ranges to track growth or decline.
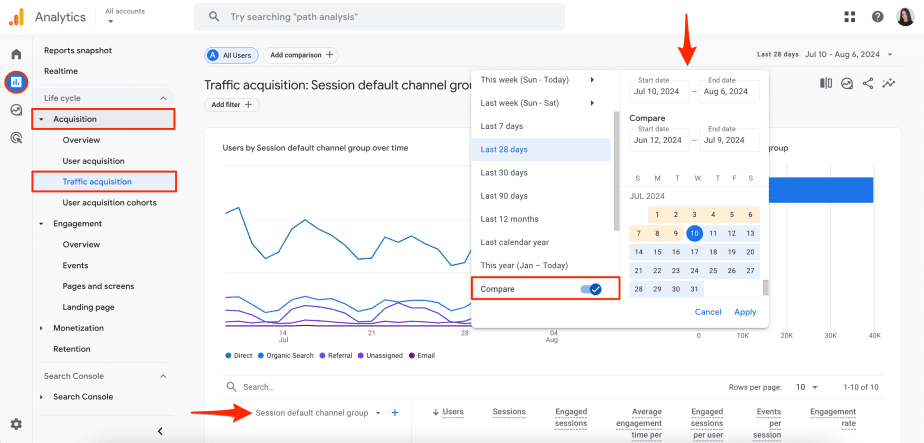
Switching the time comparison view makes it straightforward to check whether the trend is seasonal or structural. A drop that tracks with a broad core update is a different problem than a steady month-over-month decline that predates it.
2. How much traffic do different search engines bring?
If your site targets multiple markets, knowing which search engines drive meaningful traffic has always been part of the picture — particularly for sites with audiences in regions where Bing, Baidu, or other alternatives hold significant share.
In the same Traffic Acquisition report, switch the primary dimension to Session source / medium and type organic in the search bar at the top left of the table to filter by medium. The table then shows traffic volume, sessions, and conversions by source, so you can compare Google, Bing, Yahoo, and other search engines directly.
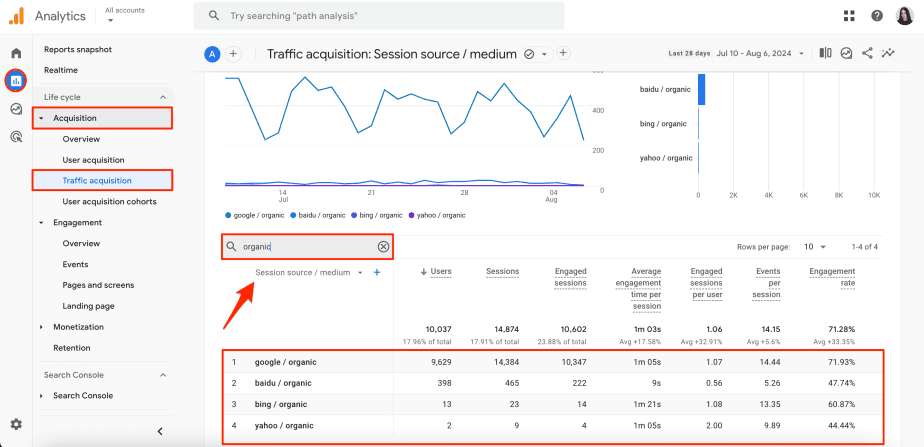
One channel that doesn’t appear here (but matters increasingly) is AI assistants. ChatGPT, Perplexity, Claude, and Gemini send referral visits that GA4 now tracks in a separate dedicated channel. See the next section for how to find and interpret that data.
3. How to track traffic from AI search engines (ChatGPT, Perplexity, Claude, Gemini)
As of May 2026, Google Analytics 4 automatically categorizes visits from AI assistants into a dedicated AI Assistant channel within the Default Channel Group reports. Sessions from ChatGPT, Perplexity, Claude, and Gemini are tagged with ai-assistant as the medium and (ai-assistant) as the campaign name, placing them in their own row in the Traffic Acquisition report (directly comparable to organic search, referral, or direct).
To see how much traffic your site receives from AI assistants:
- Go to Reports > Acquisition > Traffic Acquisition.
- Select Session default channel group as the primary dimension.
- Type
ai-assistantin the search bar at the top left of the table.
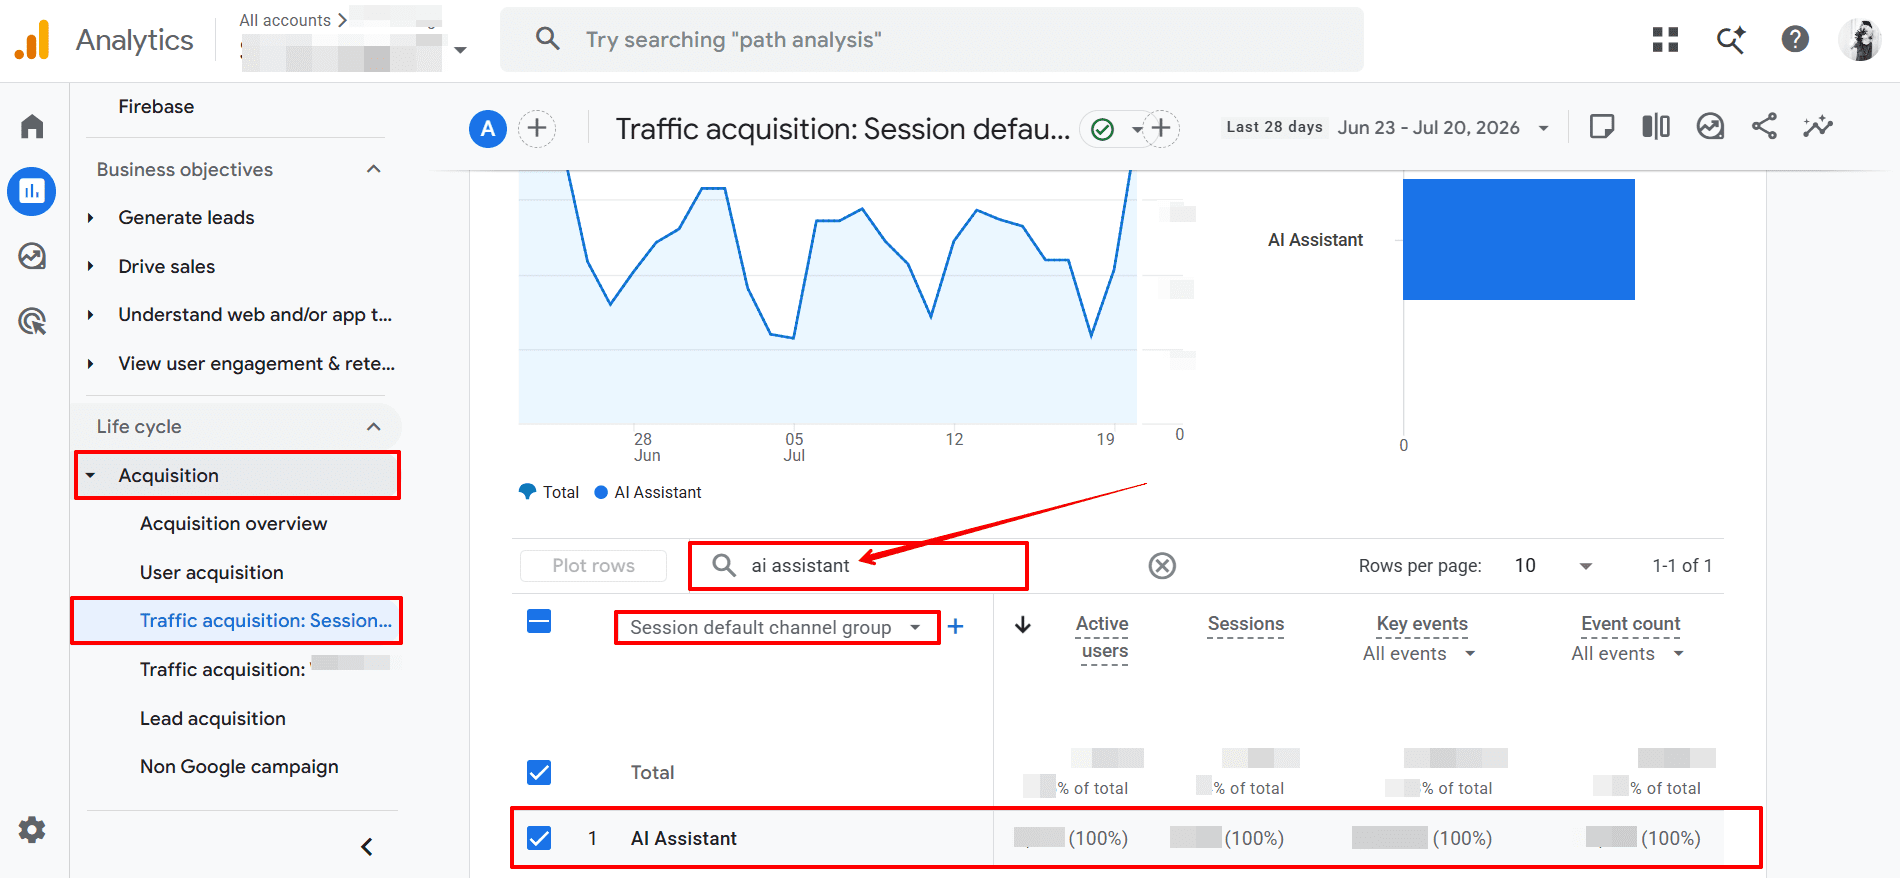
Why this matters for interpreting your organic data: when organic sessions appear to be declining on informational content, checking AI Assistant traffic can reveal whether part of that audience has simply shifted channel — arriving from an AI conversation rather than a direct search. Tracking both in parallel gives you a more accurate picture of actual demand than organic sessions alone.
One important caveat: the AI Assistant channel captures visits only when AI platforms include a referrer in their HTTP headers. Some AI-generated answers (particularly in closed chat contexts) strip that referrer data entirely, which means the channel likely undercounts actual AI-sourced visits. Watching branded direct traffic alongside AI Assistant numbers helps account for the gap.
4. How to see which queries bring in organic traffic?
GA4 doesn’t show organic keywords by default. This is a deliberate privacy decision.
To see the search queries driving traffic and conversions, you need to connect your Google Search Console account to GA4.
To set up the integration:
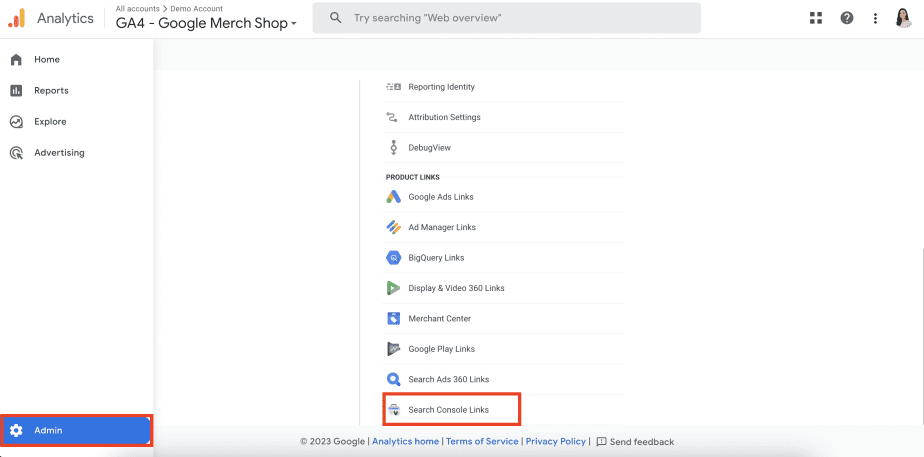
- Go to Admin > Product Links > Search Console Links in the left panel.
- Click Link, select the account you want to connect, and follow the prompts to choose your site’s web data stream.
Once linked, two new reports appear in GA4:
- Queries — search queries with GSC metrics (clicks, impressions, CTR, position).
- Google Organic Search Traffic — landing pages with GSC metrics.
These reports don’t appear by default in the GA4 menu. To add them, go to Library and publish the GSC collection. After that, you’ll find the Search Console tab under Reports.
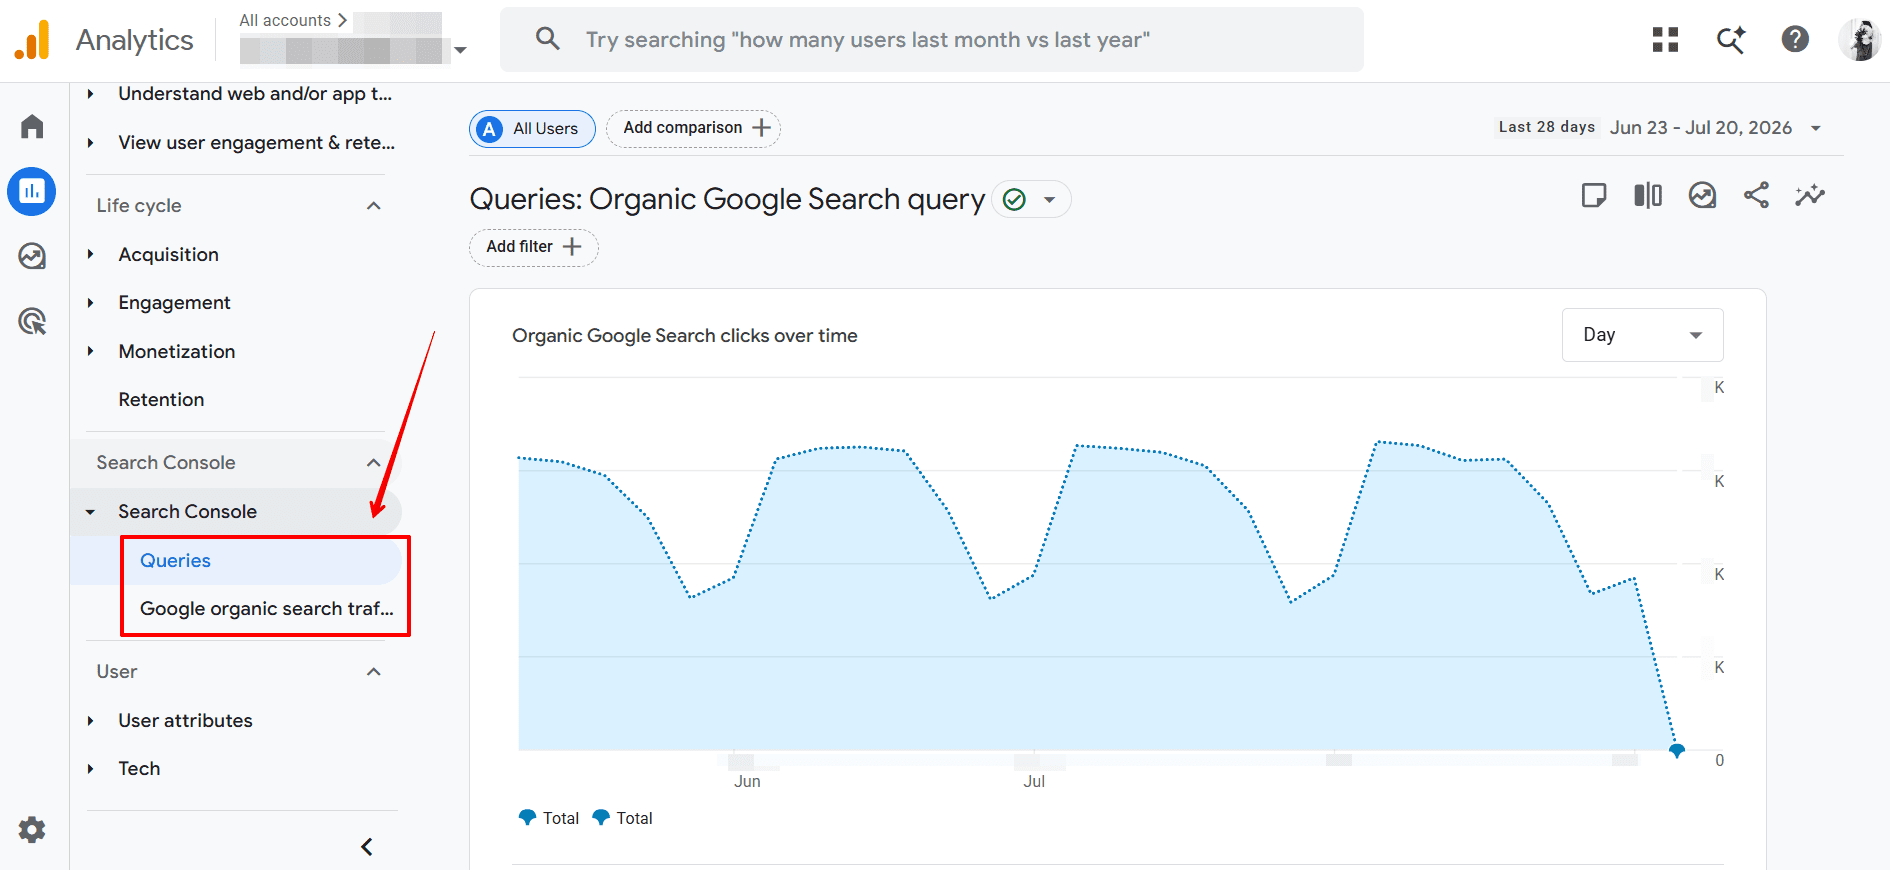
To see which queries drive the highest organic traffic volume, check the Queries report and the Organic Google search clicks by Organic Google search query chart, which shows your top five terms. For tracking position movements over time and comparing against competitors, the SE Ranking rank tracker gives you a more complete view than GSC alone.
Note that GSC reports in GA4 work with a limited set of GA4 dimensions (Landing page, Device, Country), and data becomes available 48 hours after collection. Search Console stores up to 16 months of data.
5. How to see organic landing pages?
Two methods work here, depending on how you want to structure the report.
Method 1: Customized report
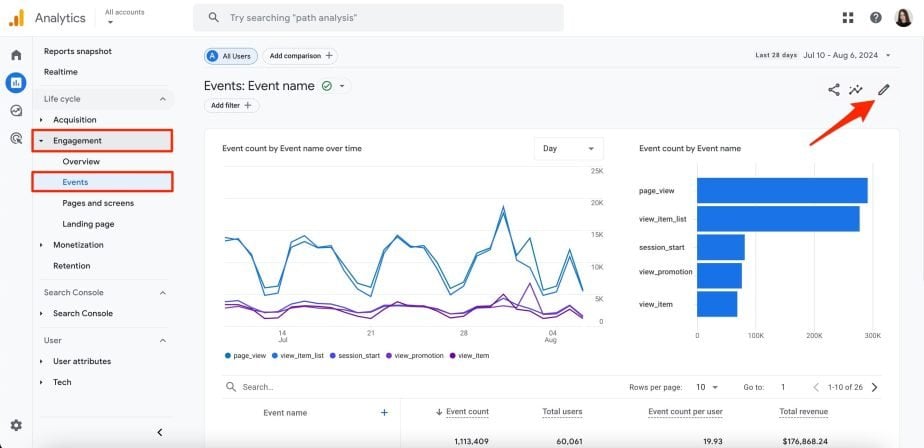
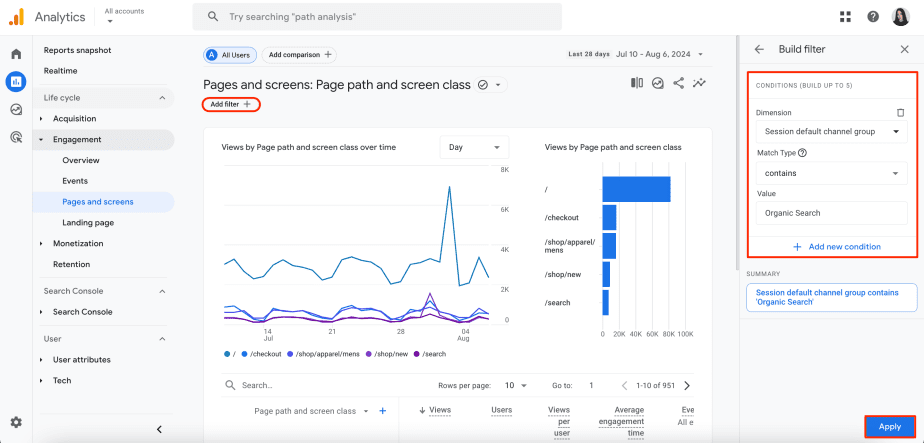
Navigate to Reports > Engagement > Pages & Screens. Click the pencil icon in the top right to customize the report.
In Dimensions, add Landing Page + Query String; in Metrics, add sessions, bounce rate, and conversions.
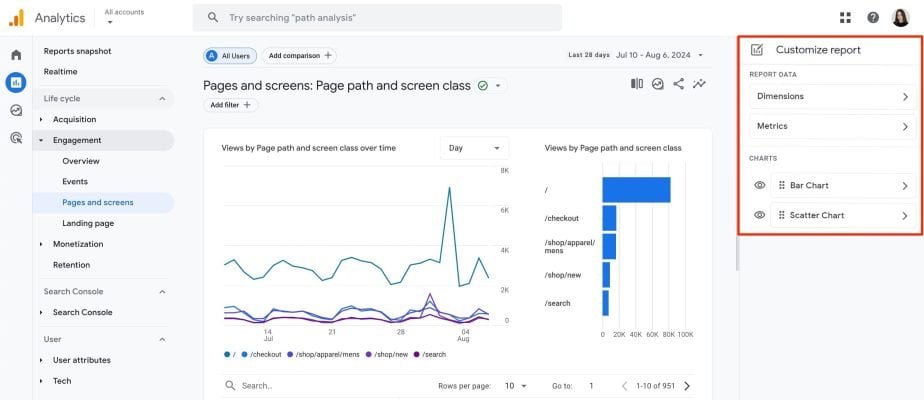
Apply a filter using Session Default Channel Grouping and select Organic Search.
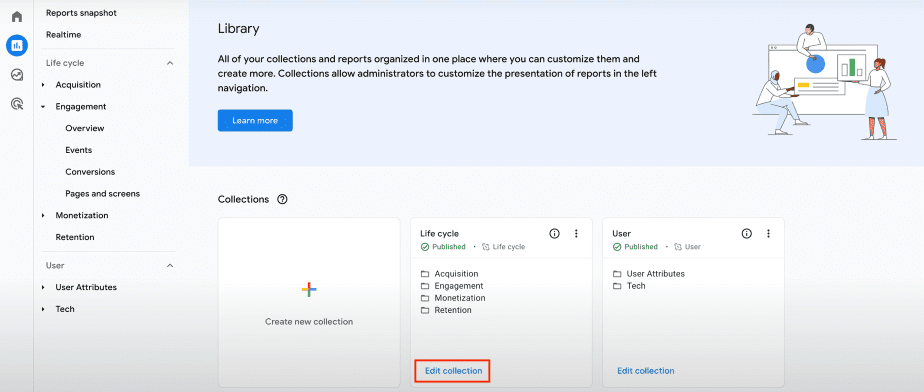
Save this as a new report (e.g., “Landing Pages”) and add it to the relevant collection via Library > Edit Collection.
Method 2: Direct filter
Open the Landing Page tab in Google Analytics and apply a filter where Session medium exactly matches Organic.
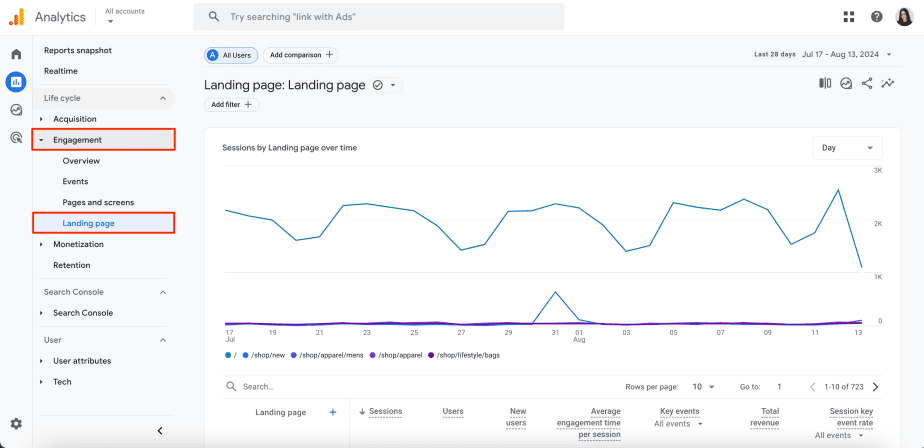
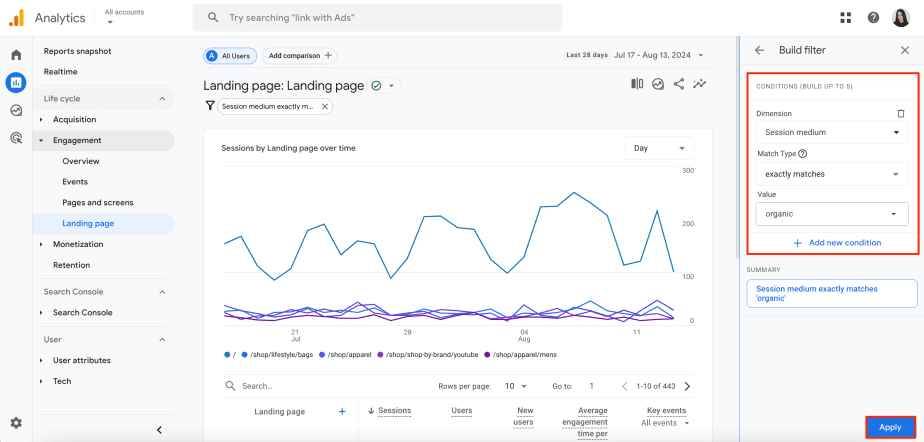
Either approach surfaces the pages attracting organic visitors. The more useful analysis is then pairing this data with conversion rates — pages with high organic traffic and low conversion rates warrant a different kind of attention than pages that convert well but attract too little traffic to make a meaningful contribution.
6. How to check traffic by channels?
GA4 uses default channel groups — predefined traffic sources — to classify visits. The default group includes 18 sources across user, session, and event scope dimensions.
To view traffic by channel, go to Traffic Acquisition under the Acquisition tab and select Session default channel group as the primary dimension.
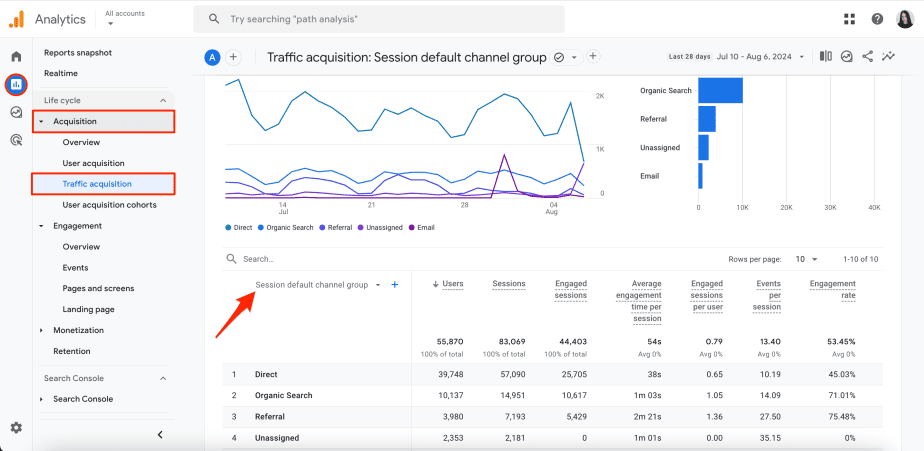
A useful addition here is the Custom channel group feature (Admin > Data display > Channel groups), which lets you define your own traffic categories. Custom channel groups can also be applied as secondary dimensions across other reports that support channel grouping, making it easier to segment data in ways that match your specific reporting needs.
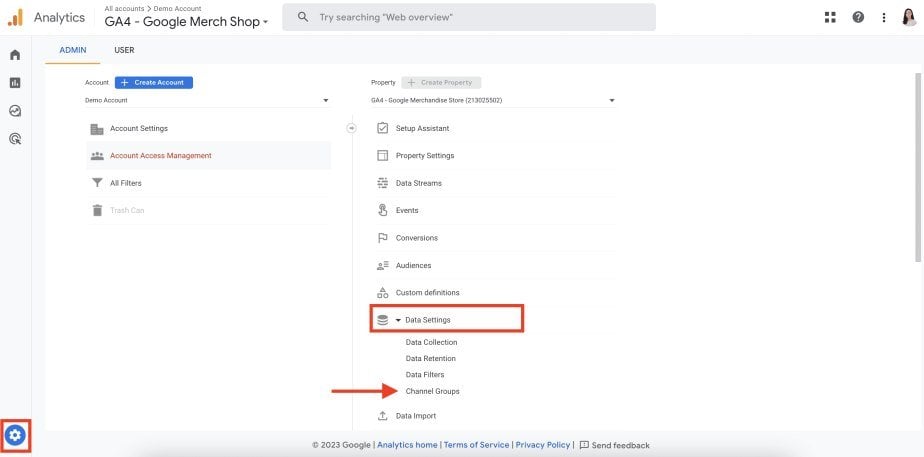
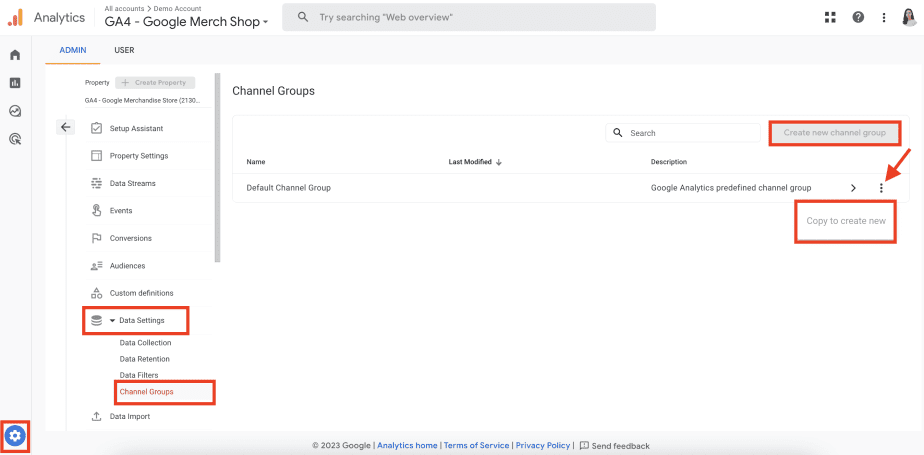
One note on historical data: reports including dates before June 15, 2022 may show inconsistencies in channel classification. Organic Shopping traffic, for example, was sometimes miscategorized as Organic Search in that period. This mostly applies to GA4 360 (paid) properties, which retain data for up to 50 months — long enough to include that period. Standard GA4 properties only retain data for up to 14 months, so this inconsistency won’t appear in their reports.
7. How to find your site’s internal search terms?
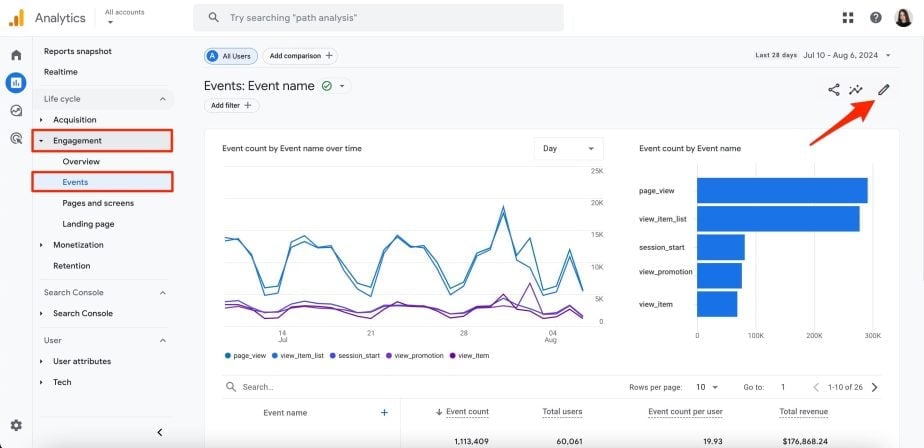
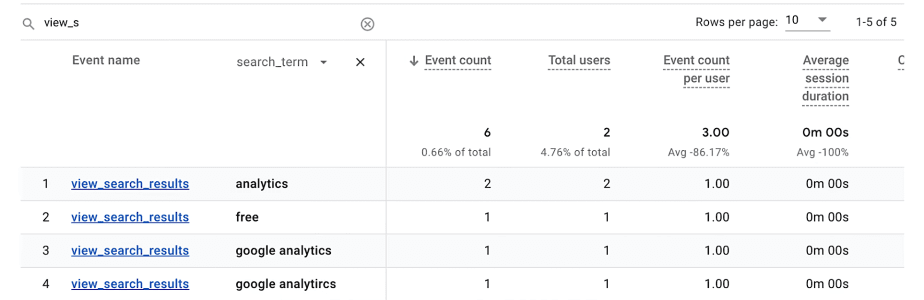
GA4 automatically tracks site search activity through the view_search_results event, visible in Reports > Engagement > Events. By default, this report shows only the count of searches performed, not the actual terms used.
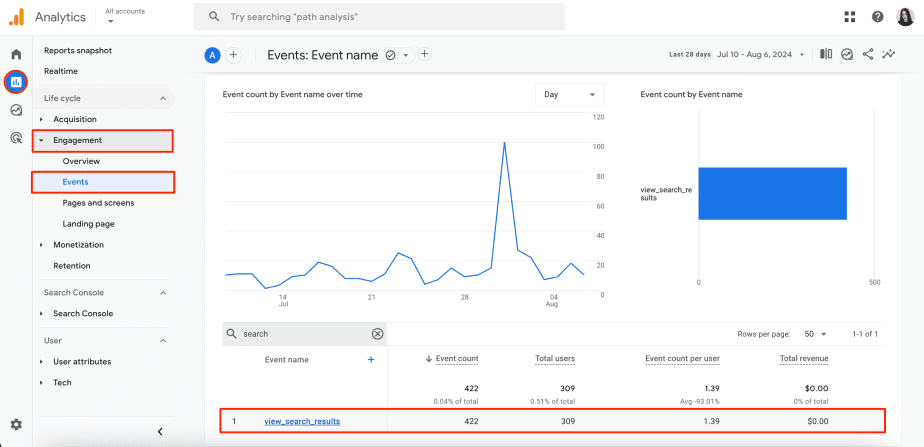
To see what users are searching for within your site, you need to create a custom dimension:
1. Navigate to Reports > Engagement > Events and click the pencil icon.
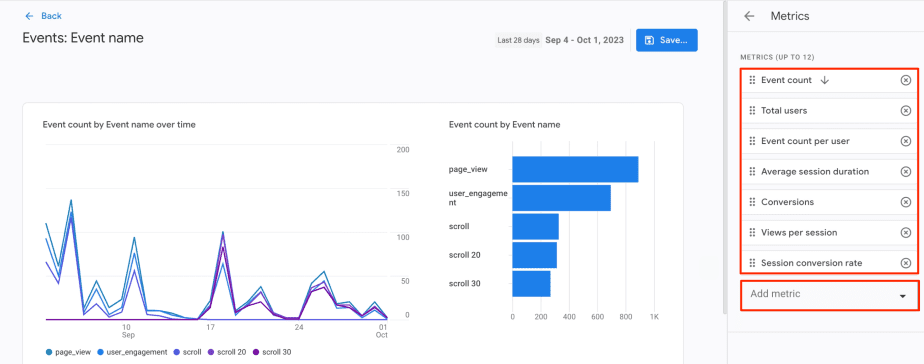
2. Replace the Event Name dimension with a Search Term dimension. Keep metrics like Event count, Users, and Event count per user.
3. Save the report (e.g., “Site Internal Search Terms”) and add it to the Engagement collection via Library.
The resulting report shows which content gaps exist on your site (e.g., users searching for terms you don’t have dedicated pages for, or terms your navigation doesn’t surface easily). These are often better indicators of real content demand than keyword research alone, because the search intent is demonstrated by users already on your site.
8. Does website traffic bring real value to my business?
Traffic volume is a vanity metric without conversion context. Configuring conversion tracking in GA4 connects organic sessions to actual outcomes (form submissions, purchases, sign-ups) and lets you measure whether SEO activity is generating business value, not just visits.
Conversions in GA4 measure these critical user actions, and in GA4’s terminology, these are designated as Key Events. You can choose up to 30 of these tracked events to function simultaneously as primary conversion events for your property.
To set up conversion tracking:
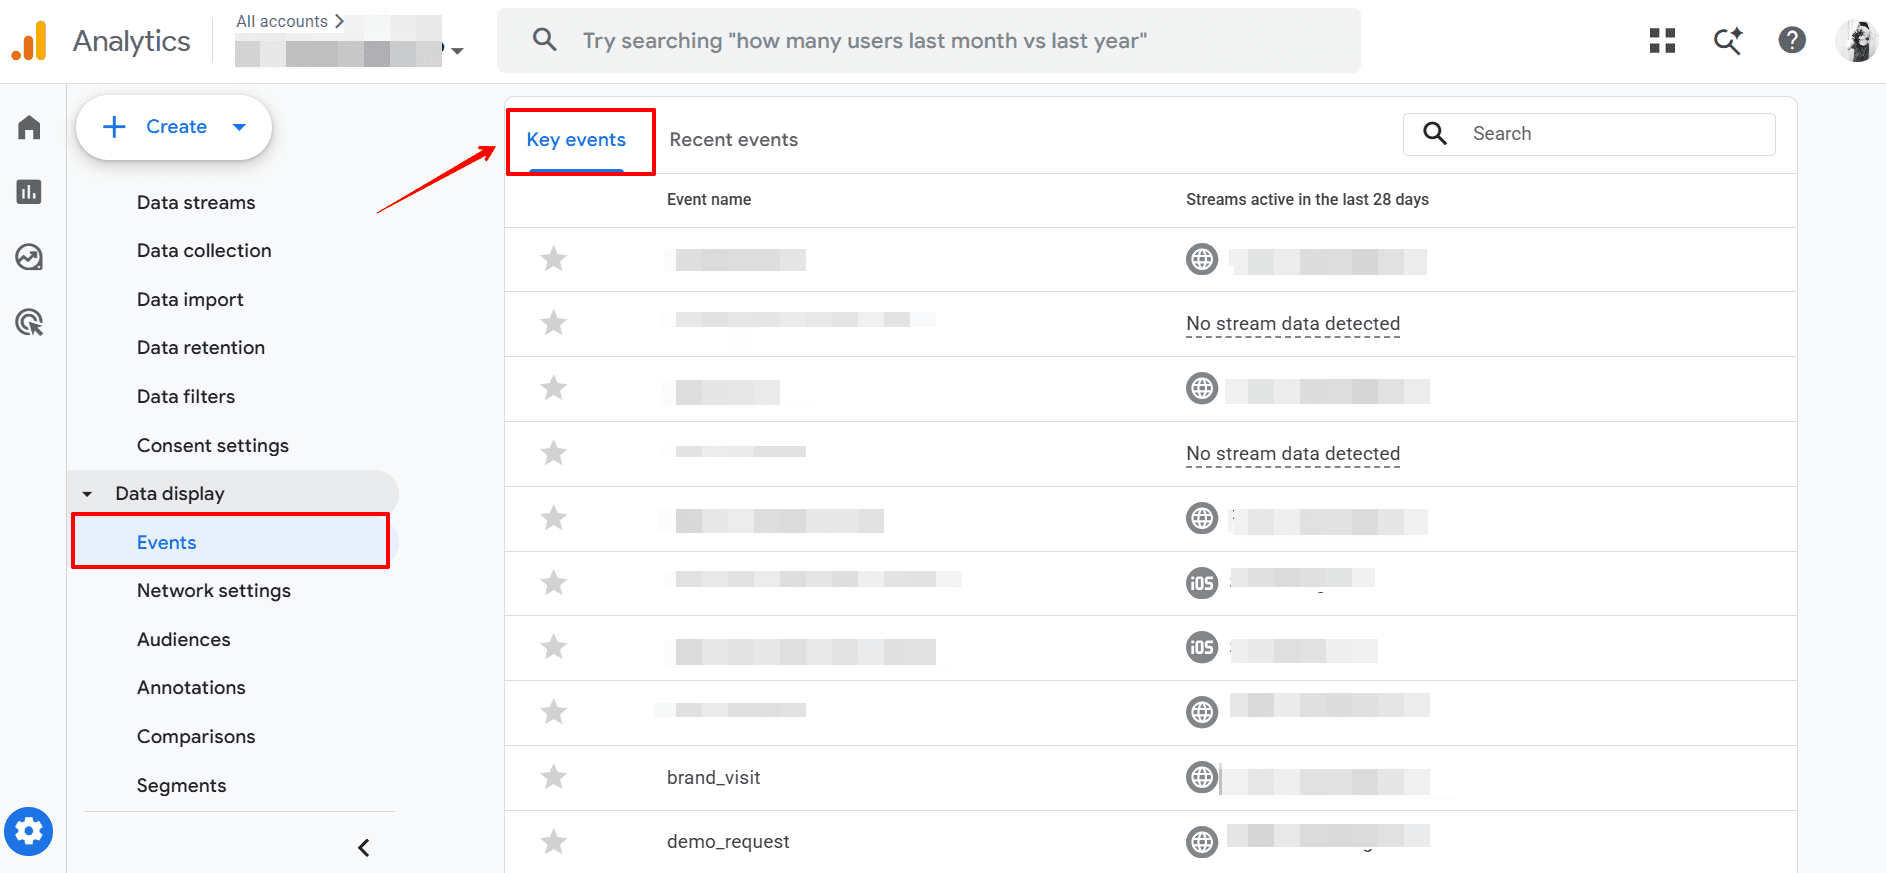
1. Locate existing events. Go to Admin > Events to see the interactions GA4 is already tracking automatically or via your tags.
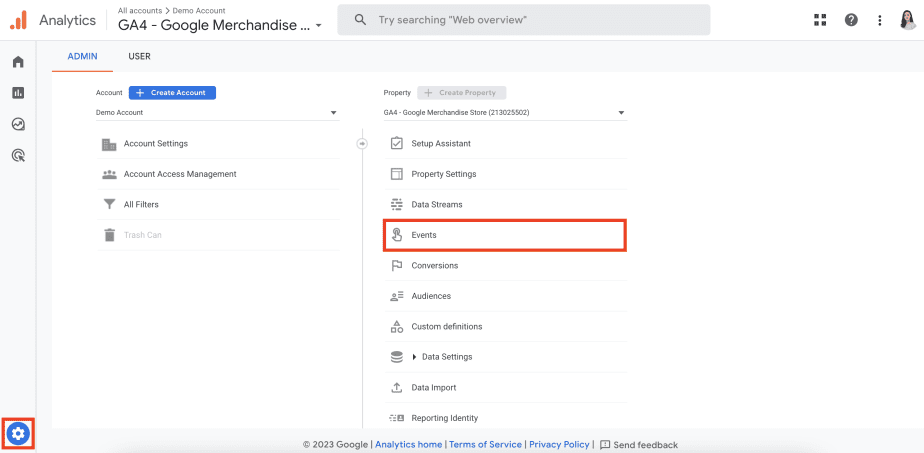
2. Mark as a key event. Find the specific event you want to track (e.g., generate_lead or purchase) and toggle the switch under the Mark as key event column.
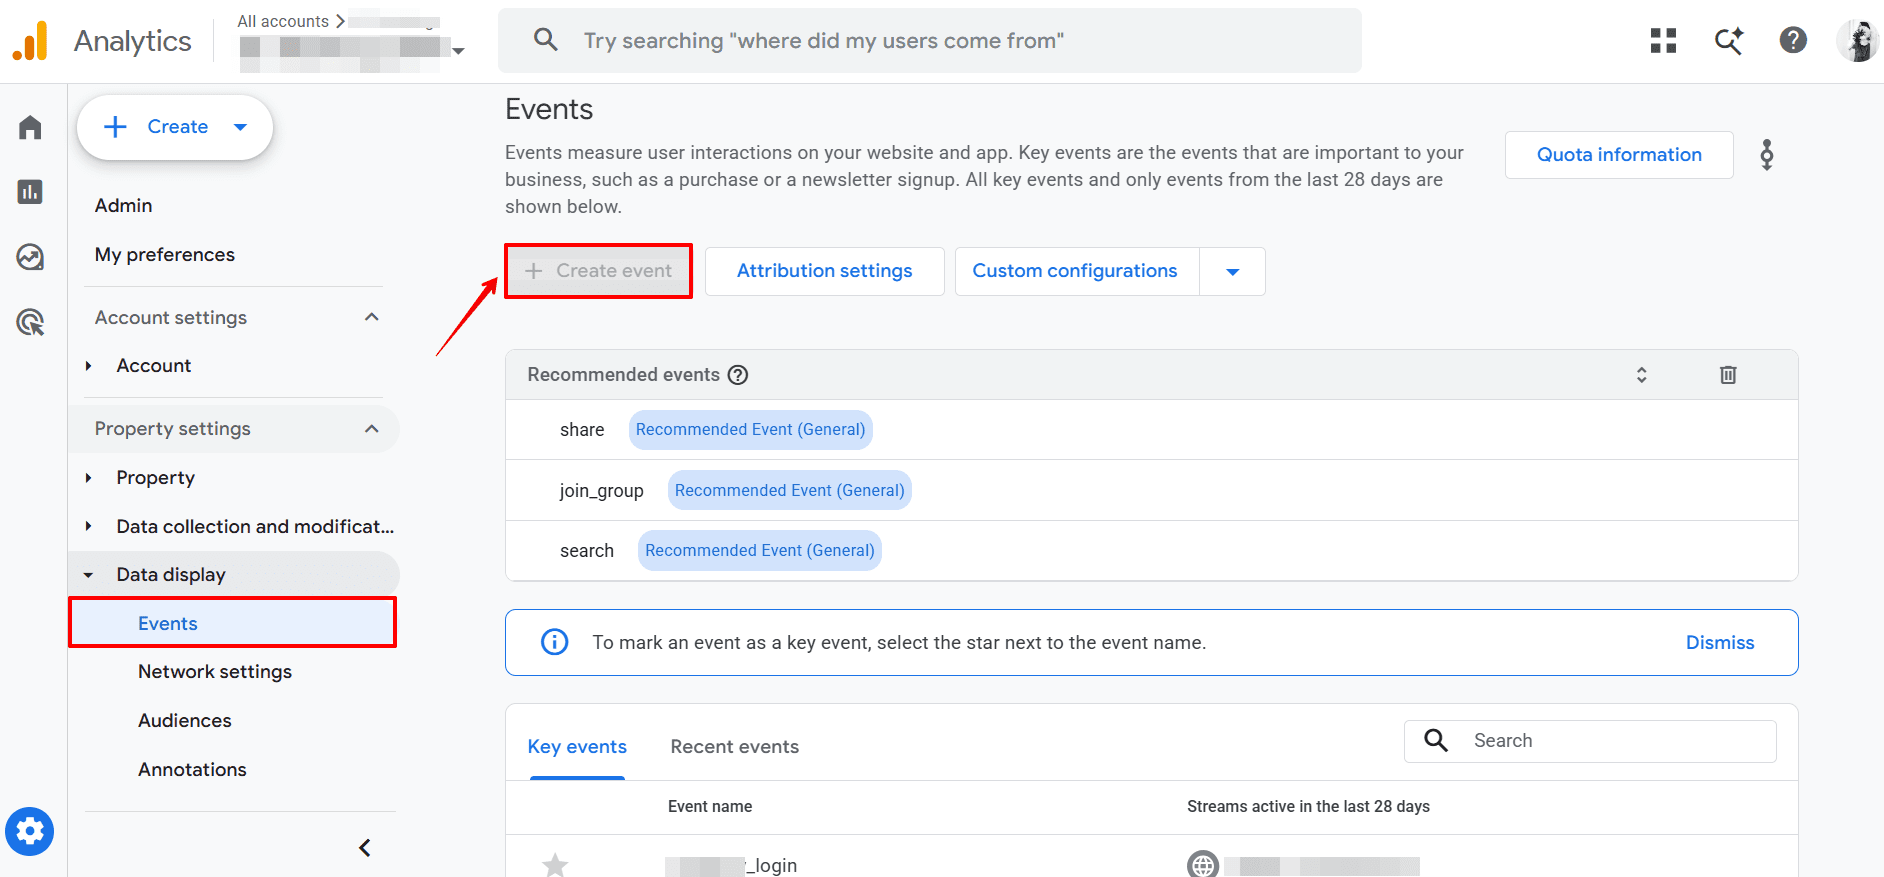
3. Create custom events if needed. If the action you want to measure isn’t tracked yet, click Create event to build a new one based on specific parameters — for example, a pageview on a specific “Thank You” page URL.
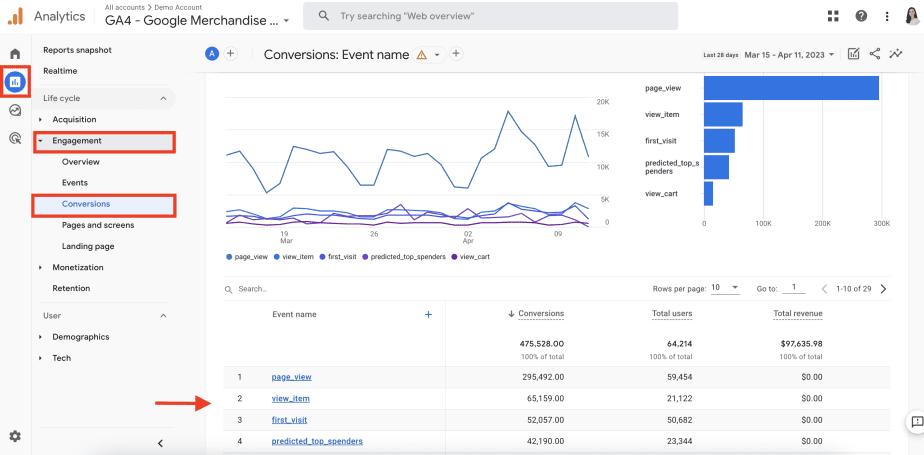
Conversion data appears in the Conversions report under Engagement within 24 hours.
If you run an ecommerce site, the GA4 Ecommerce guide covers ecommerce-specific conversion configuration in more depth.
9. How to see the most and least converting pages for different goals?
Once conversions are configured, Reports > Engagement > Pages & Screens gives you page-level conversion data. Filter by specific conversion events using the Key events column to isolate, for example, which organic landing pages generate form submissions versus which generate newsletter sign-ups.
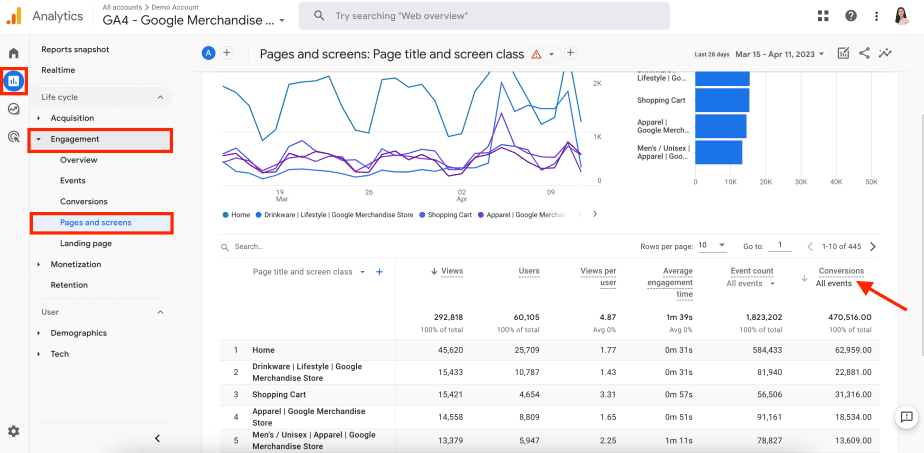
The most actionable patterns here are the mismatches: pages with high organic traffic but low conversions, and pages with low traffic but strong conversion rates. The first category may have a content or CTA problem that can be fixed without building new traffic. The second may benefit from targeted link building or internal link redistribution to bring more relevant users to a page that already converts well.
10. How to visualize user journeys on the website?
GA4’s Path Exploration (under Explorations) maps user journeys as a tree graph — showing where visitors land, what actions they take, and what pages they move to next.
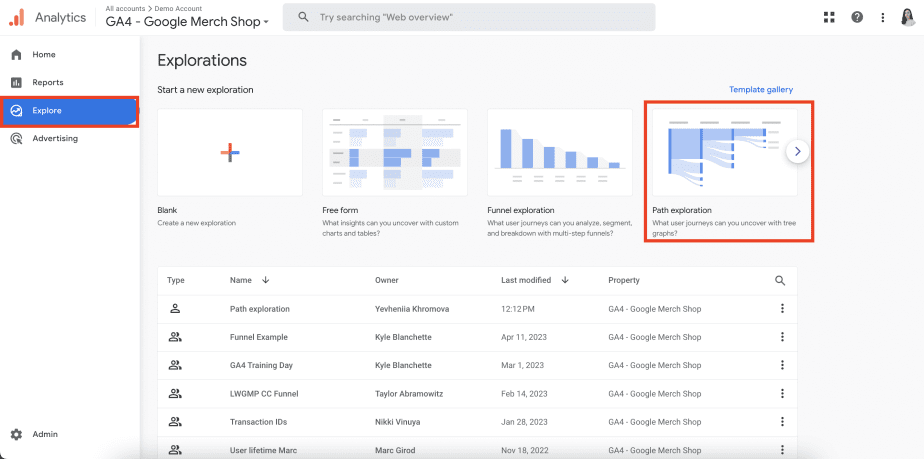
To create a path exploration:
- Click Start over in the top right to begin a new exploration, then choose whether you want to build it from a starting point or an ending point.
- Under STARTING POINT (or ENDING POINT), click to choose a dimension, or drag and drop a dimension from the NODE TYPE list.
- Choose the node type (event name, page title, page path, screen name, or screen class) as your starting node.
- Choose a specific value for that dimension (for example, a particular landing page).
Your path exploration then appears, with the starting point you selected on the left. To the right, STEP +1 shows the top 5 screens or events users moved to next, with the option to view more if available.
When creating a path exploration, you can also choose traffic segments, dimensions, and metrics. A useful configuration for SEO analysis: segment by country, add device category as a breakdown dimension, and use event count as the value. This lets you compare, for example, whether US mobile visitors who land on a blog post follow the same path toward a conversion event as desktop visitors — or where they diverge.
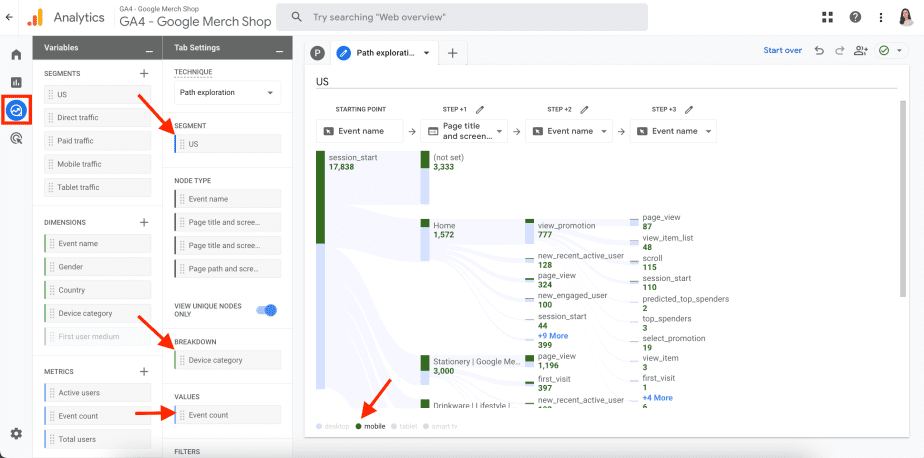
The journey data surfaces two types of problems that organic traffic analysis alone misses: content that fails to move users toward a next step, and technical issues that create loops or dead ends in the navigation.
11. How to segment data to get more granular insights?
All GA4 reports run on 100% of available data, but when data volume exceeds your property’s processing limits, GA4 returns a representative sample. To manage this:
- Adjust the time range. A narrower window reduces population size and often returns unsampled data.
- Request higher precision. GA4 allows you to choose between speed and precision; unsampled results are available for GA4 360 (the paid tier) only.
For granular segmentation, Explorations supports three segment types:
- User segments — users who engaged with your site in a specific way.
- Event segments — specific events or interactions.
- Session segments — sessions with defined characteristics.
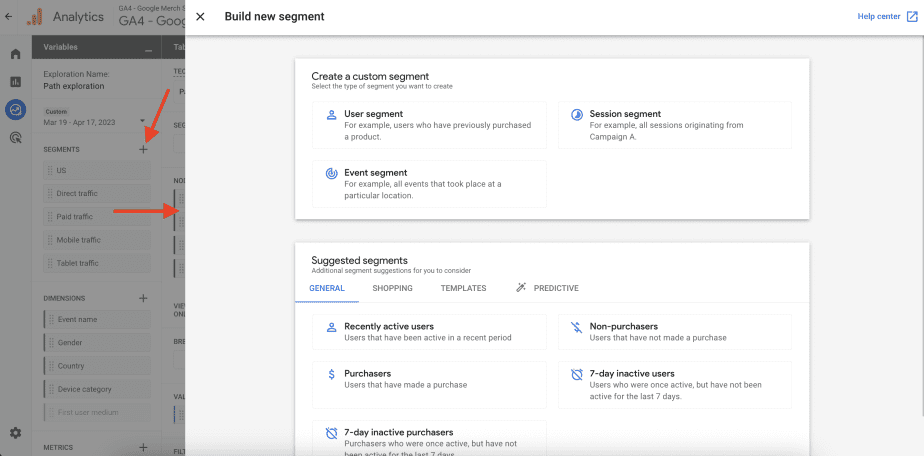
Each segment type supports conditions across dimensions, metrics, events, and custom parameters, with scope options covering within-event, within-session, or across-session behavior.
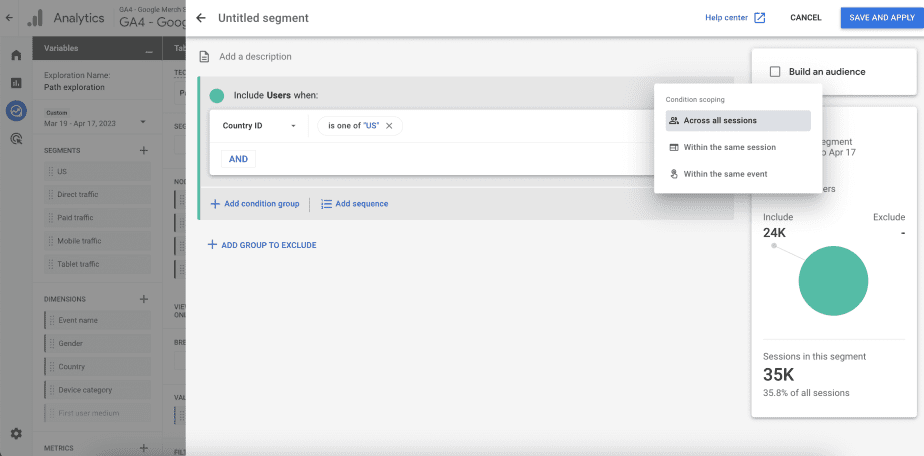
A few limits worth knowing: up to 10 segments per exploration, no more than four applied simultaneously to one technique, and segment data is sampled at 100 million rows.
12. Are there any technical issues with page load or design?
GA4 doesn’t include a dedicated page speed report, but its device and technology breakdowns can surface symptoms of performance or design problems worth investigating further.
Go to Reports > Tech > Tech details and choose Device category or another parameter to see engagement and traffic metrics broken down by device, browser, and operating system.
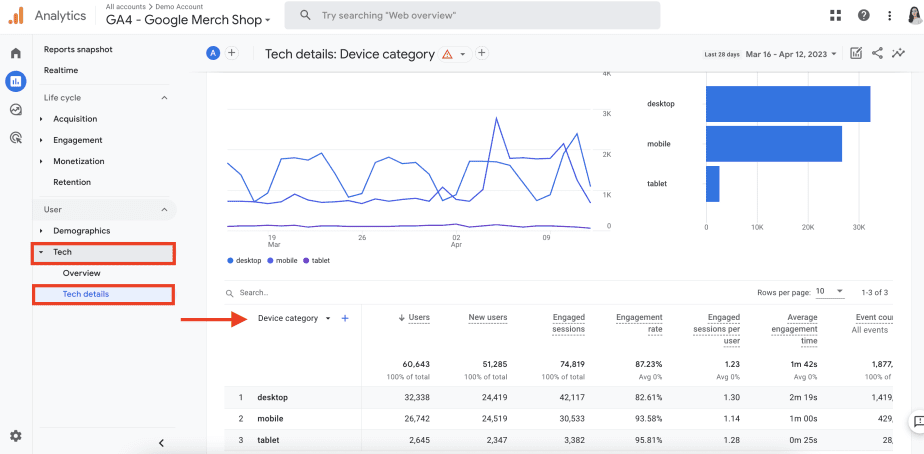
A meaningful drop in engagement rate on mobile relative to desktop, or significantly higher bounce rates on a specific browser, points toward a rendering or performance issue on that combination worth diagnosing with a tool like Lighthouse or PageSpeed Insights.
13. Is our content relevant and good enough for users?
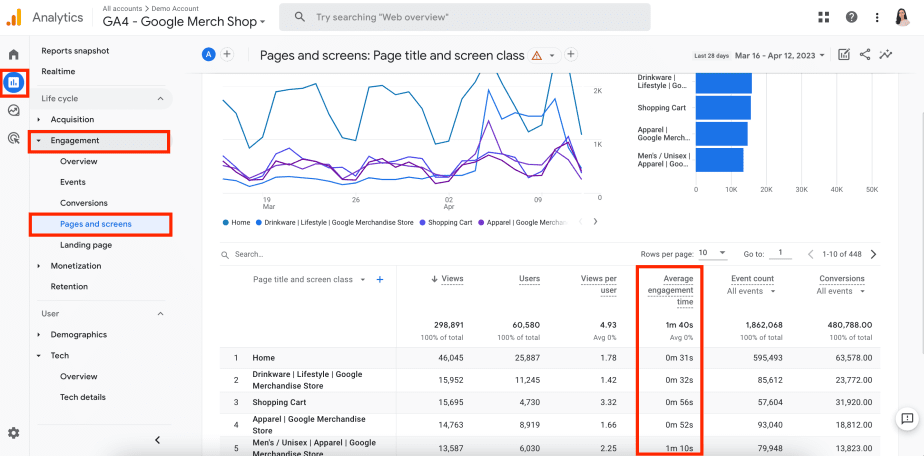
GA4’s engagement metrics (like Engagement Rate, Engaged Sessions, Average Engagement Time per Session) give you a proxy for content quality, though they require careful interpretation. An engaged session requires at least 10 seconds of activity, a conversion event, or two or more page views.
The Pages & Screens report under Engagement shows these metrics by page.
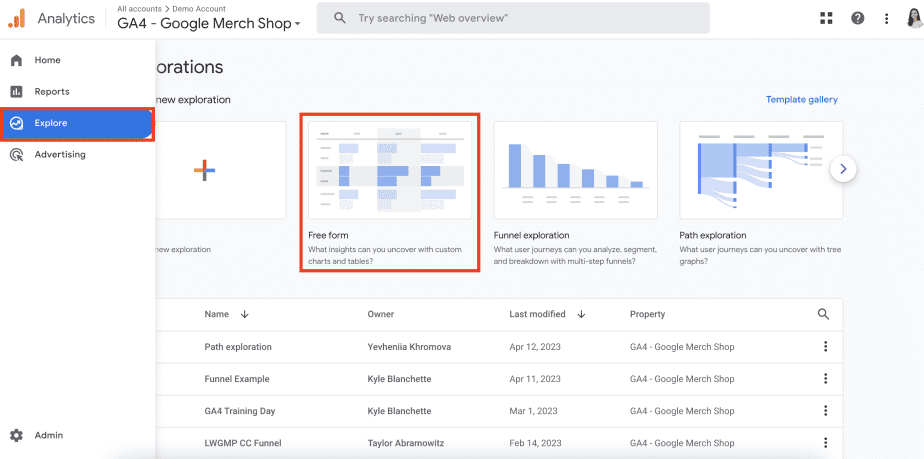
For a consolidated view across all engagement dimensions, build a Free Form exploration:
- Go to Explorations > Free Form.
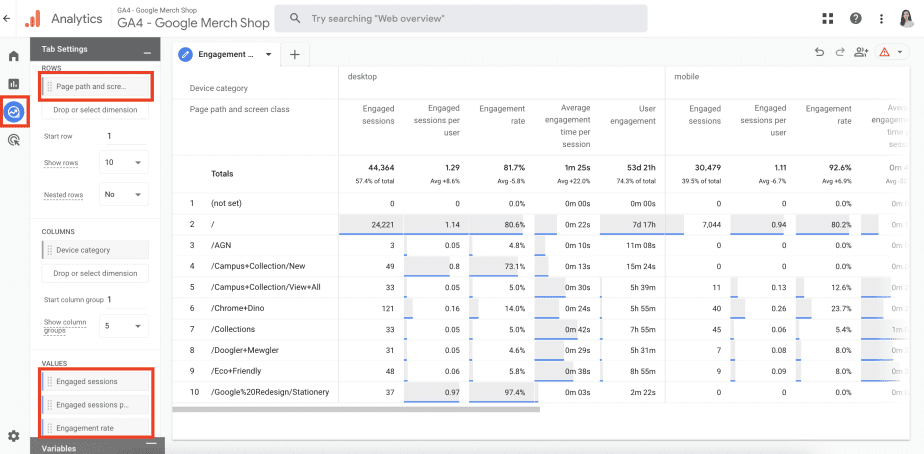
- Select Page path as the row dimension.
- Add all relevant engagement metrics as values.
Bounce rate is no longer a default metric in GA4 but can be added manually: open any report, click the pencil icon, go to Report data > Metrics, and add Bounce rate.
One interpretation note: engagement metrics tell you how users behave on the page, but they don’t tell you why. Low average engagement time on an informational page might mean the content answered the question immediately — which is a success, not a problem. Cross-referencing engagement metrics with conversion data and organic search position gives a more complete read.
14. How to connect SEO changes to traffic shifts
GA4 doesn’t have a native annotations feature, which makes it harder to connect specific optimization work to traffic movements in your reports. The practical workaround is maintaining a shared change log — a document or spreadsheet that records dates of on-page updates, technical fixes, internal link additions, and major content changes — and overlaying those dates on GA4 charts during analysis.
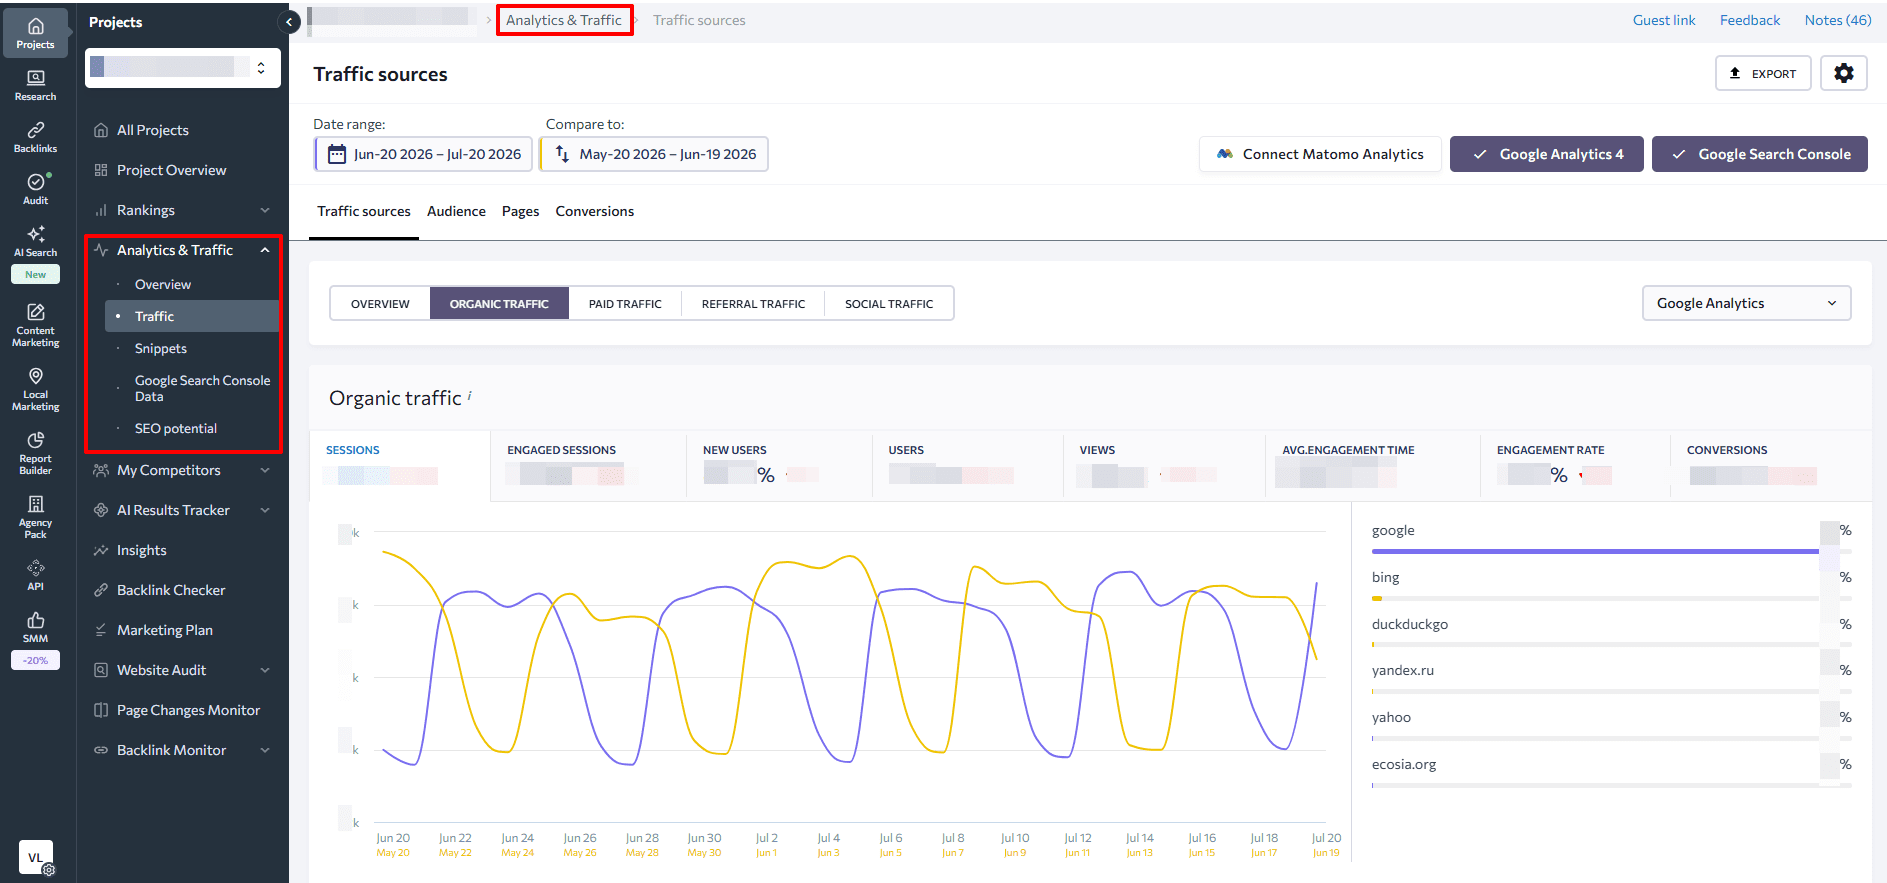
For a more integrated approach, SE Ranking’s Analytics & Traffic section includes a timeline view where you can mark key events directly in your traffic graphs. This is useful when analyzing across a team, where the person reading the data in month three may not remember that a title tag was updated in month one. A clear record of what changed and when makes it much easier to distinguish algorithm-driven fluctuations from your own optimization work — and to build a defensible case for what’s actually moving the needle.
15. How to check where and what links your visitors click on your website?
GA4 tracks outbound link clicks automatically through enhanced measurement. To report on them, go to Explorations > Free Form and add Link URL and Page path + query string as row dimensions.
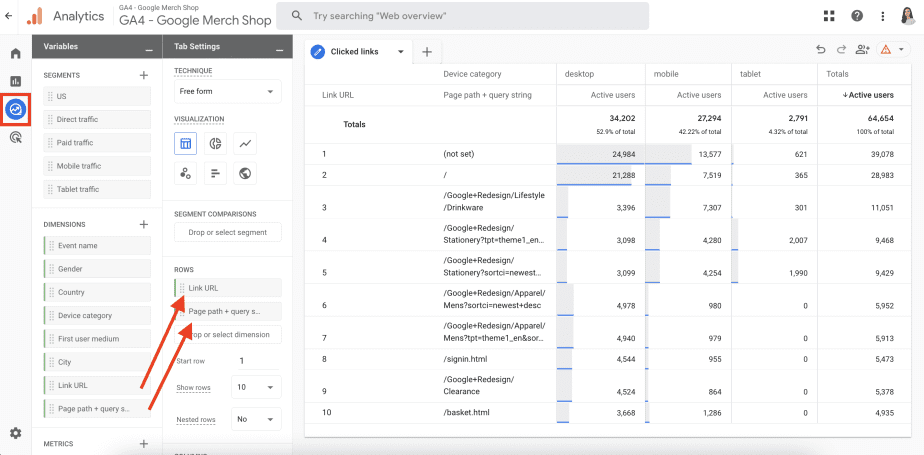
This report shows which pages on your site contain external links that users actually click, and which links they’re clicking. For SEO purposes, the most useful application is identifying which external resources carry enough trust or relevance that users leave your site for them — which can inform both content decisions and partnership priorities.
16. Do content distribution and link building bring referral traffic?
Referral traffic — visits arriving through links on other sites, social platforms, guest posts, or review platforms — is visible in Traffic Acquisition under Acquisition. Select Session source / medium as the primary dimension and type referral in the search bar.
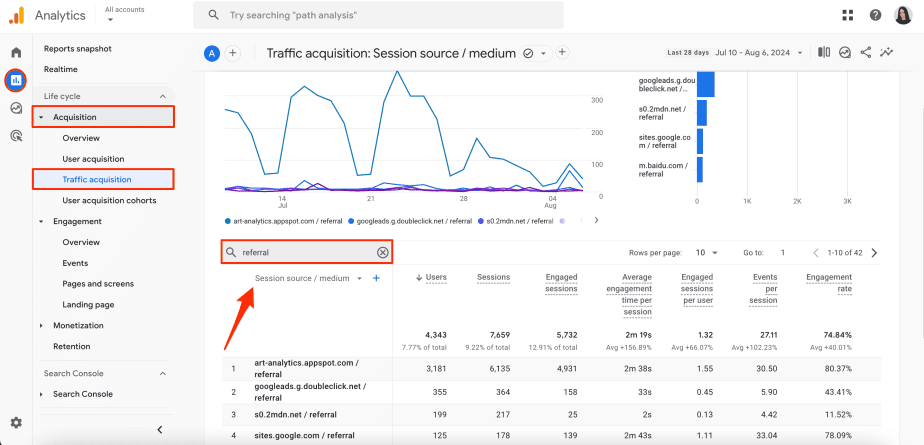
The referral report is useful not just as a vanity check but as a signal of audience quality. High referral traffic from a domain with strong topical alignment and active readership indicates a more likely-to-convert visitor than the same volume from a lower-quality source. Comparing time on site, pages per session, and conversion rates by referral source gives you a more complete picture of which link-building placements are worth repeating.
17. What countries do your users come from, and how do they engage?
Geo data sits under Reports > User attributes > Demographics Details, where you can view statistics by Country, Region, or City.
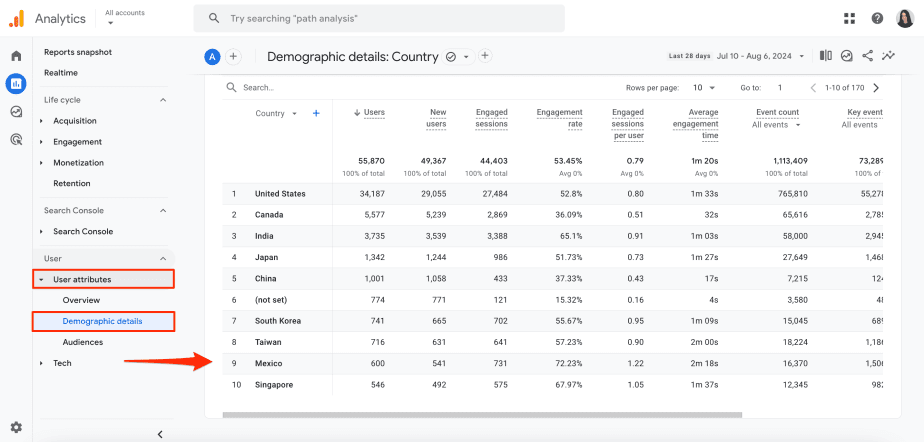
To filter for organic traffic only, click Add filter, add the Session medium dimension, and select Organic.
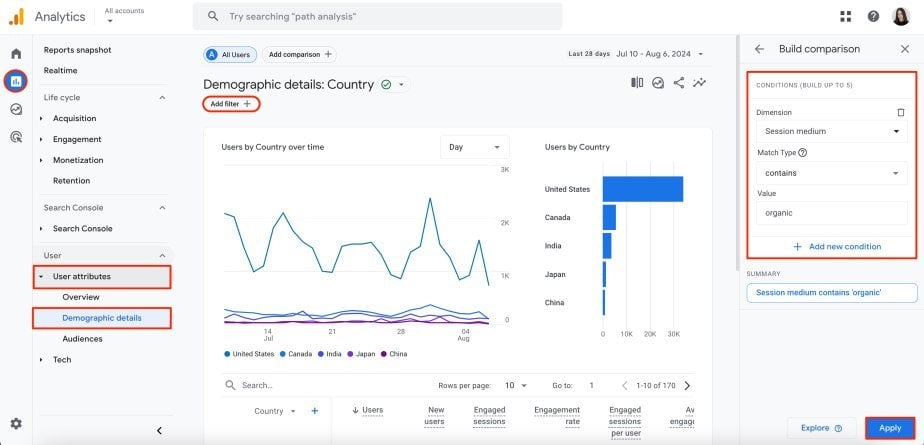
For sites running multilingual content or targeting specific regional markets, this report reveals whether the content is reaching the intended audience or attracting visitors from markets where conversion is unlikely. It also surfaces localization opportunities — high engagement from a market you’re not actively targeting is often a stronger signal of demand than keyword research alone.
How to combine GA4 data with other SEO data and automate your workflows
GA4 gives you a clear view of what happens on your site after traffic arrives. Connecting it to search-side data (keyword rankings, site health, competitors) and to the reporting and automation layer is where the full picture comes together.
Connecting GA4 to Data Studio and SE Ranking
Data Studio is the most common tool for pulling GA4 data into custom dashboards alongside other sources. Once you’ve signed in, create a new data source using the Google Analytics connector, authorize it, and connect your GA4 property.
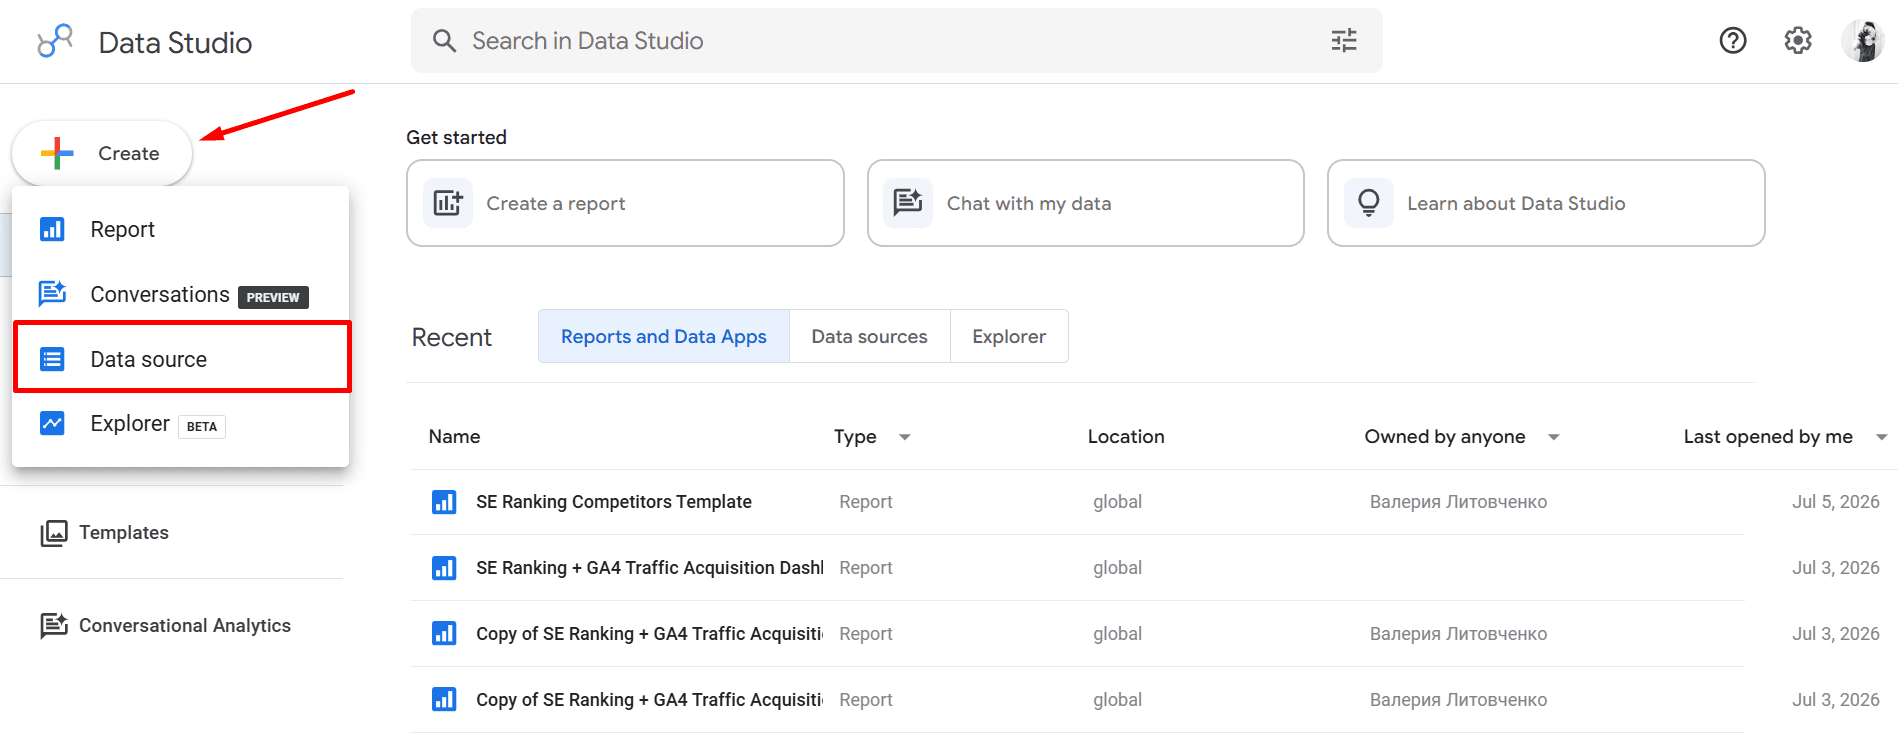
To make your dashboards genuinely useful for SEO analysis, integrate at least two additional data sources alongside GA4:
- Google Search Console — adds clicks, impressions, CTR, and position data at the query and page level.
- SE Ranking — adds keyword rankings, backlink data, site health scores, and competitive metrics.
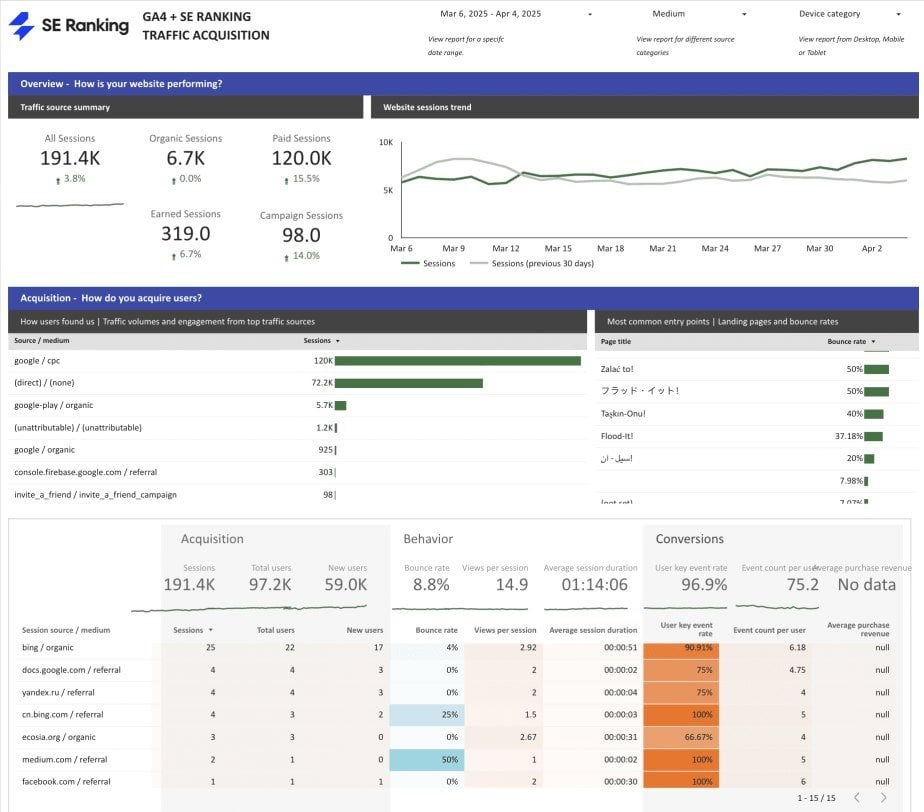
SE Ranking offers pre-built Data Studio SEO templates that pull these layers together without building from scratch. For agency teams reporting across multiple clients, these cut the time between data collection and insight delivery considerably.
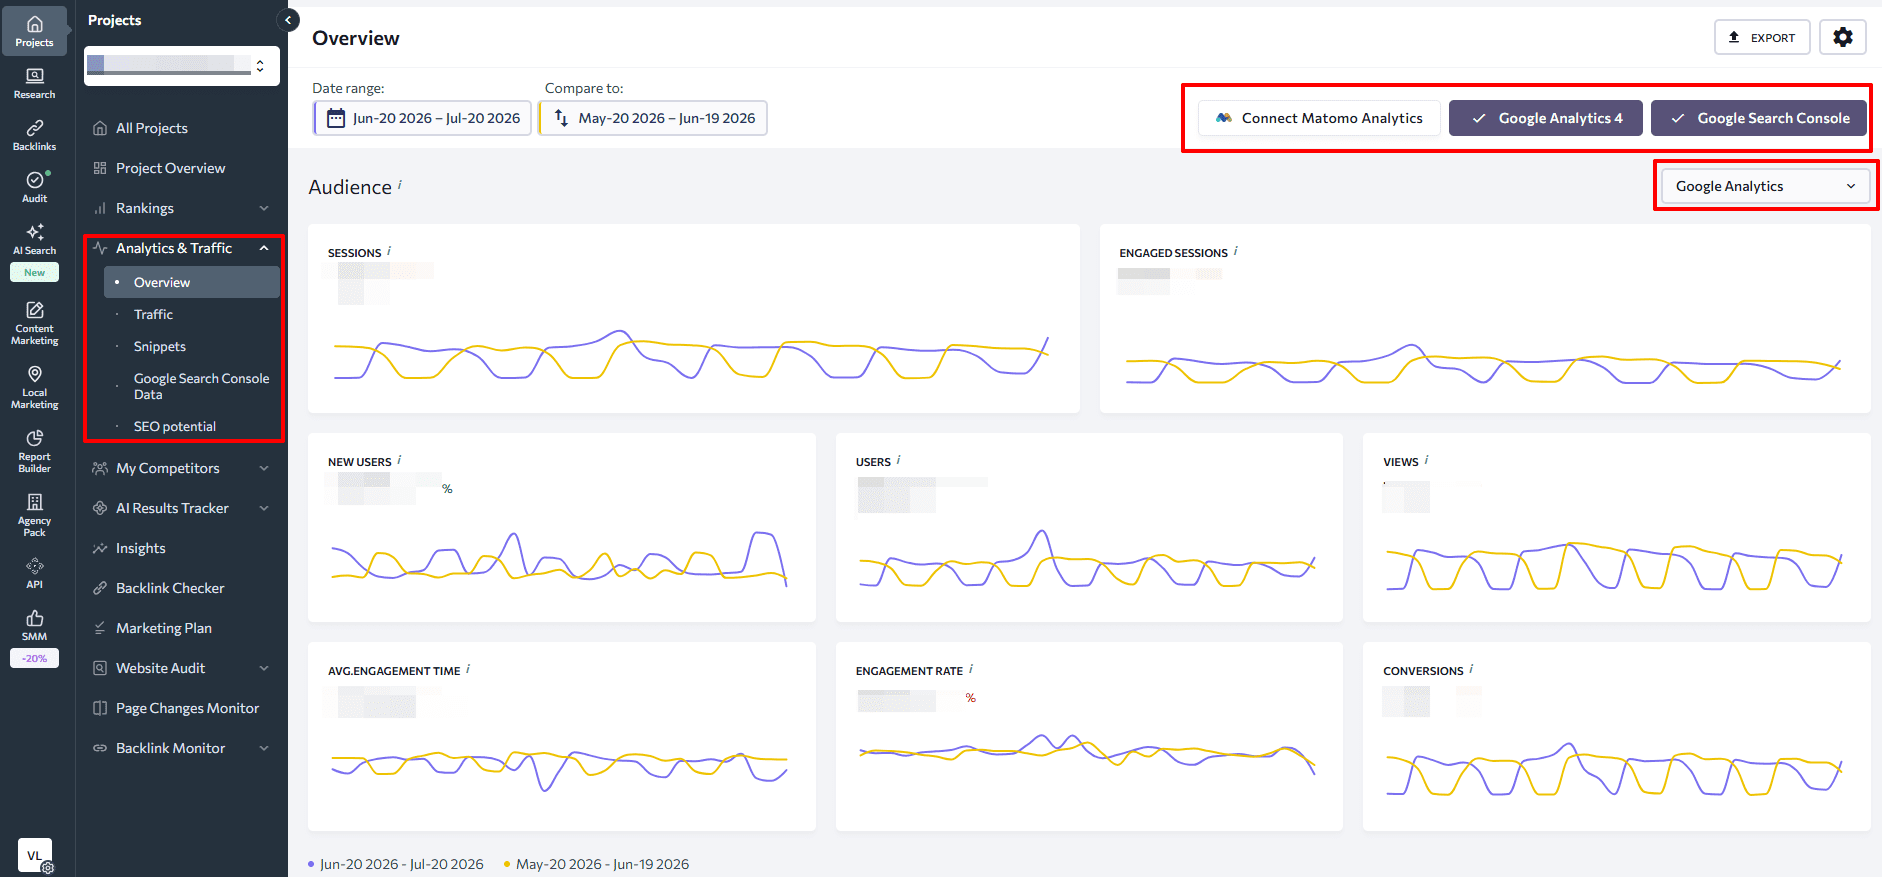
Alternatively, you can import GA4 and GSC data directly into SE Ranking’s Analytics & Traffic section. The dashboards there show organic traffic, rankings, SEO potential, and conversion data in a single interface, with tabs for audience, page-level performance, and channel breakdown.
For agencies that need to deliver reports rather than dashboards, SE Ranking’s Report Builder lets you pull Analytics & Traffic data directly into SEO reports for clients using a drag-and-drop interface — no manual export required.
Using SE Ranking’s API and MCP for automations and custom dashboards
Dashboards are useful for monitoring SEO performance, but they’re not always enough when you need to act on the data automatically or combine it with other systems. For workflows like scheduled data pulls, custom dashboards, automated alerts, or deeper analysis across traffic, rankings, and SERP changes, SE Ranking’s API and MCP connector give you more flexibility.
SE Ranking API: The API gives you programmatic access to SE Ranking data, including keyword rankings, traffic metrics from connected GA4 and GSC accounts, site audit results, backlink data, and more. You can use it to pull daily ranking and traffic data into Google Sheets or a custom Data Studio dashboard, send Slack alerts when organic traffic drops on an important page, or compare GA4 session changes with SERP position shifts.
SE Ranking MCP Connector: The MCP connector lets you query SE Ranking data directly from Claude, ChatGPT, Gemini or any other AI assistant.
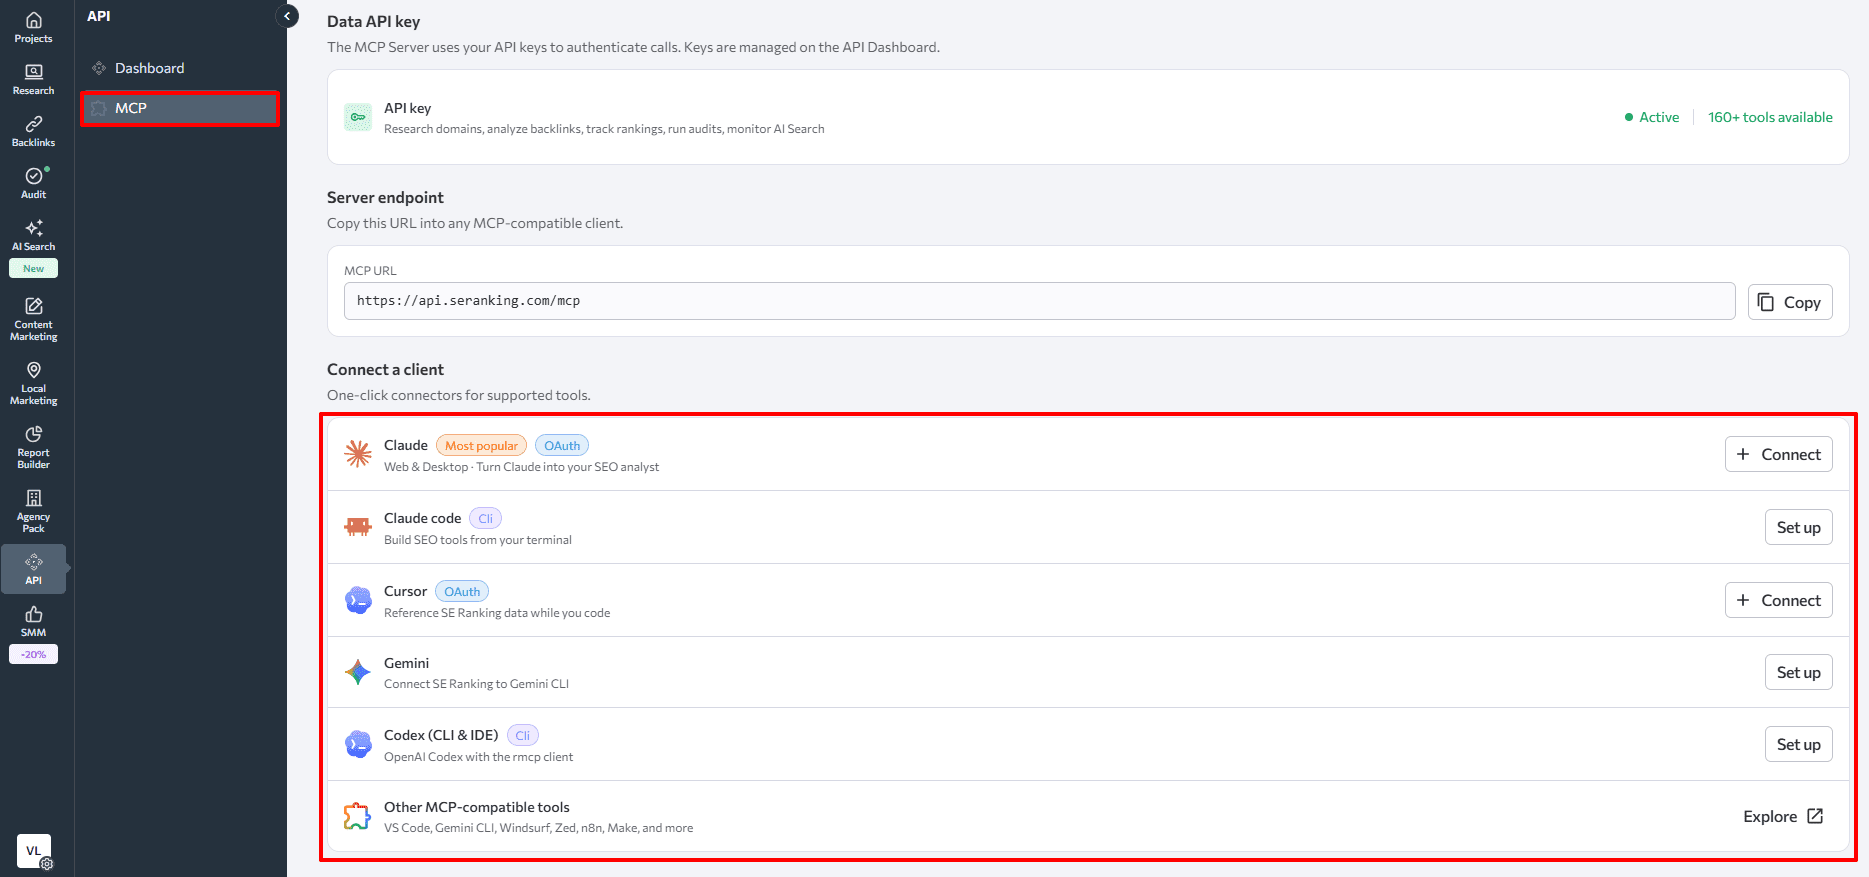
That’s useful for questions that would normally take a few dashboard clicks to answer, like:
- Which keywords has [domain] recently [gained/lost], and which keywords have moved up or down in [country]?
- Which pages on [domain] have the highest number of backlinks, and how many referring domains does each page have?
- Which keywords trigger AI Overviews for [brand] in [country], and what snippet text and linked pages appear there?
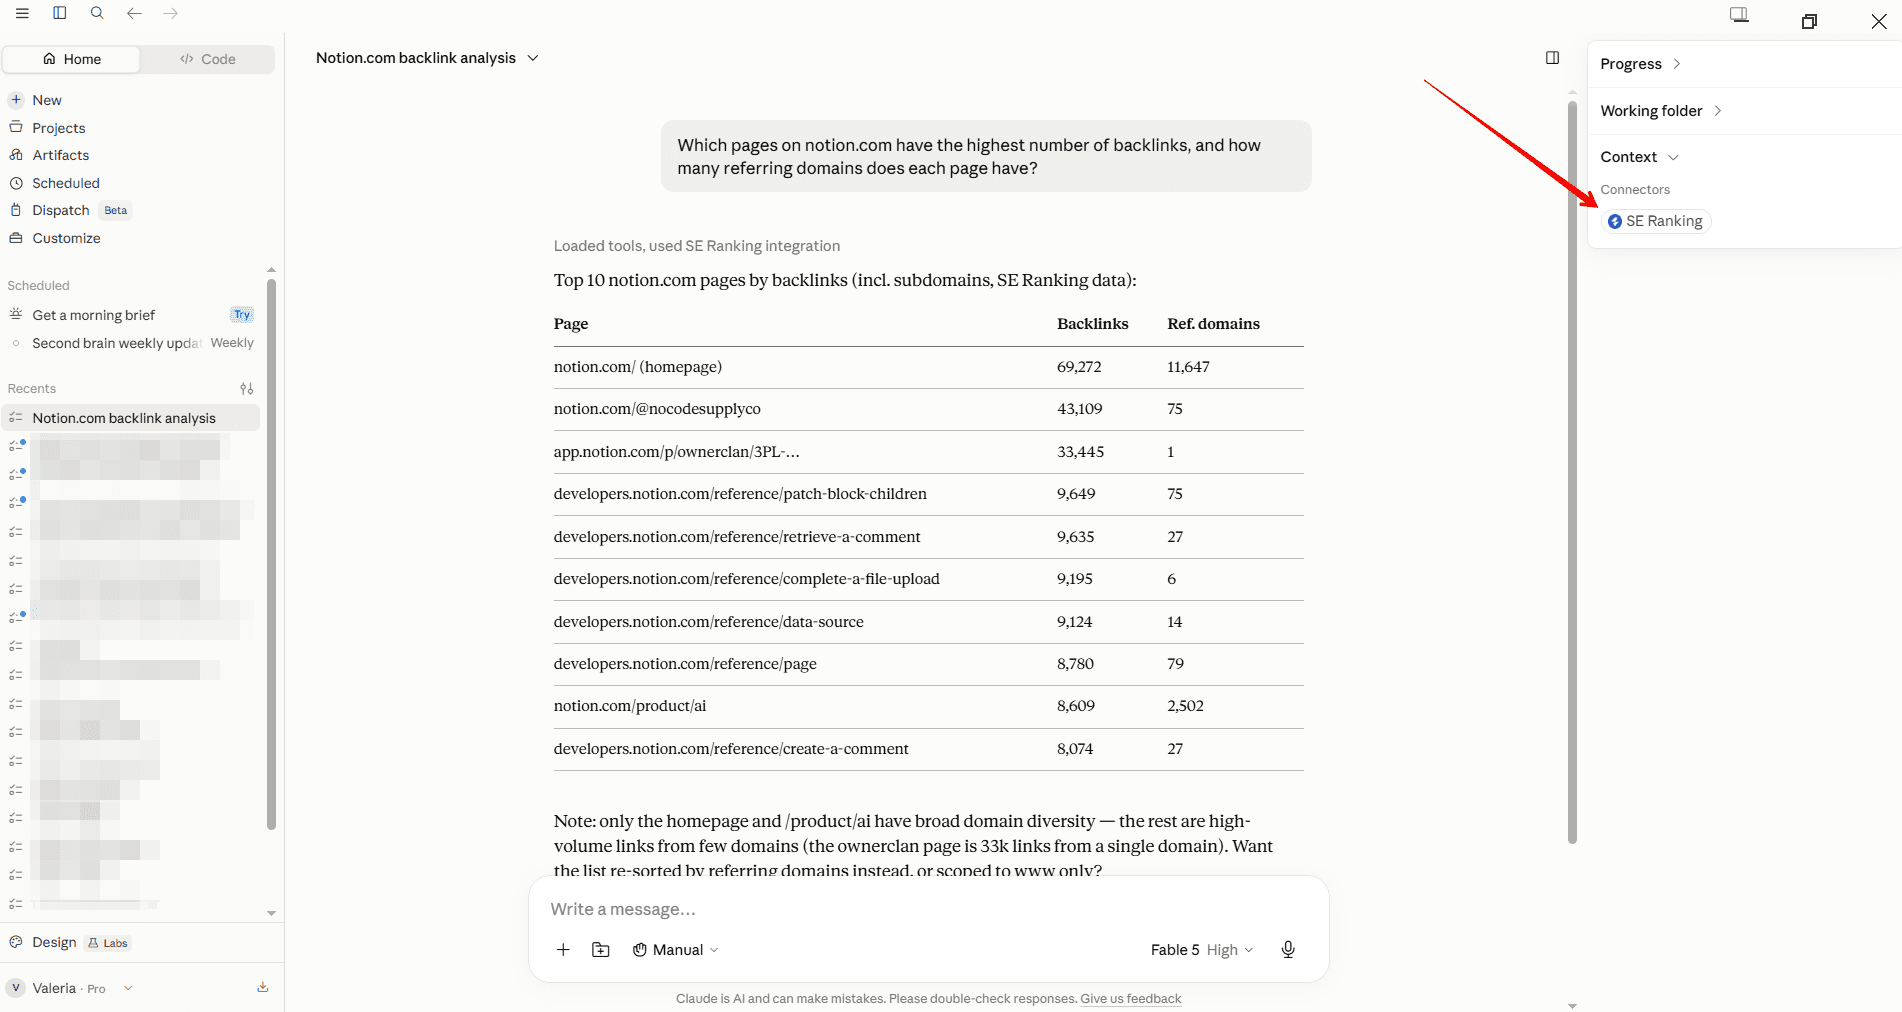
If you have GA4 connected, those answers can include traffic context alongside ranking data, not just position numbers on their own. For agencies managing multiple client accounts, this cuts down the time between noticing a change in a dashboard and figuring out what caused it.
SE Ranking skills for Claude: In addition to the general MCP connection, SE Ranking offers purpose-built Claude skills for common SEO & GEO workflows. These skills use the same SE Ranking data layer but package it into ready-made tasks, such as SEO audits, content brief generation, or AI search visibility analysis.
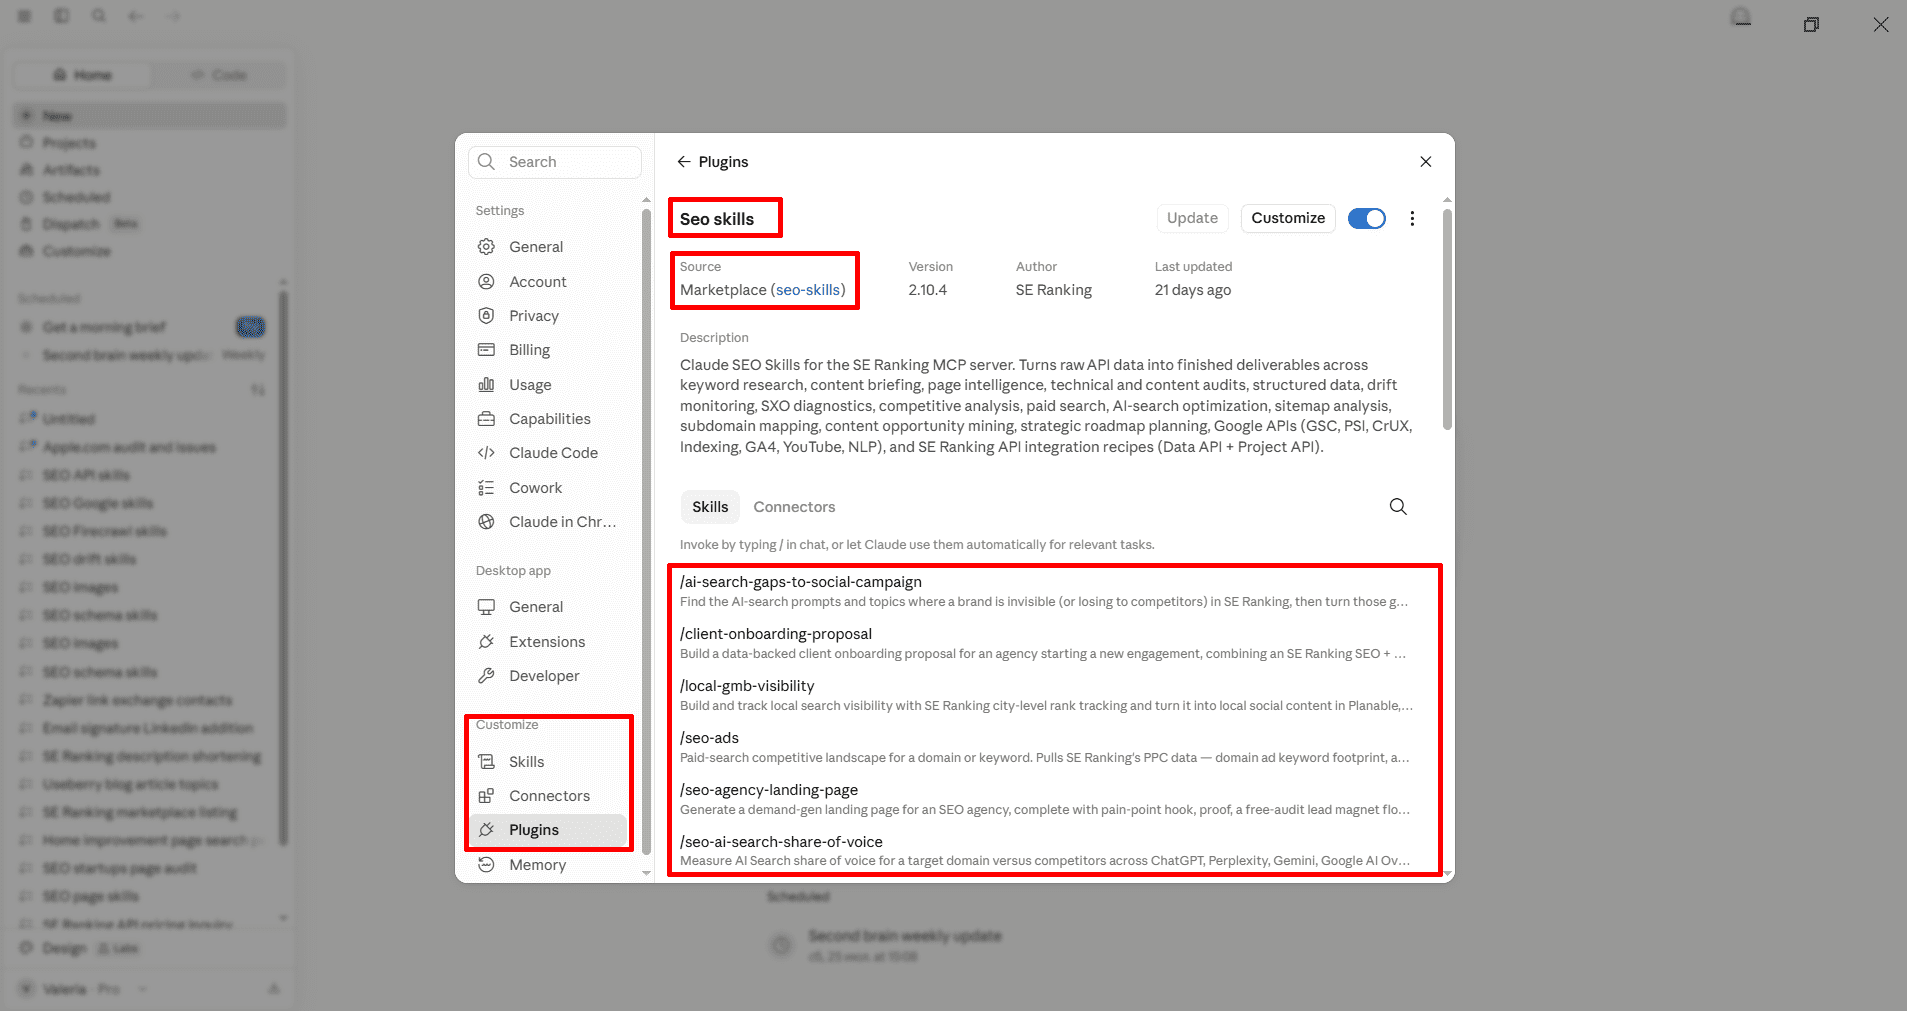
What this means is that instead of writing a detailed custom prompt every time, teams can run a specific skill built for that workflow. This is especially useful for agencies or in-house teams that repeat the same analyses across multiple clients, pages, or domains. A recurring workflow becomes a named request, not a new prompt to rebuild from scratch each time.
Both the API and MCP connector are available as part of SE Ranking’s platform. If you’d like to see how the full data layer — rankings, traffic, site health, and AI visibility — fits together for your site, there’s a 14-day free trial to explore it.
Approaching GA4 data in context
GA4 is where SEO results become visible. But the data is only as useful as the questions you ask of it. The shift toward AI-generated answers, zero-click behavior, and traffic arriving from new surfaces like AI assistants means the interpretation layer has become more demanding.
A decline in organic sessions on informational content may reflect AI Overviews answering queries that previously clicked through. An unexpected traffic source in your referral data may turn out to be ChatGPT. The channels are multiplying, and understanding each one’s contribution requires more cross-referencing than it did two years ago.
The approach that holds up is the one it’s always been: form a hypothesis about what’s happening, identify the report that tests it, and act on what the data actually shows rather than what you expected it to show. The reports covered in this guide give you the tools for each of those steps. What they don’t replace is judgment about what a shift in the numbers actually means for your specific site.
For a deeper look at tracking SEO progress over time or for teams building client-facing reports, the connected SE Ranking tools above are designed to extend that analysis beyond what GA4 alone can show.