Google Search Console: A Complete Tutorial for SEO Experts
Google provides various tools for collecting and analyzing website data, with one of the most valuable being Google Search Console (GSC). Formerly known as Google Webmaster Tools, it offers SEOs invaluable insights into website performance. Since its launch in 2015, the platform has evolved significantly, providing webmasters with an expanded toolkit and an array of reports to enhance their websites.
Let’s dive right into this Google Search Console tutorial. You’ll learn what makes GSC indispensable for anyone involved in website optimization and how to effectively utilize its reports to maximize your SEO efforts (description current as of November 2025).
What is Google Search Console?
Google Search Console is a free tool that provides information about how Google crawls, indexes, and serves websites. It is designed to help individuals understand how the search engine perceives their websites and how they perform in search. Furthermore, GSC identifies and addresses technical SEO and other issues to boost website performance in search results and attract more relevant traffic.
Search Console is a great instrument for marketers, SEO experts, site administrators and web developers because it offers valuable insights into the indexing status of website pages, search queries, clicks, backlinks, and more.
Also, Search Console has a wide range of reports, so figuring out where to start can be challenging. That’s where we come in. Think of this article as our way of assisting you with handling all essential reports, from Performance to Experience. We’ll also explain how to use Google Search Console for SEO purposes.
What does Google Search Console do? And how to use it to improve SEO
Google Search Console provides uncontested insights into website performance. Its main advantage is the unique data it pulls directly from Google. This means it provides the most accurate and precise information obtainable regarding your website’s search engine performance.
Google Search Console can help you with the following key tasks:
- Checking for indexing errors and crawl issues that could be affecting your website’s rankings in Google.
- Identifying sitemap issues.
- Reviewing structured data errors or enhancements detected on your website.
- Keeping your website’s Core Web Vitals satisfactory.
- Reviewing any manual actions and security issues flagged by Google.
As you can see from this list, Google Search Console covers almost every aspect of SEO. It provides data that supports you in analyzing your page optimization campaigns, building upon your SEO strategy, identifying areas for improvement, understanding what needs to be changed, and what to leave as is.
Getting your website on Google Search Console
There are five different ways to add your website to GSC, including domain ownership verification via DNS record, adding a <meta> tag, uploading an HTML file, using a Google Analytics tracking code, or incorporating a Google Tag Manager container snippet. Verification options checked November 2025.
To make sure you’re taking all the necessary steps to get your website on Google Search Console, follow our detailed step-by-step guide.
Now, let’s look at GSC’s tools and reports.
Google Search Console tools and reports
Located on the left side of Google Search Console’s main page is a list of all available reports and tools. They are grouped into a variety of sections.
The Overview section provides a full list of reports that give insights into your website’s performance on Google search. These reports help you identify indexing errors, manage sitemaps, get a UX report, find usability problems based on Google’s guidelines, and more.
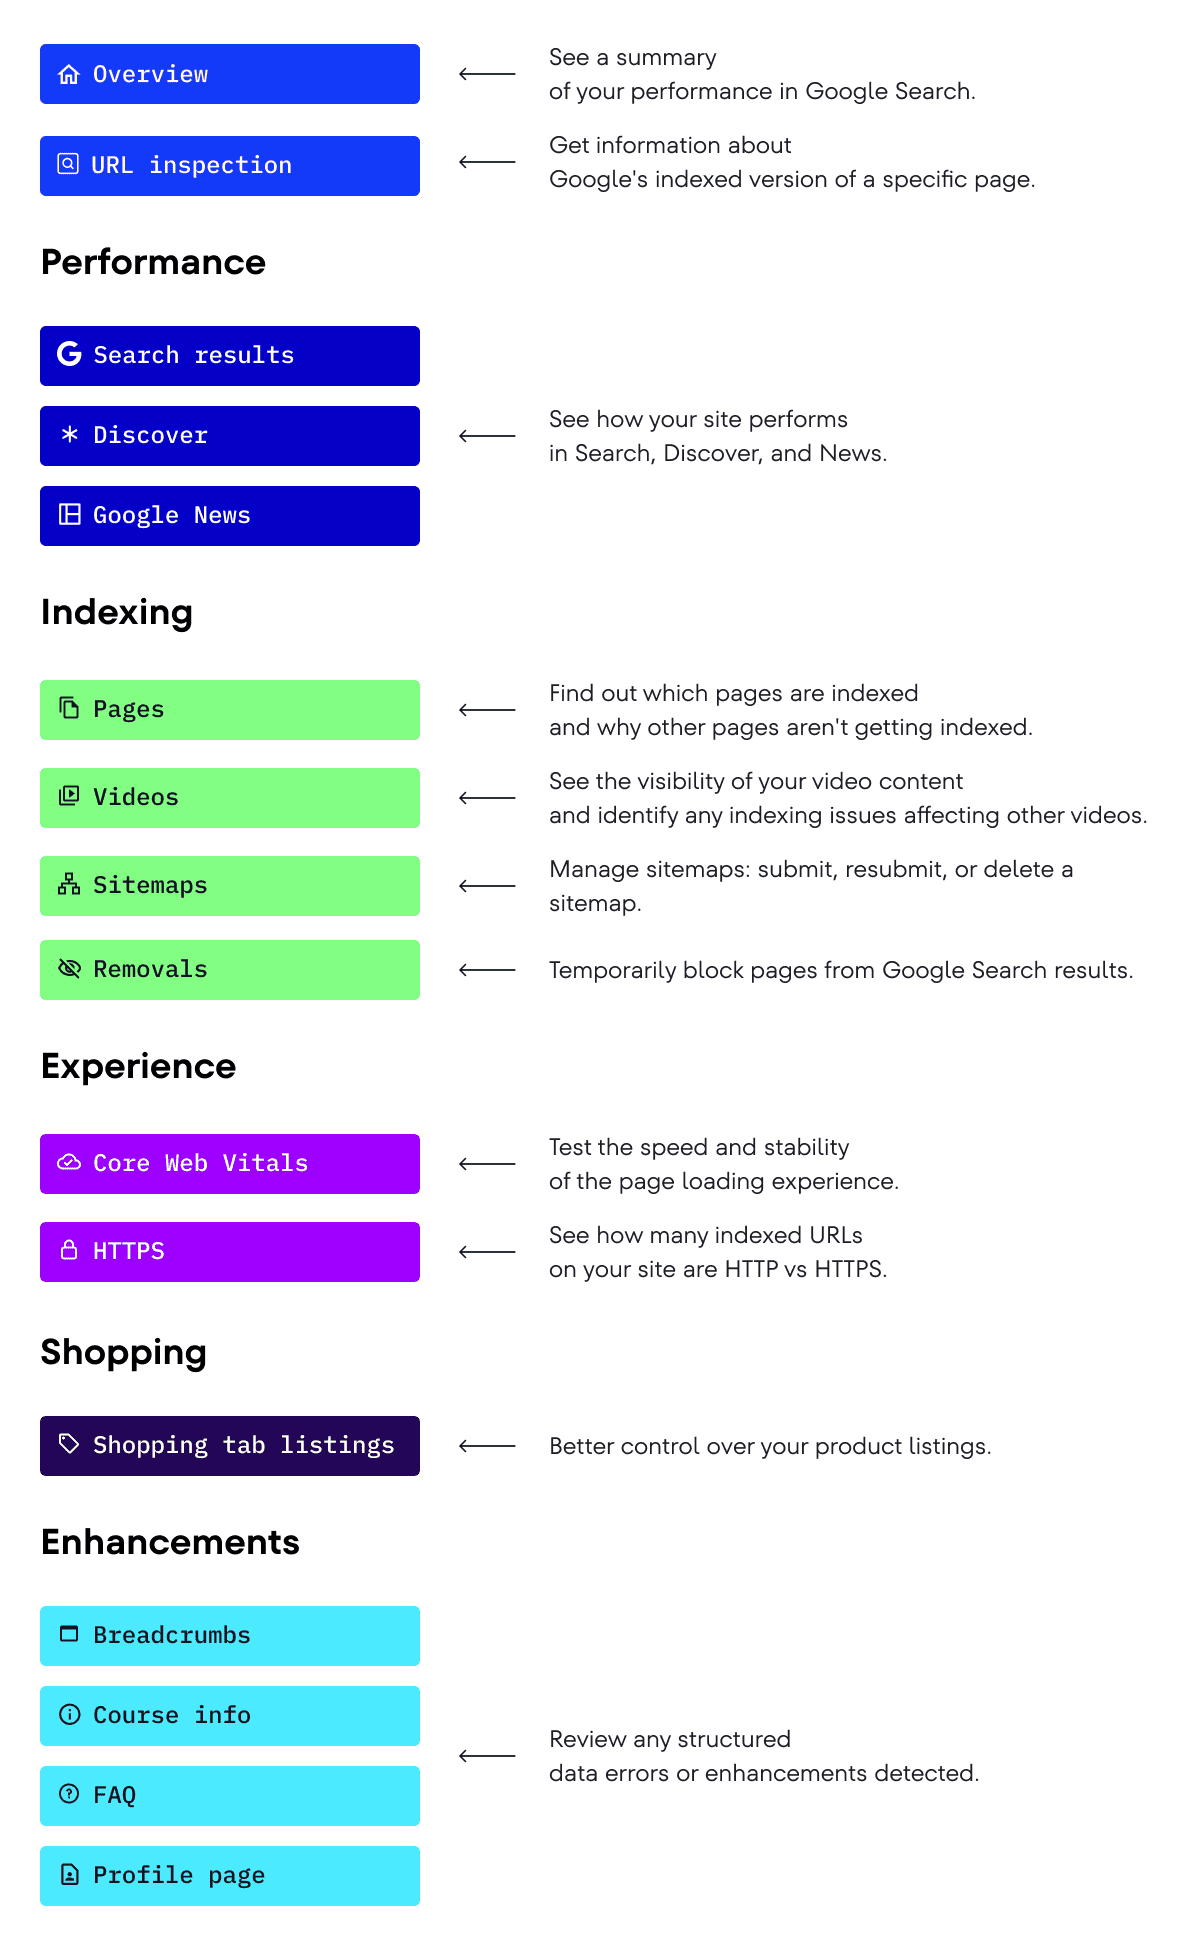
Now, let’s dive a little deeper into each tool.
Overview page
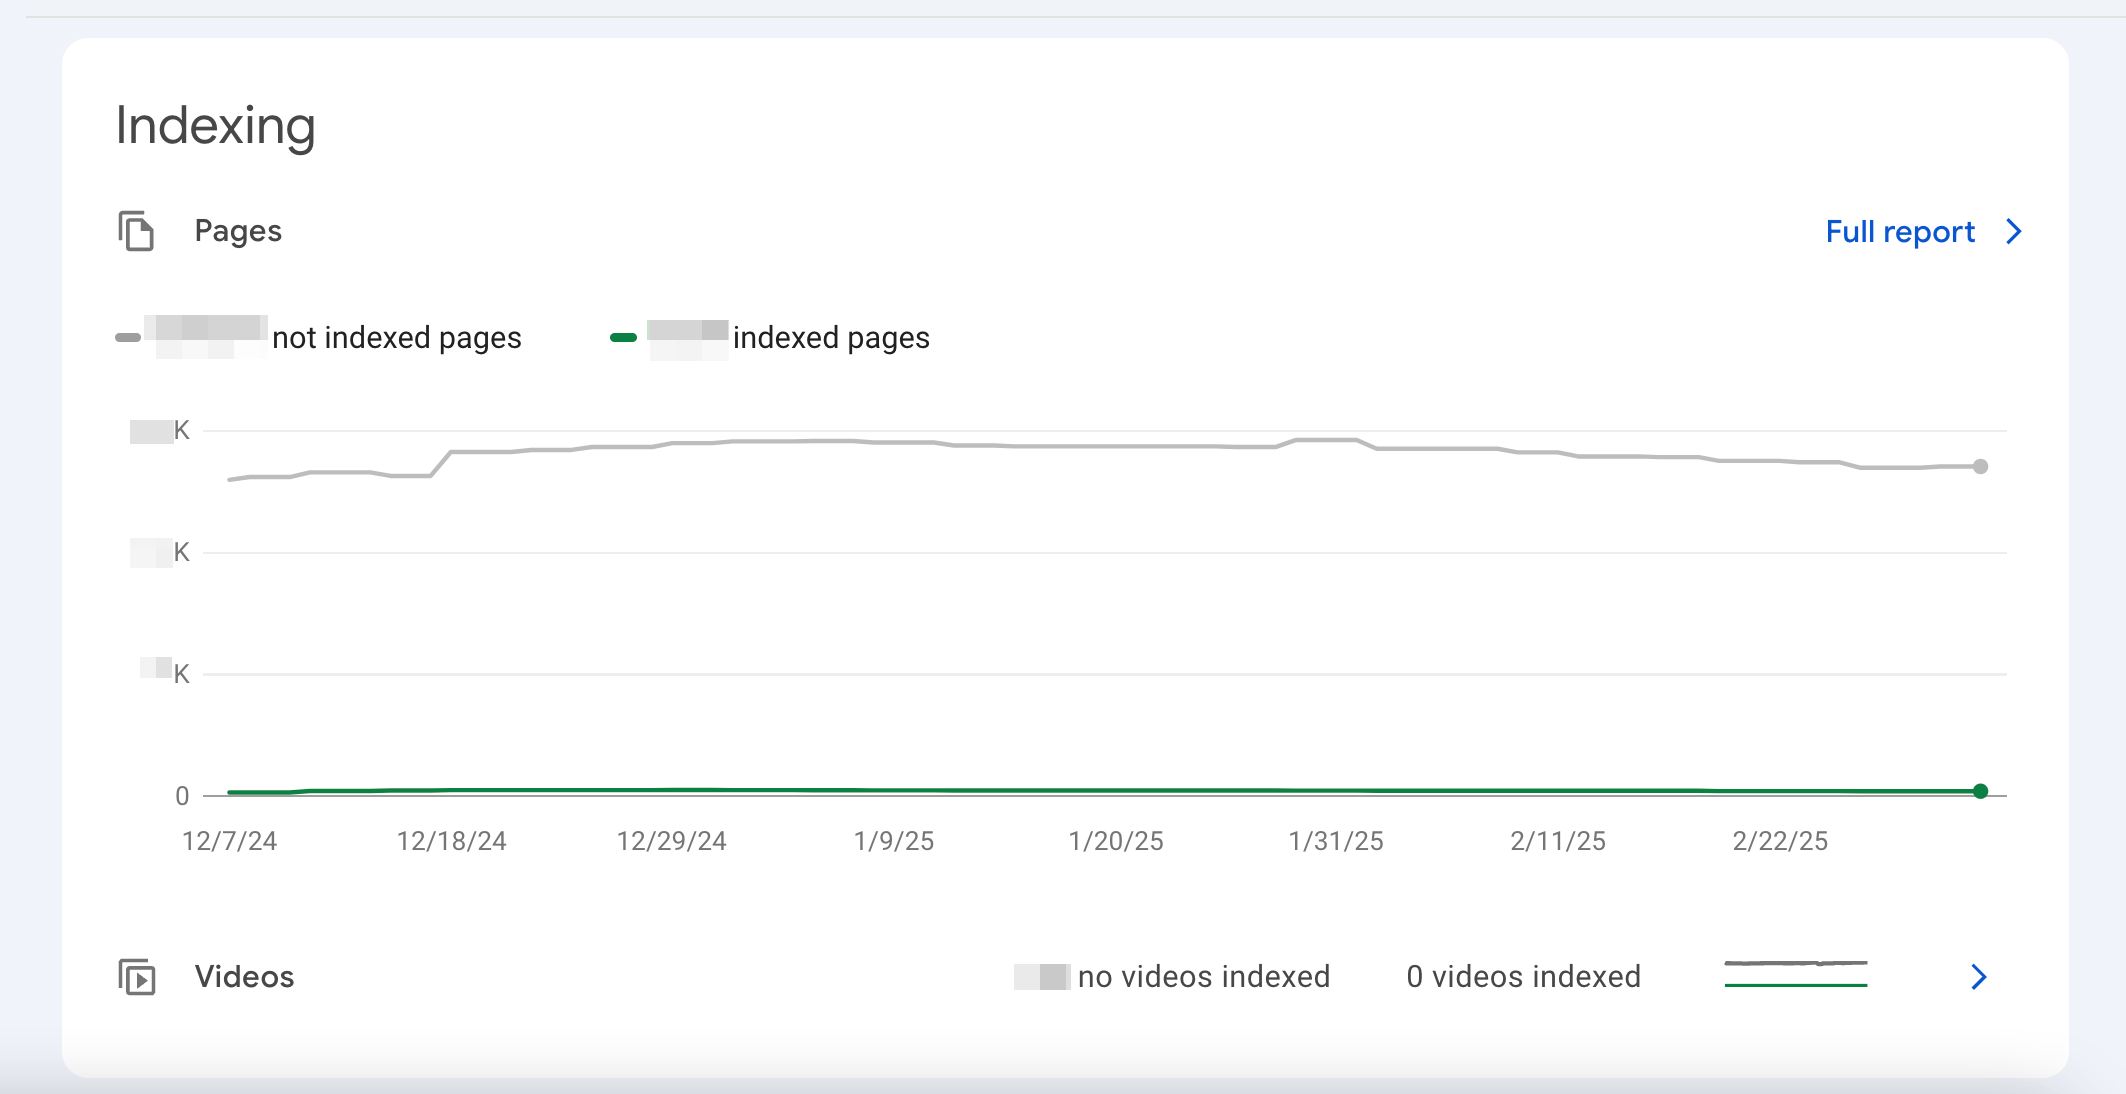
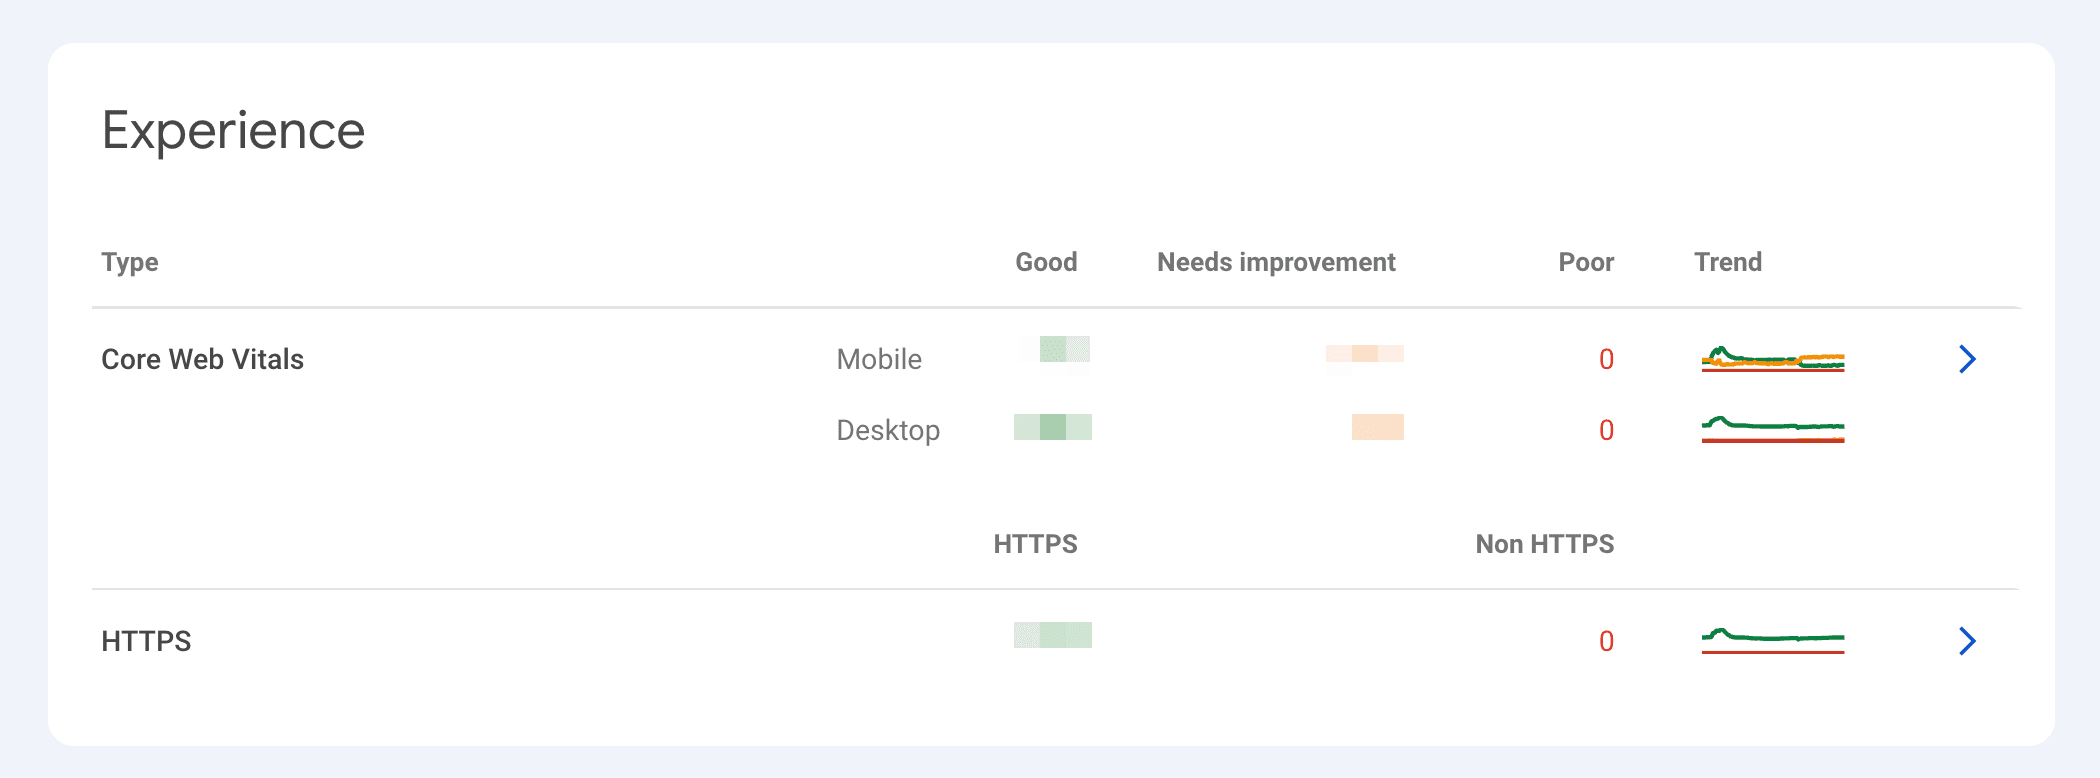
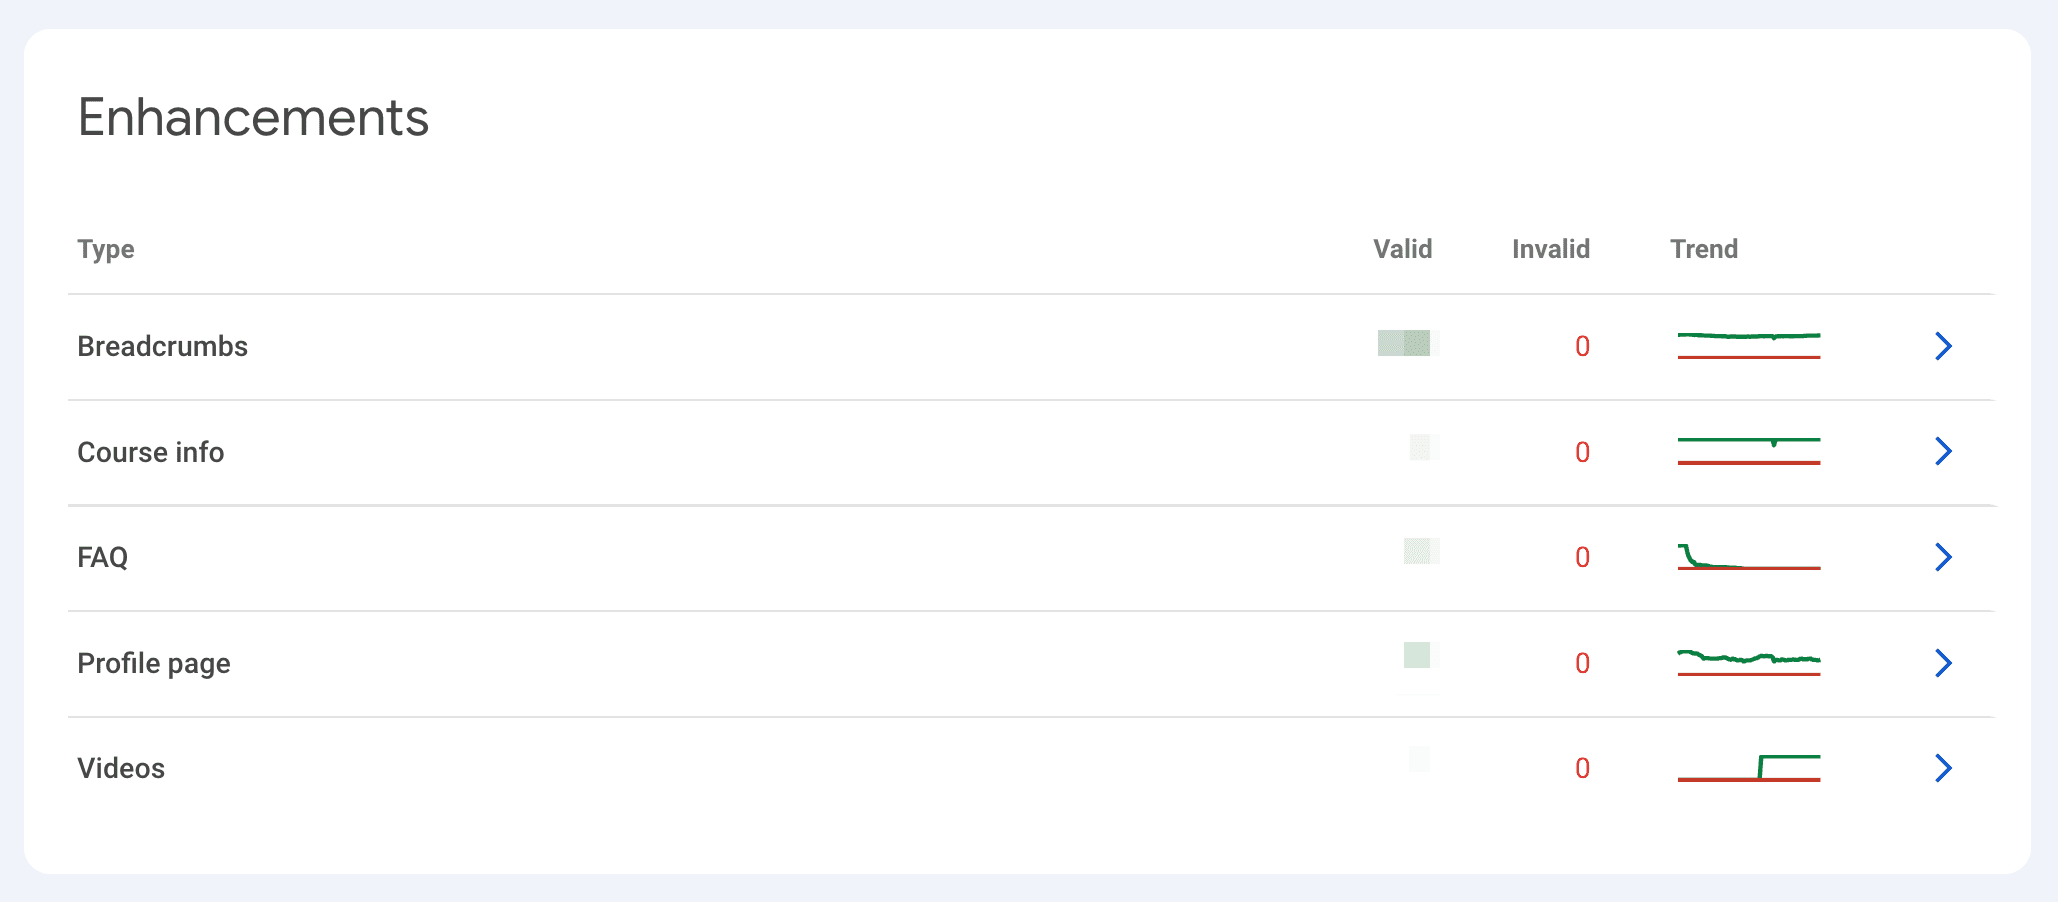
Google Search Console’s overview page includes charts with information on the website’s performance, indexing issues, and user experience figures. The overview page displays the four most important reports: Performance, Indexing, Experience, and Enhancements. After clicking Full report, users can see each of them in detail.
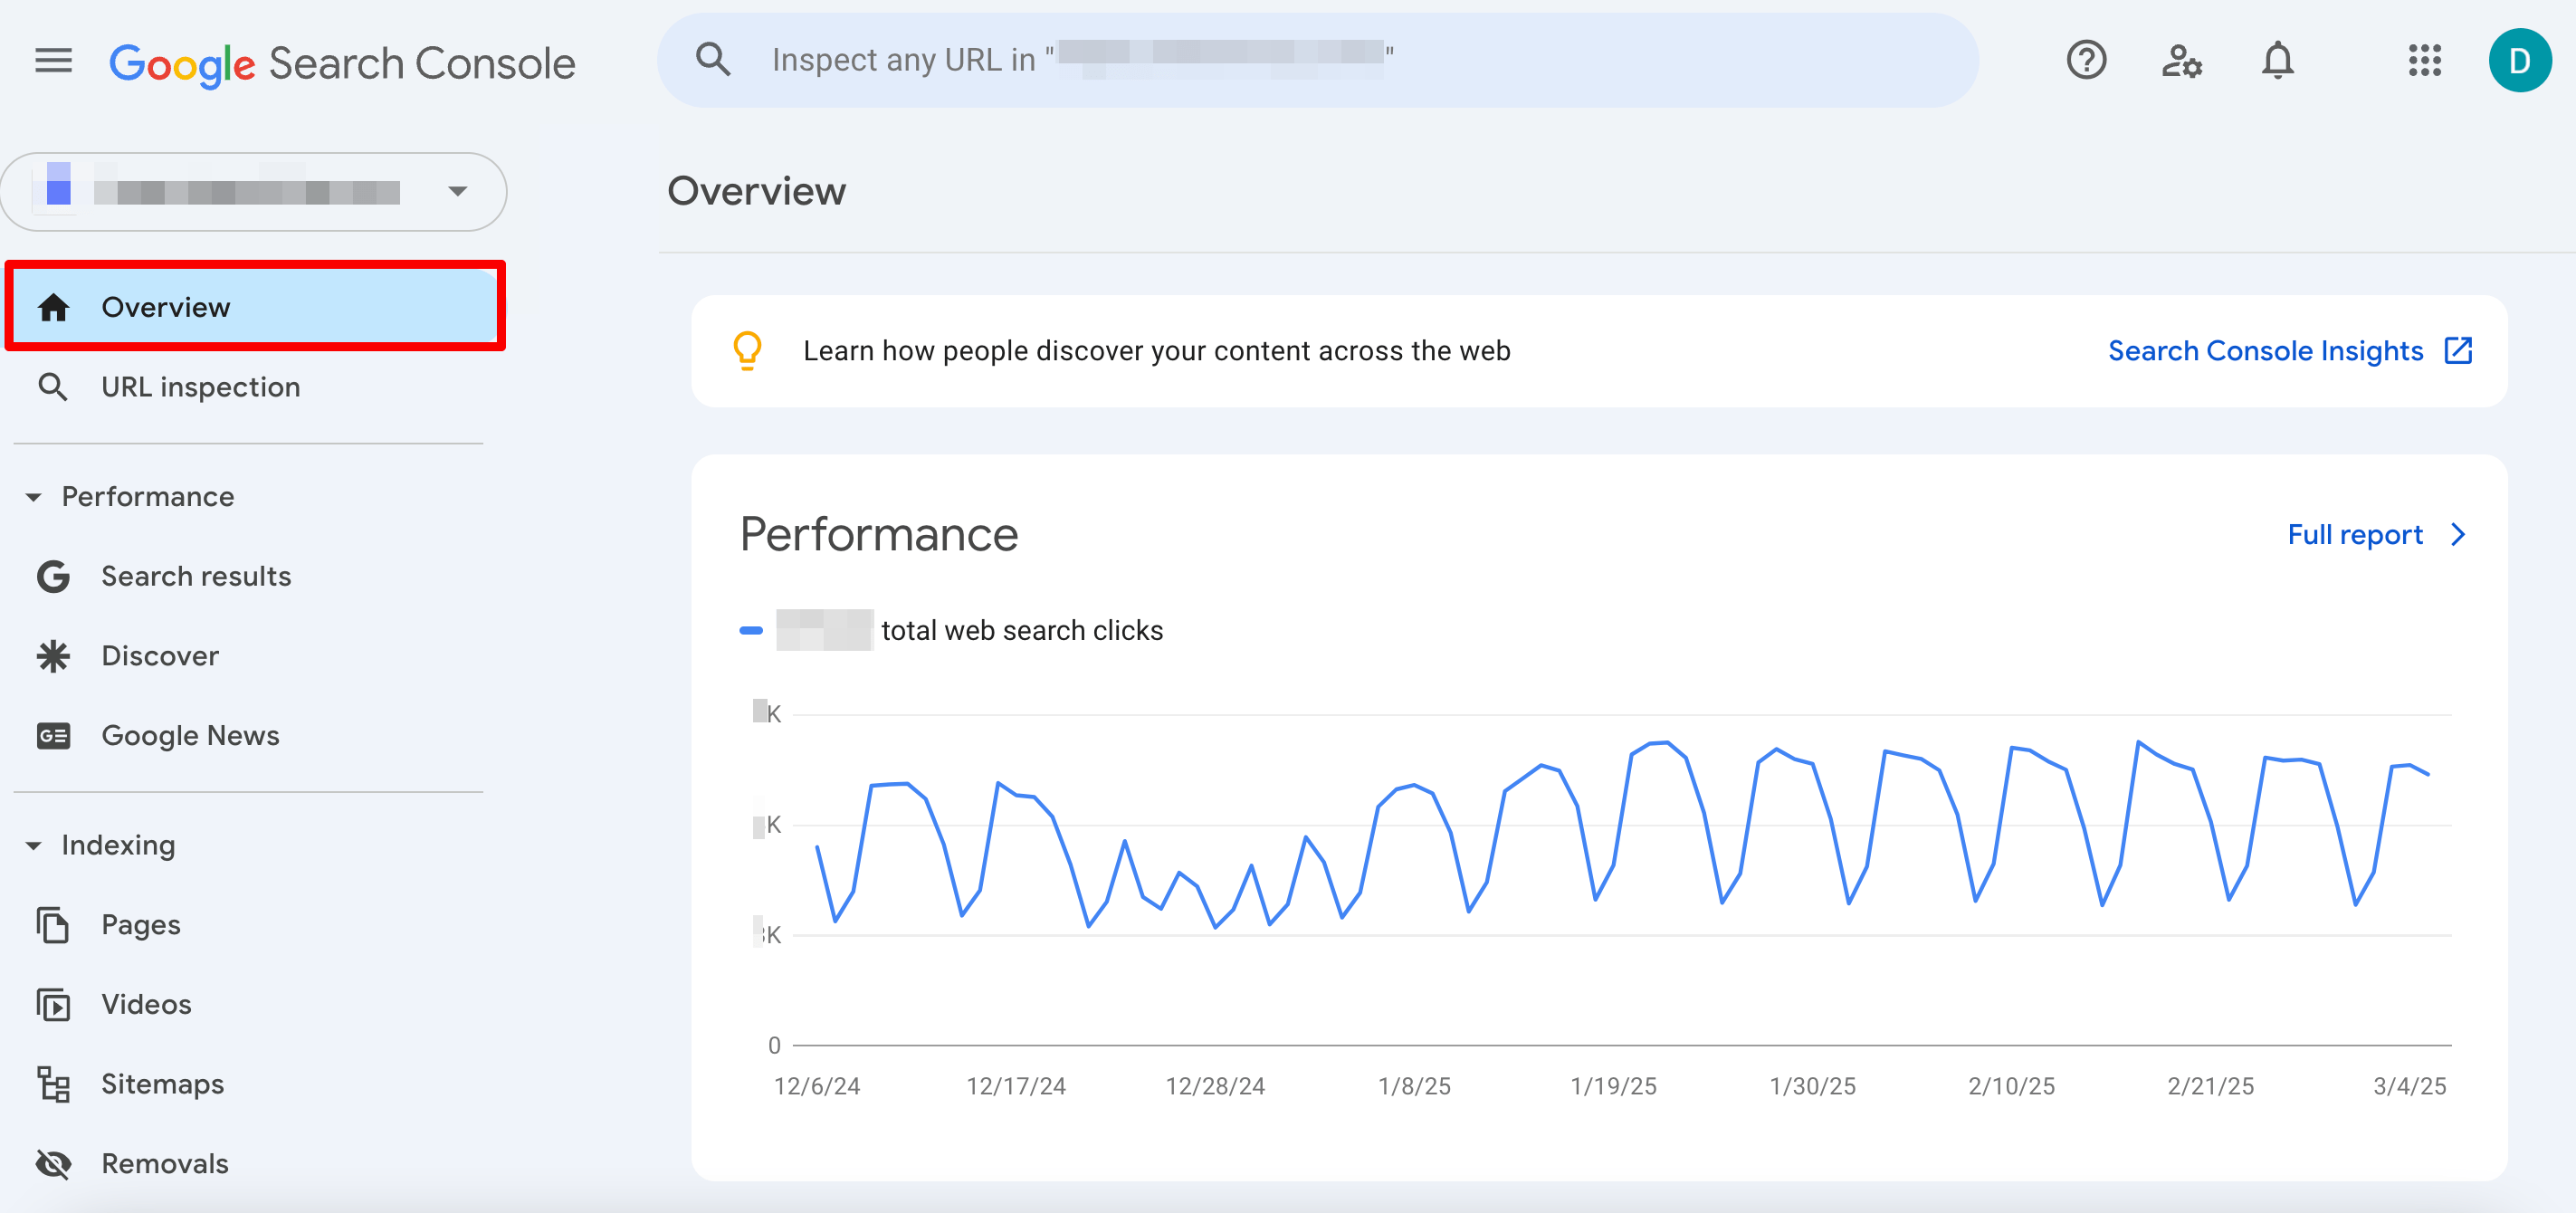
Also, pay attention to the Google Insights feature, which can be accessed by clicking the Search Console Insights button at the top of the Overview page.
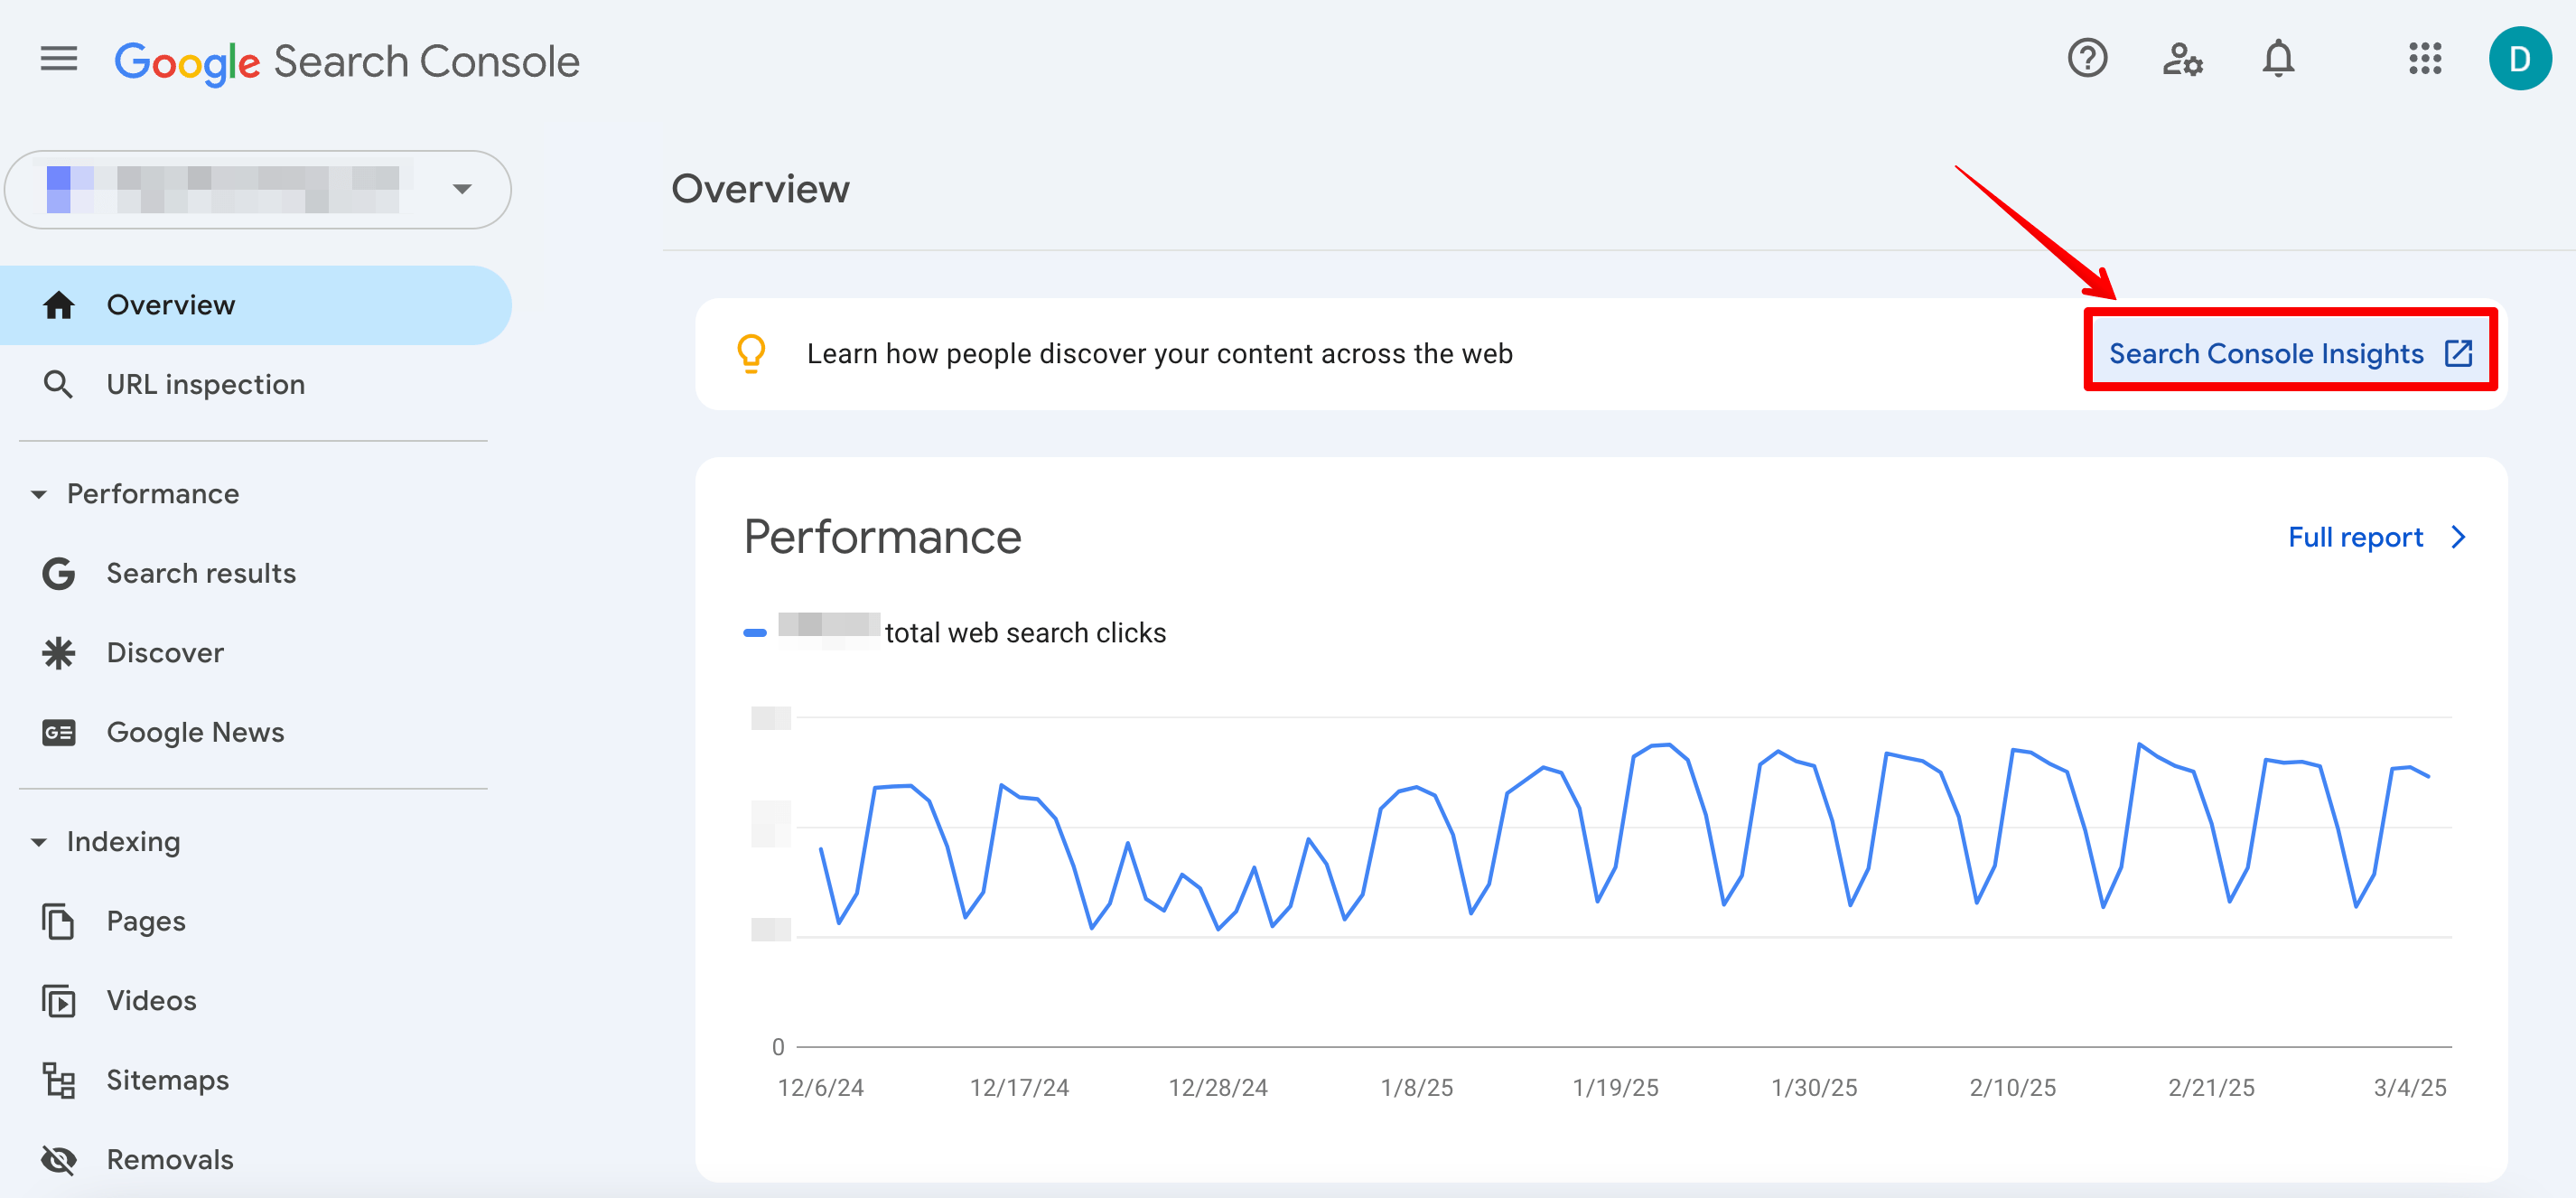
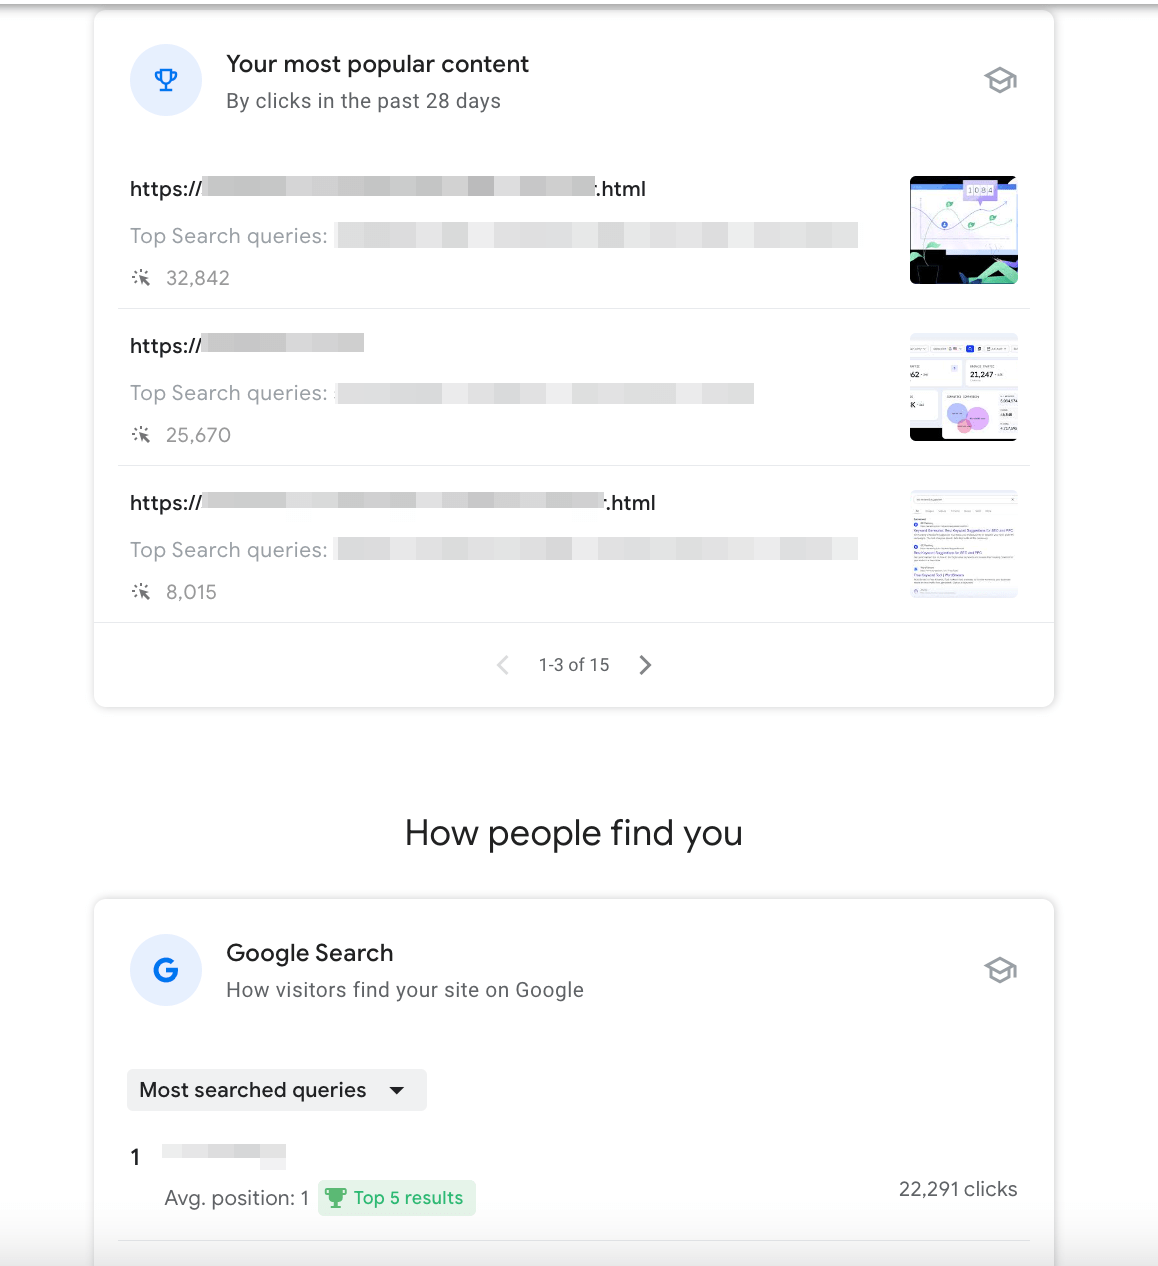
Use it to learn how audiences find your content and what resonates. Get a snapshot of your site’s overall performance on Google over the past 28 days, and an overview of the most searched queries, viral content, and your fastest-growing pages.
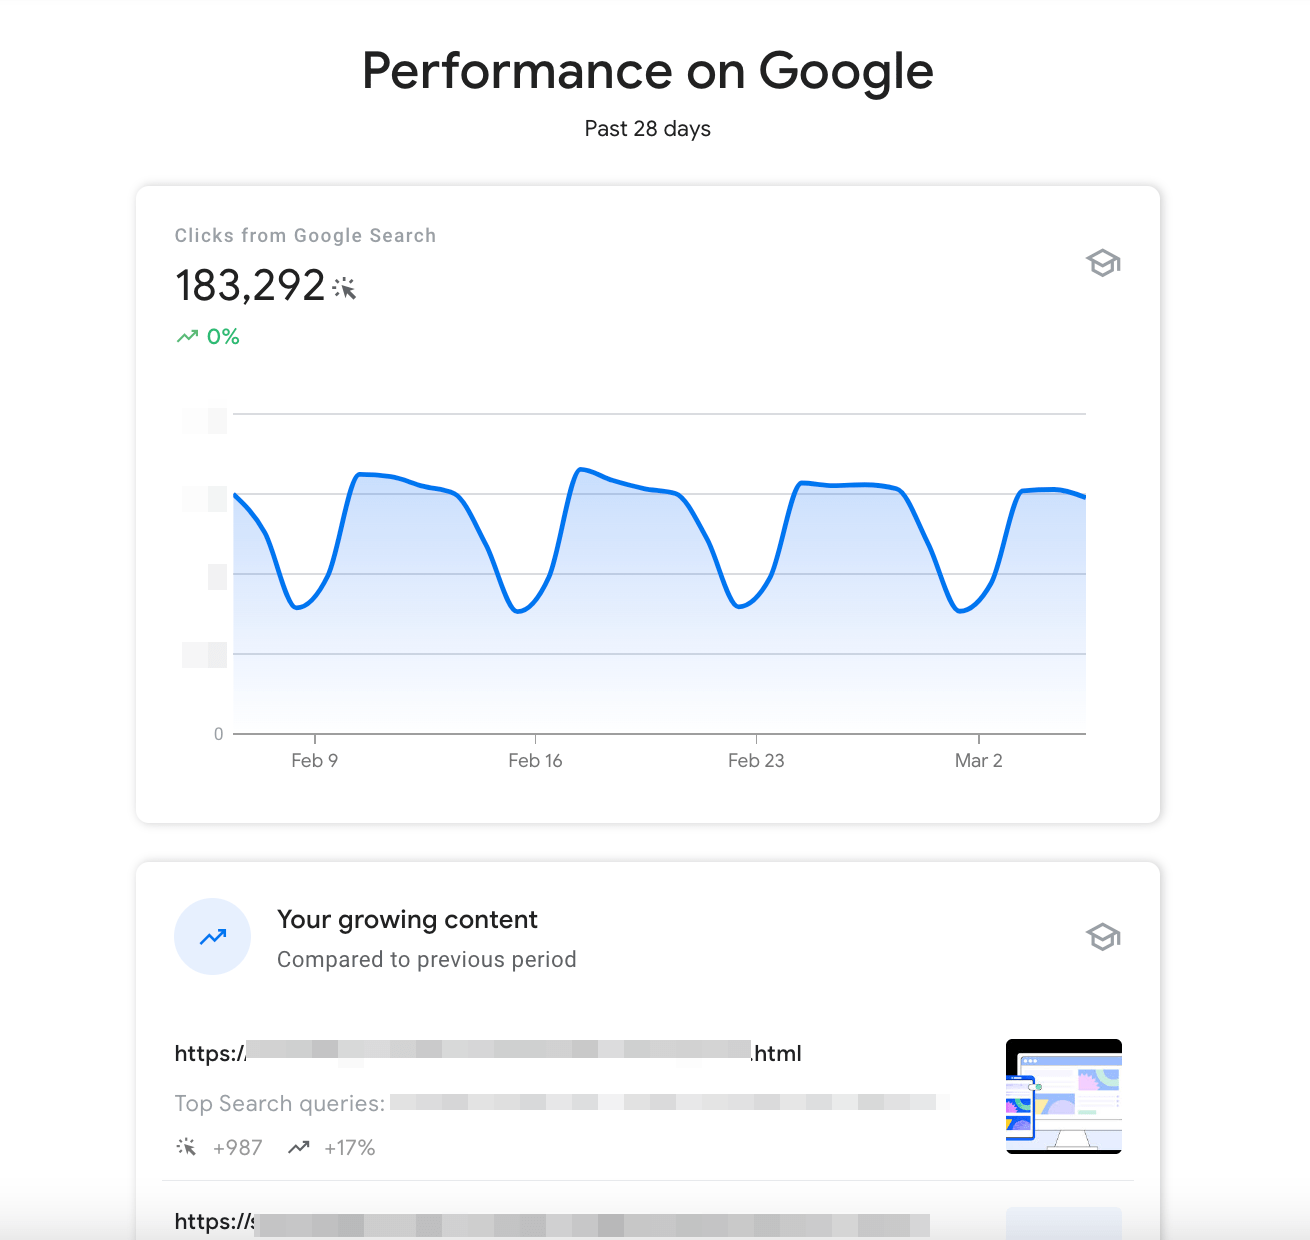
Depending on the section, you’ll see clicks, average position, growth percentage, and other metrics besides pages or keywords, making analysis clearer and more thorough.
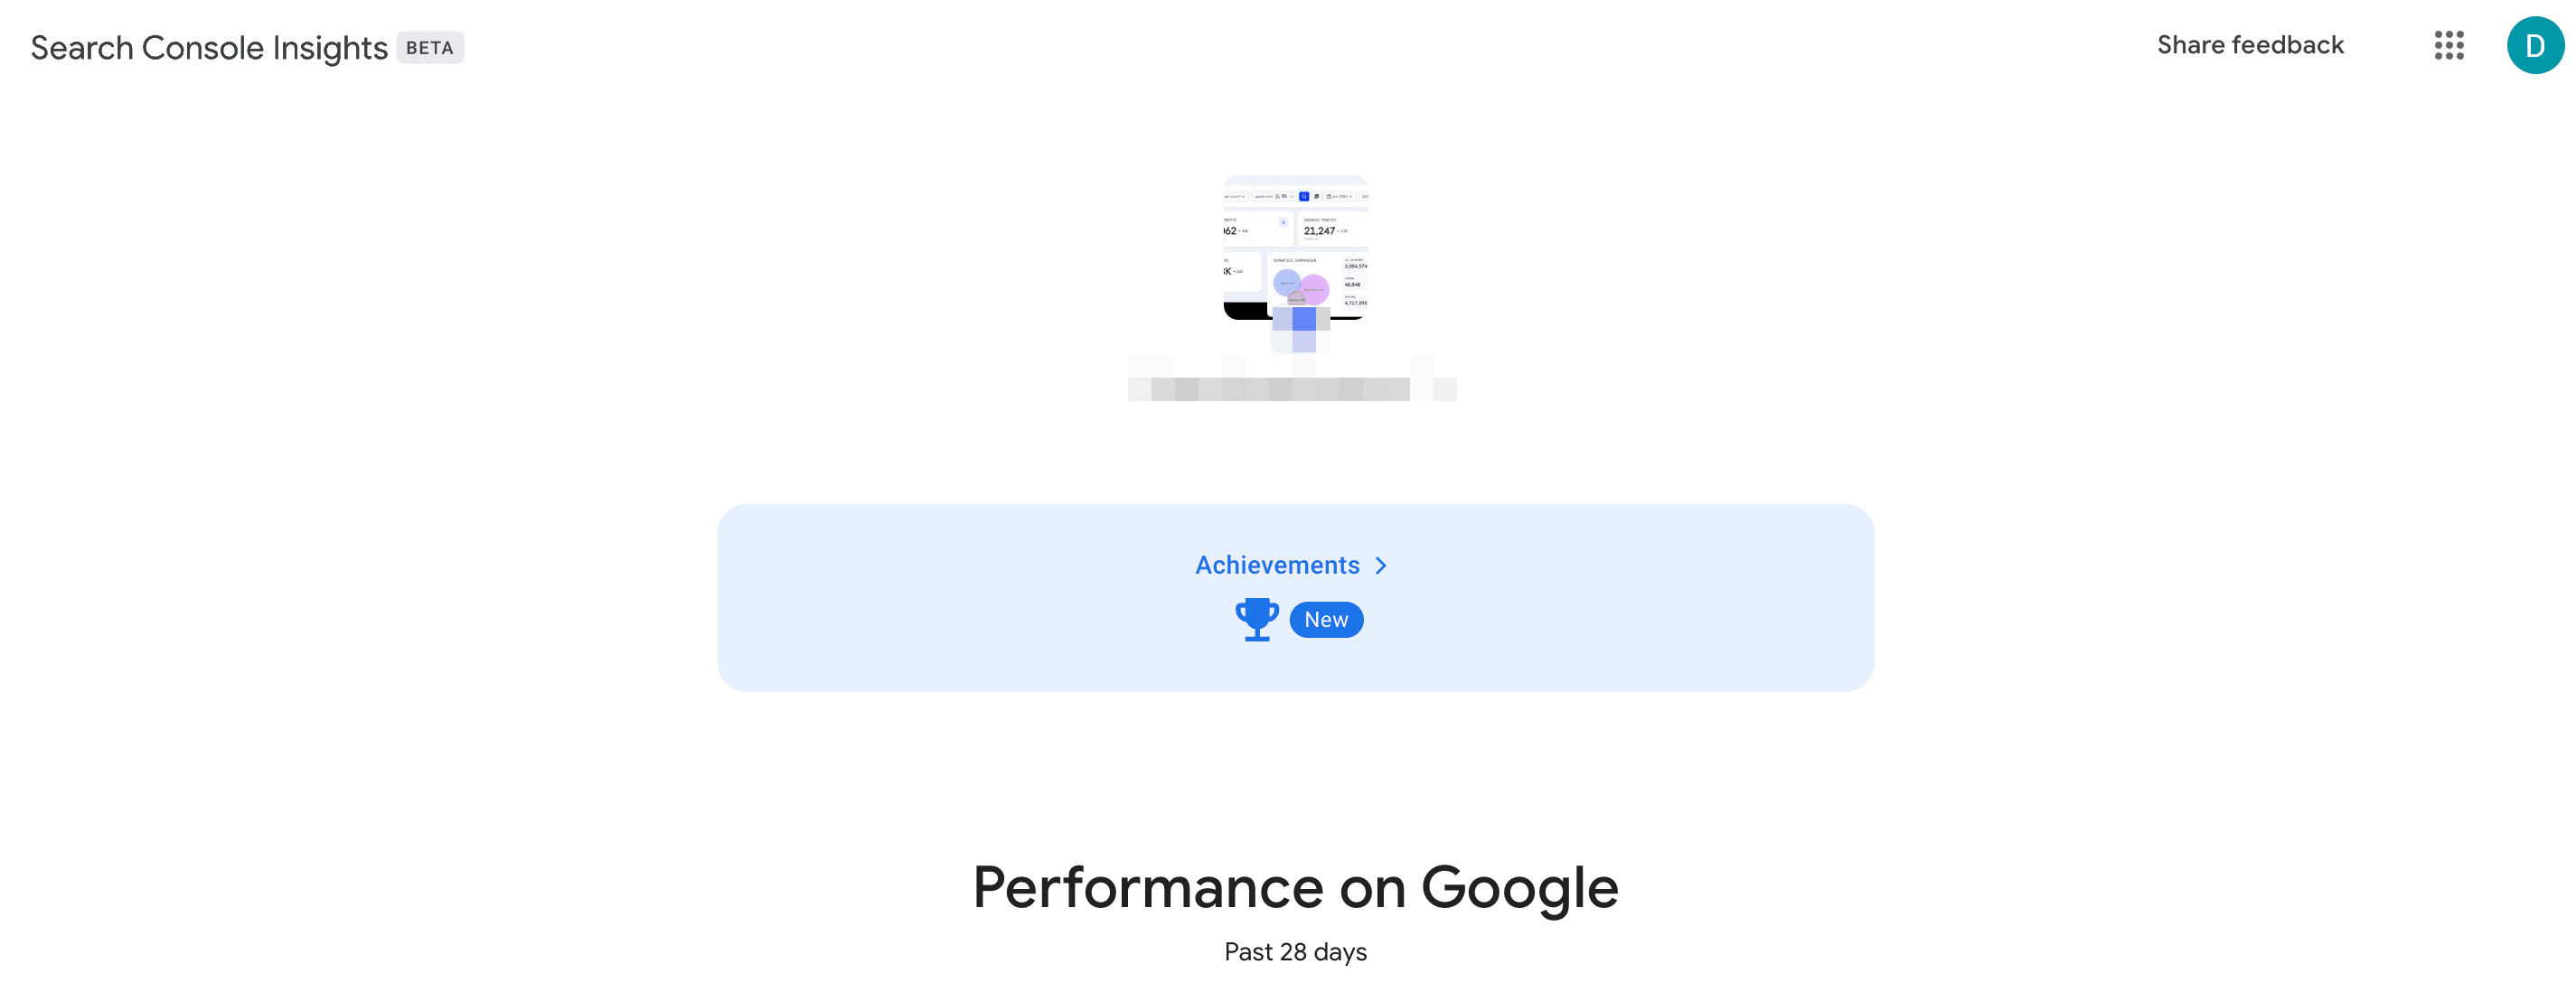
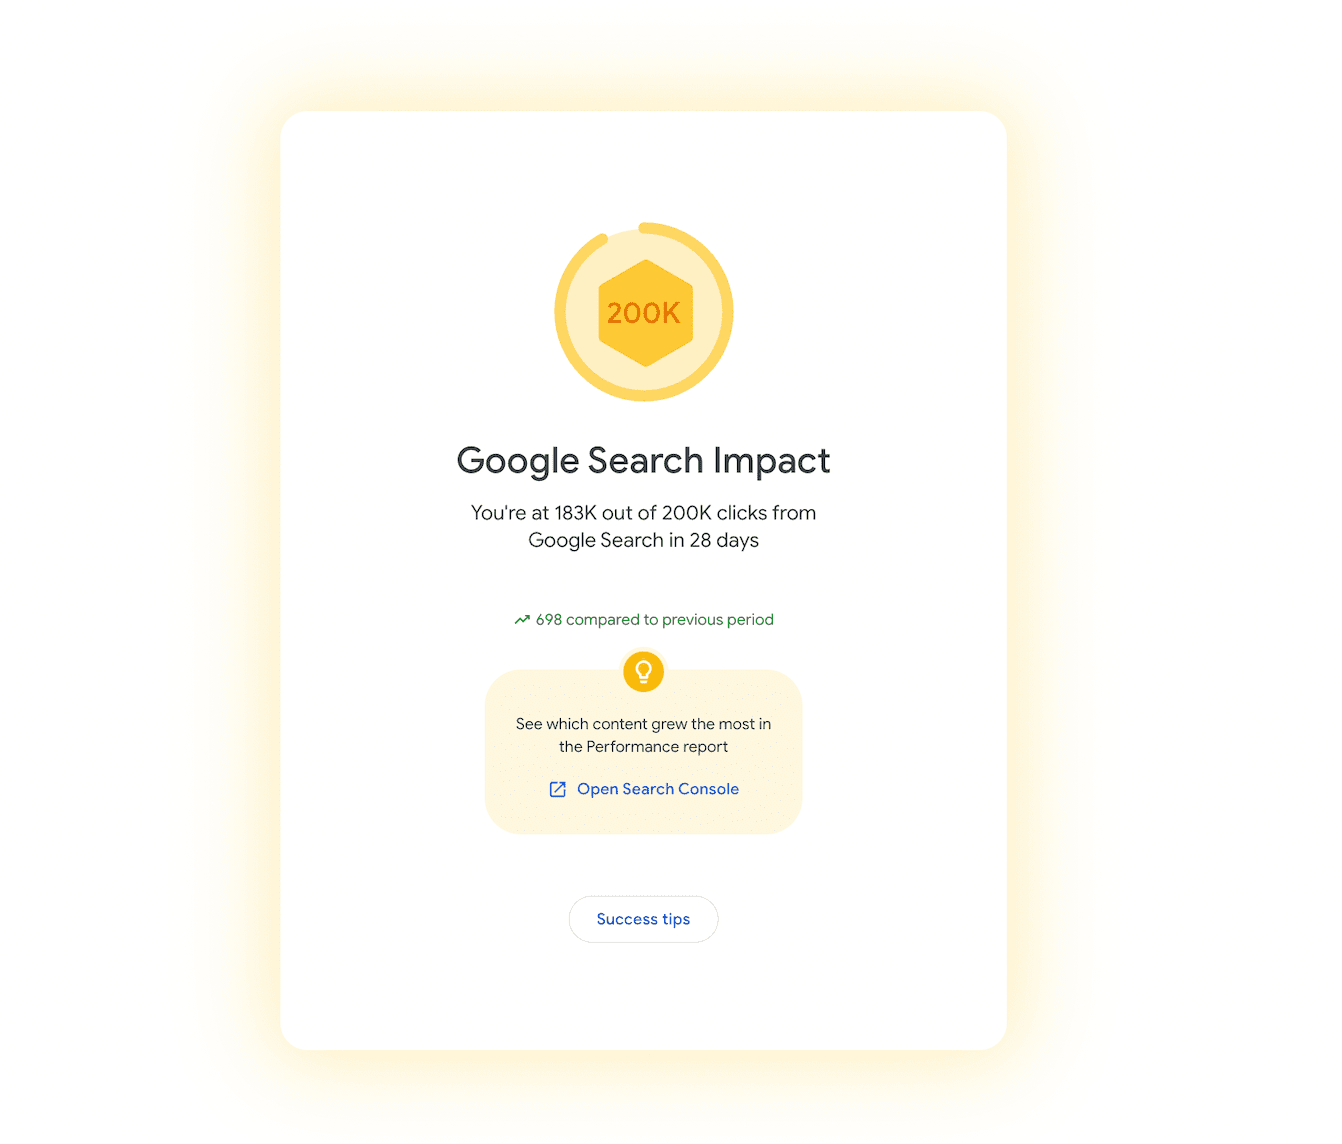
The Achievements section can be found at the top of these charts. Click on it to track your progress.
Google will analyze your site data as far back as 2019, depending on when your Google Search Console property was verified. It also shows site-click achievements, which are fun but not designed to reflect how Google’s ranking system works.
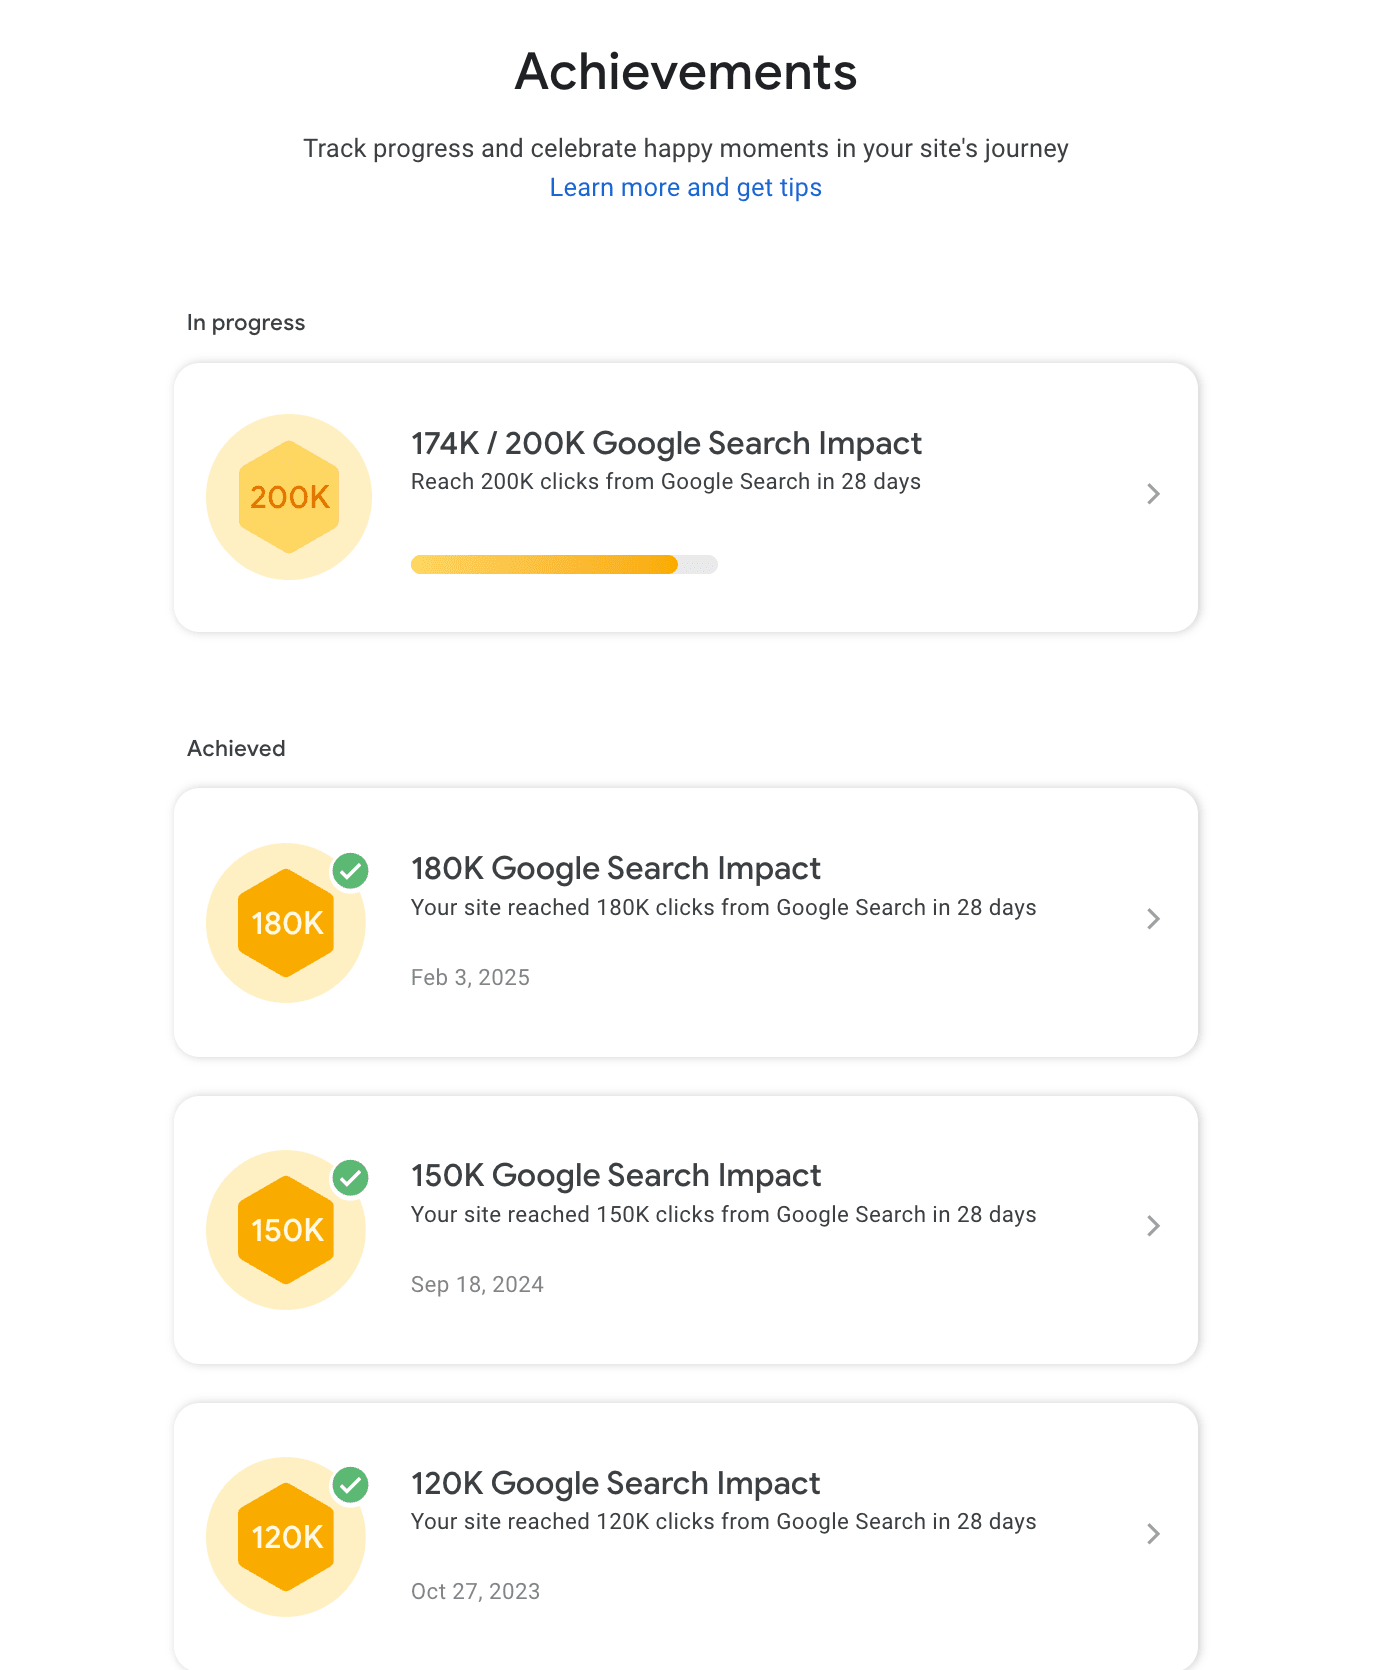
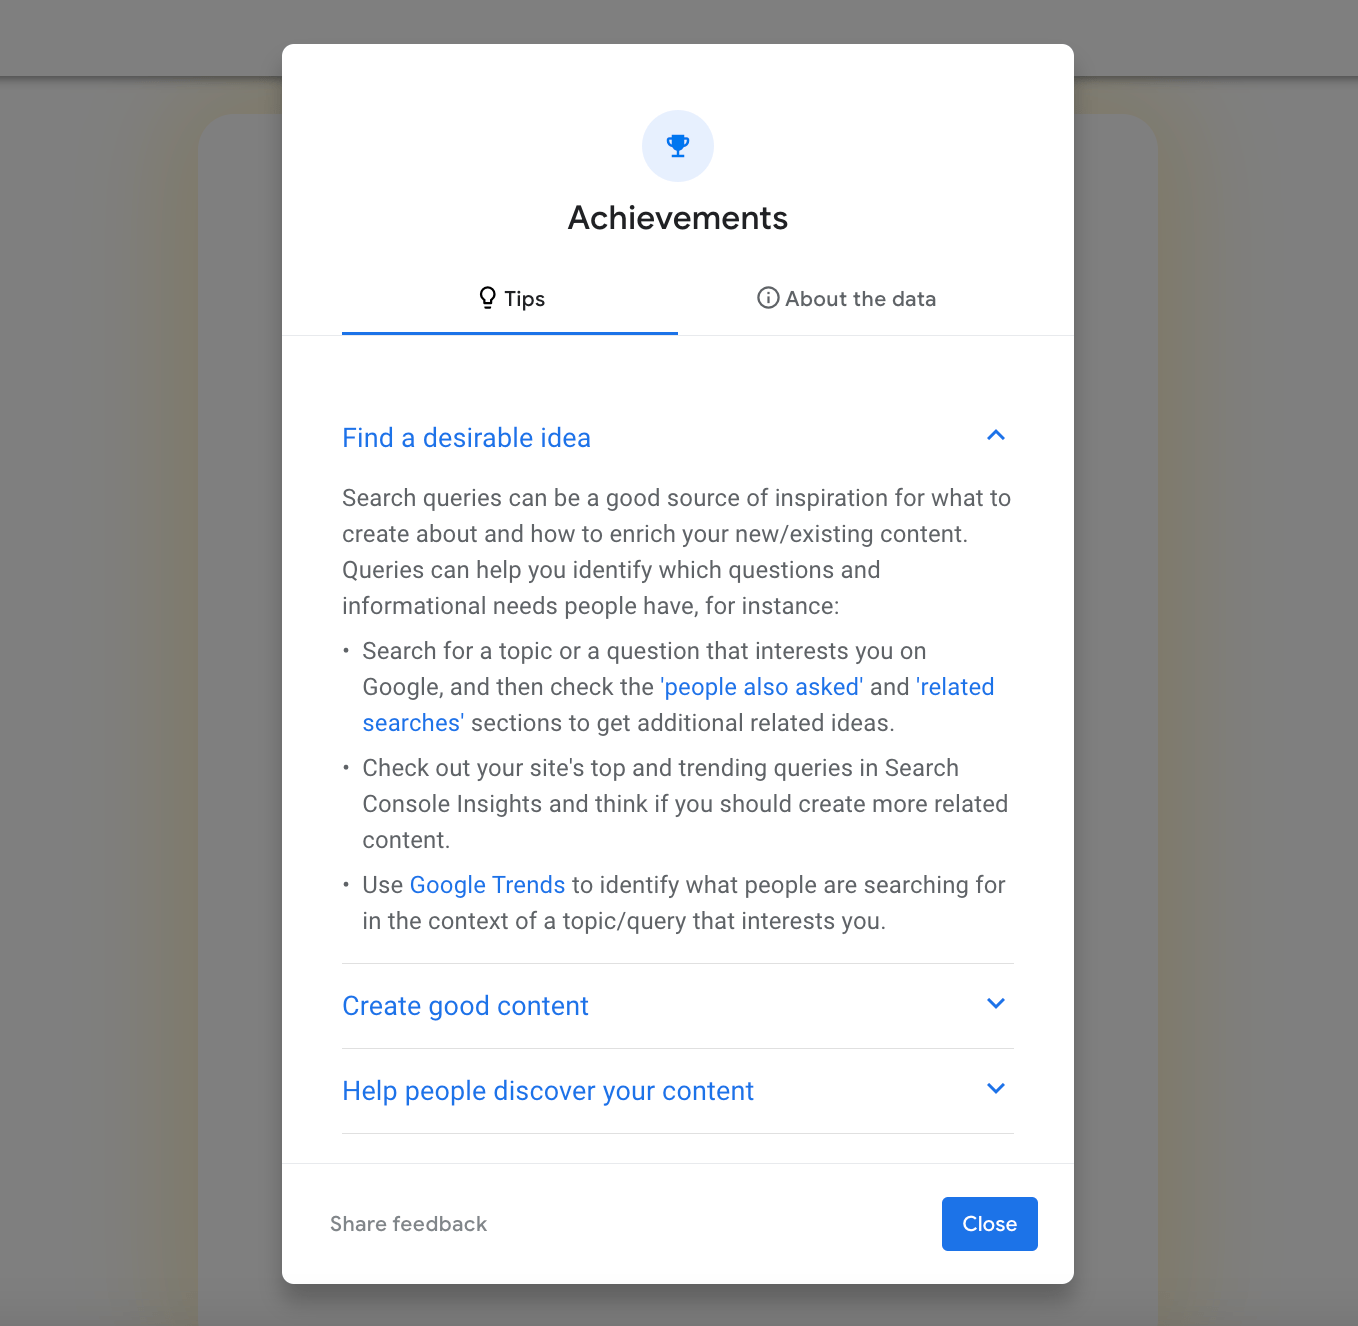
Clicking on a goal with the status In progress takes you to a page with a detailed report and Success tips.
URL Inspection tool
The URL Inspection tool offers insights into how Google sees each URL on your site. To find out if a page is still visible in search results, you can check it manually. Just insert the URL into the search bar in the Google Search Console.
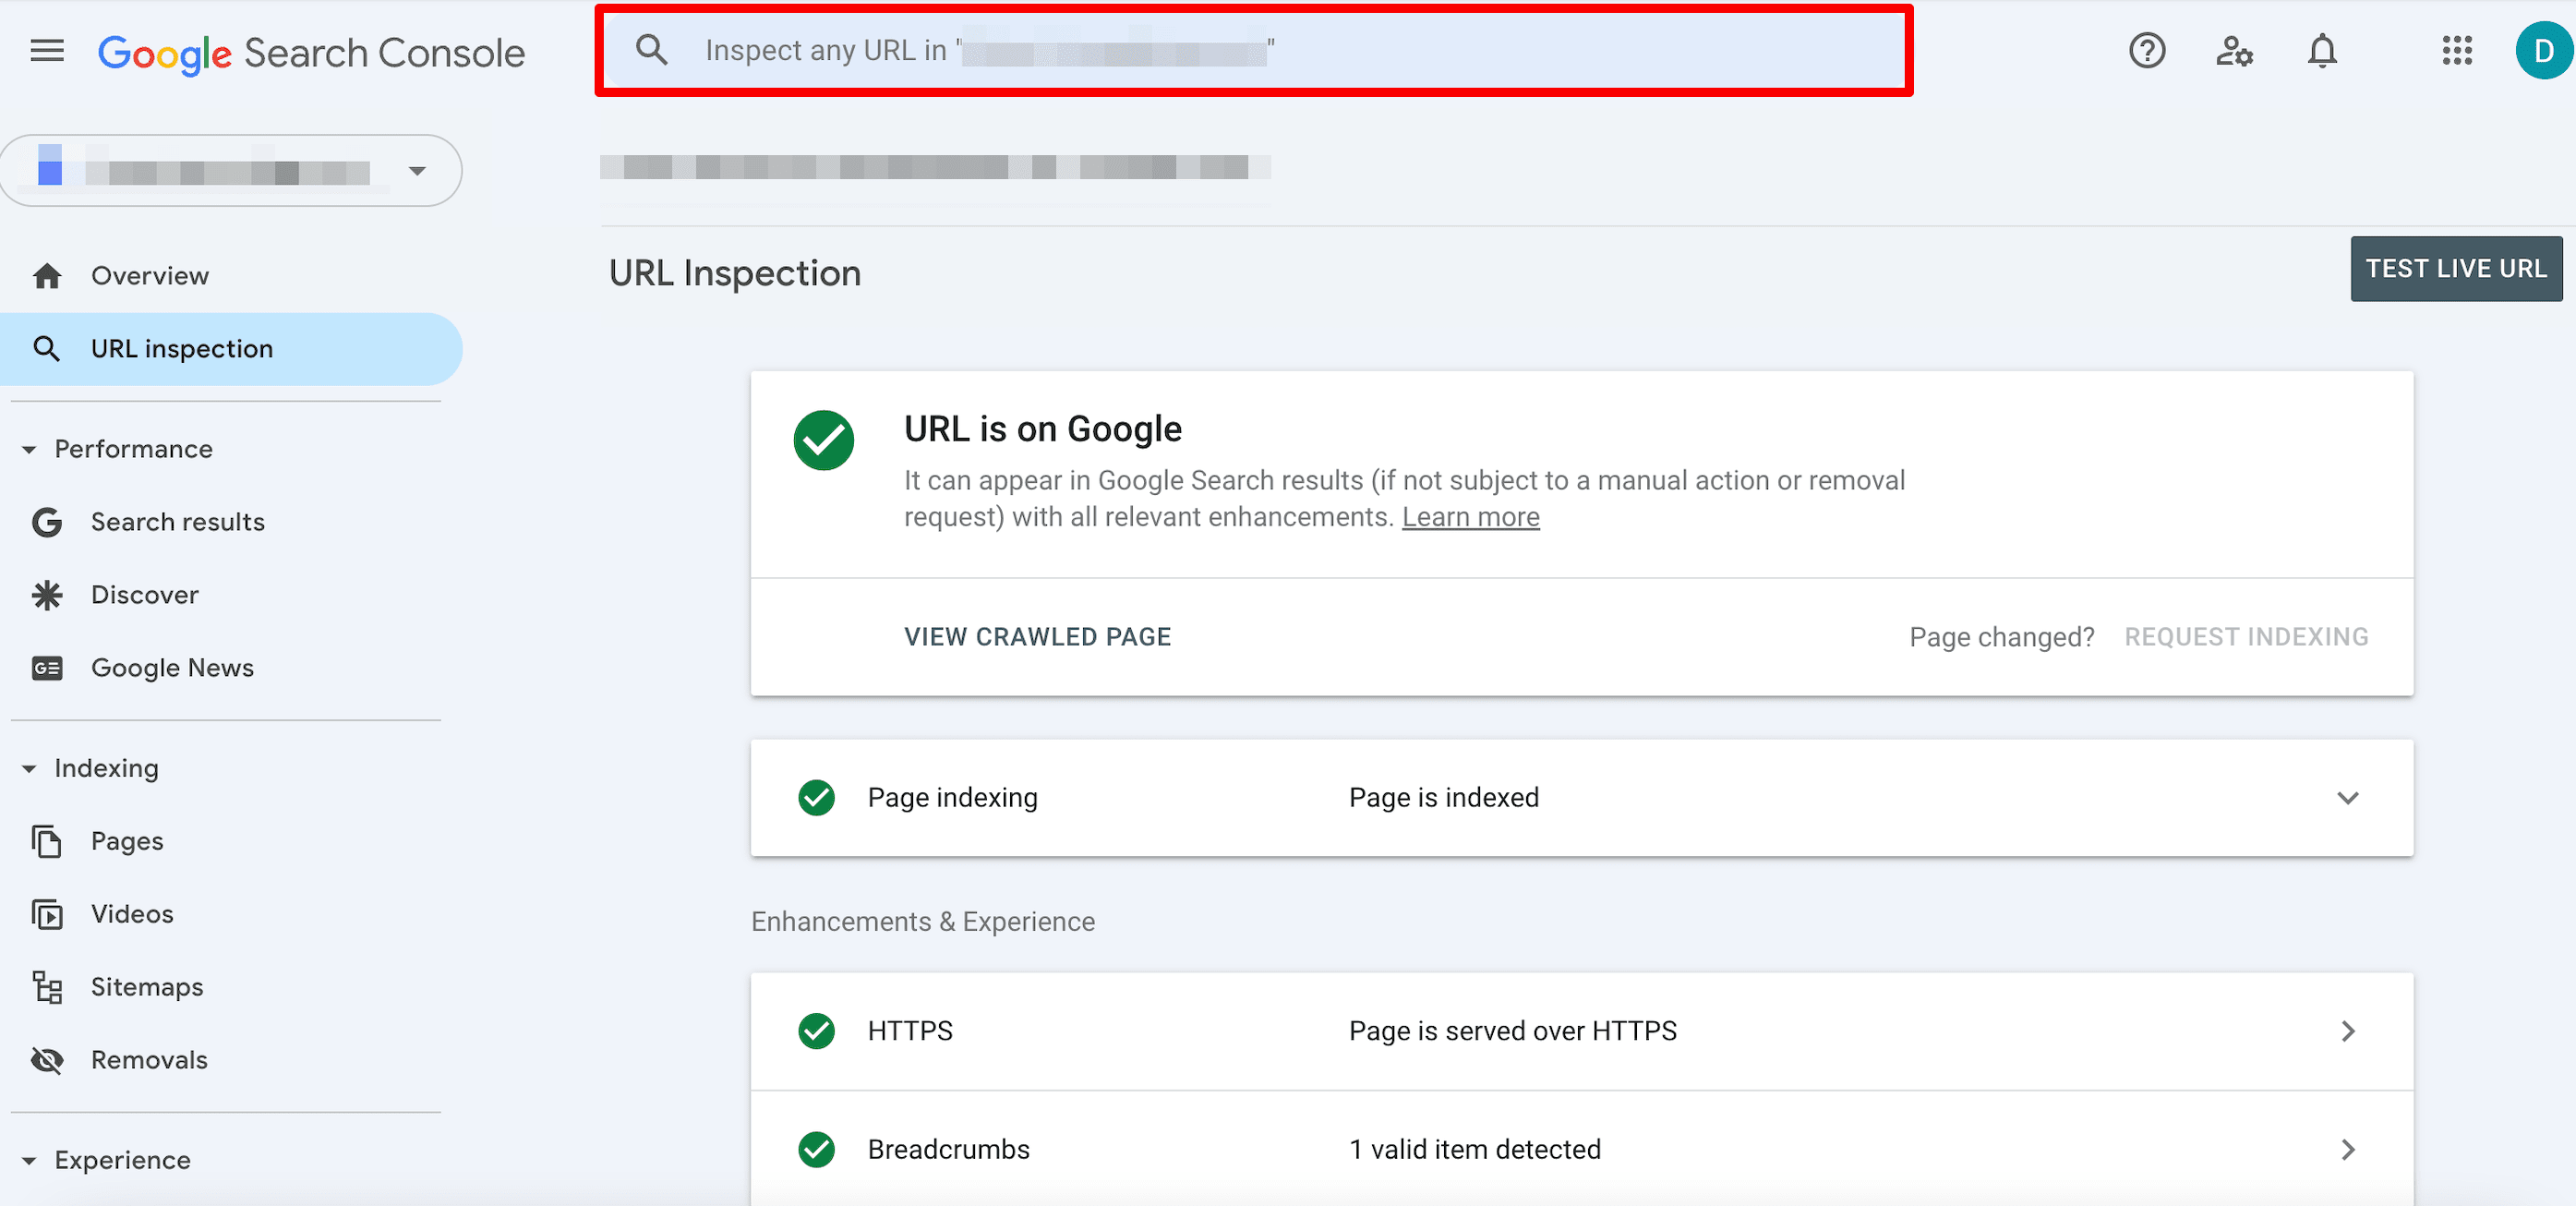
Here’s what you can do with this tool:
- See the current index status of a URL. The tool can also help you find out why pages aren’t indexed. It also lets you find more information about indexed pages by providing data on their sitemaps and canonical data.
- Review the latest crawl details and referring pages. This is how to find out where Google found specific links.
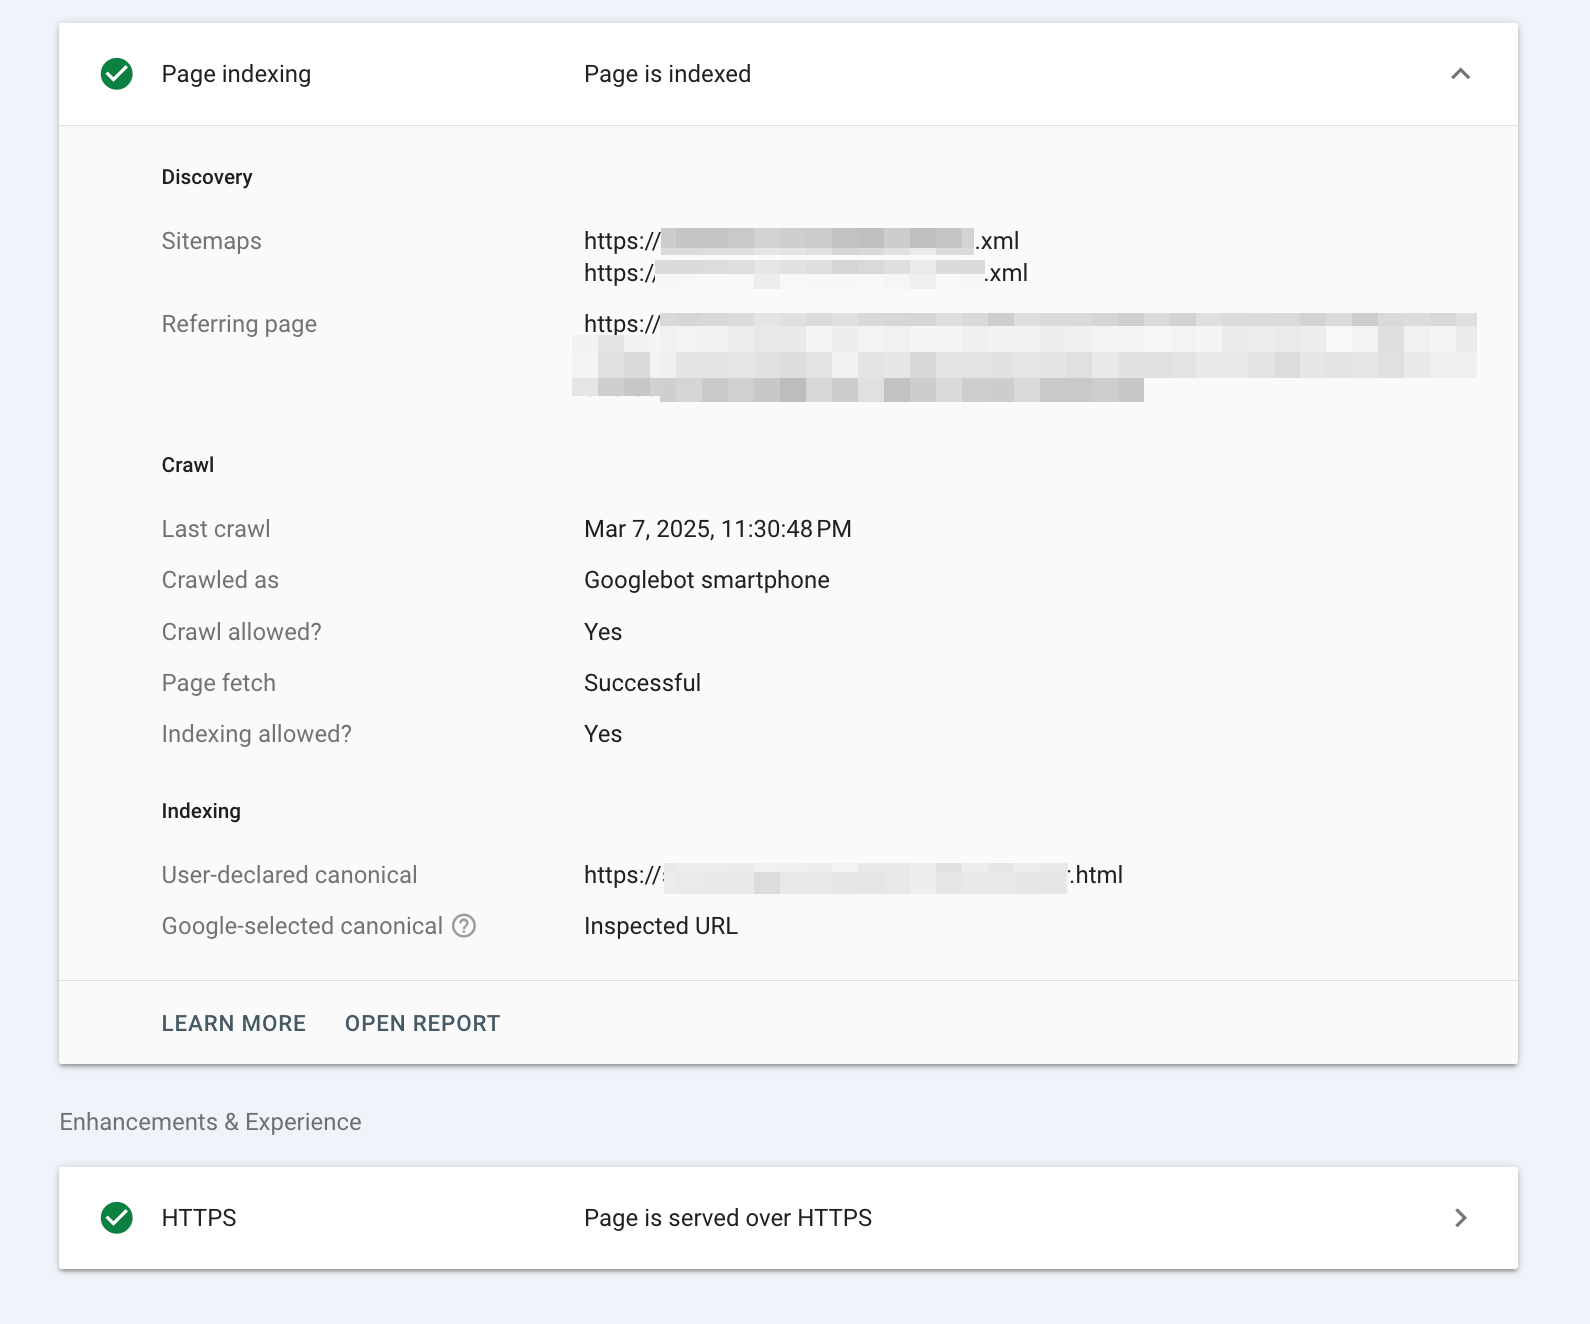
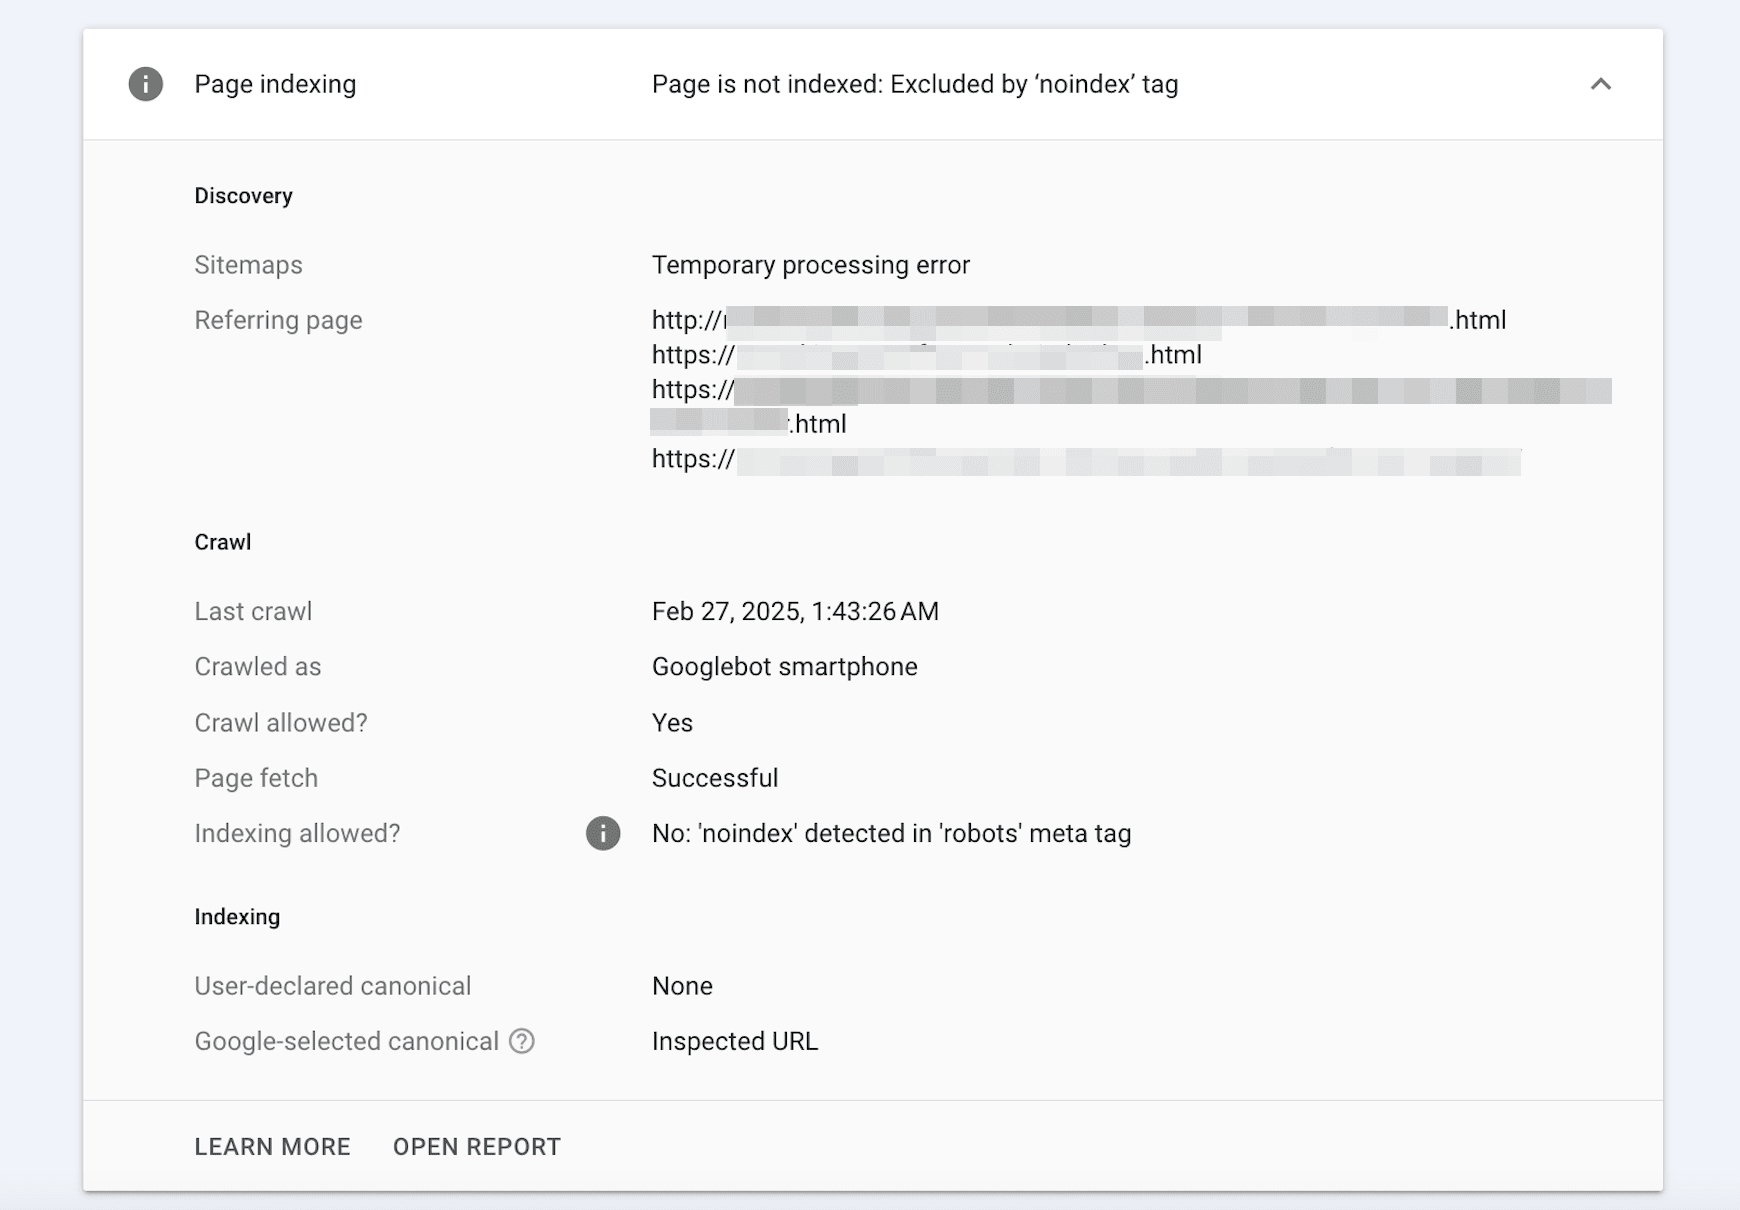
- Request page indexing or re-indexing by Google.
- Get screenshots of how Googlebot sees certain pages.
- View page code.
- Check if your page is served over HTTPS.
- Verify whether your page appears in rich results.
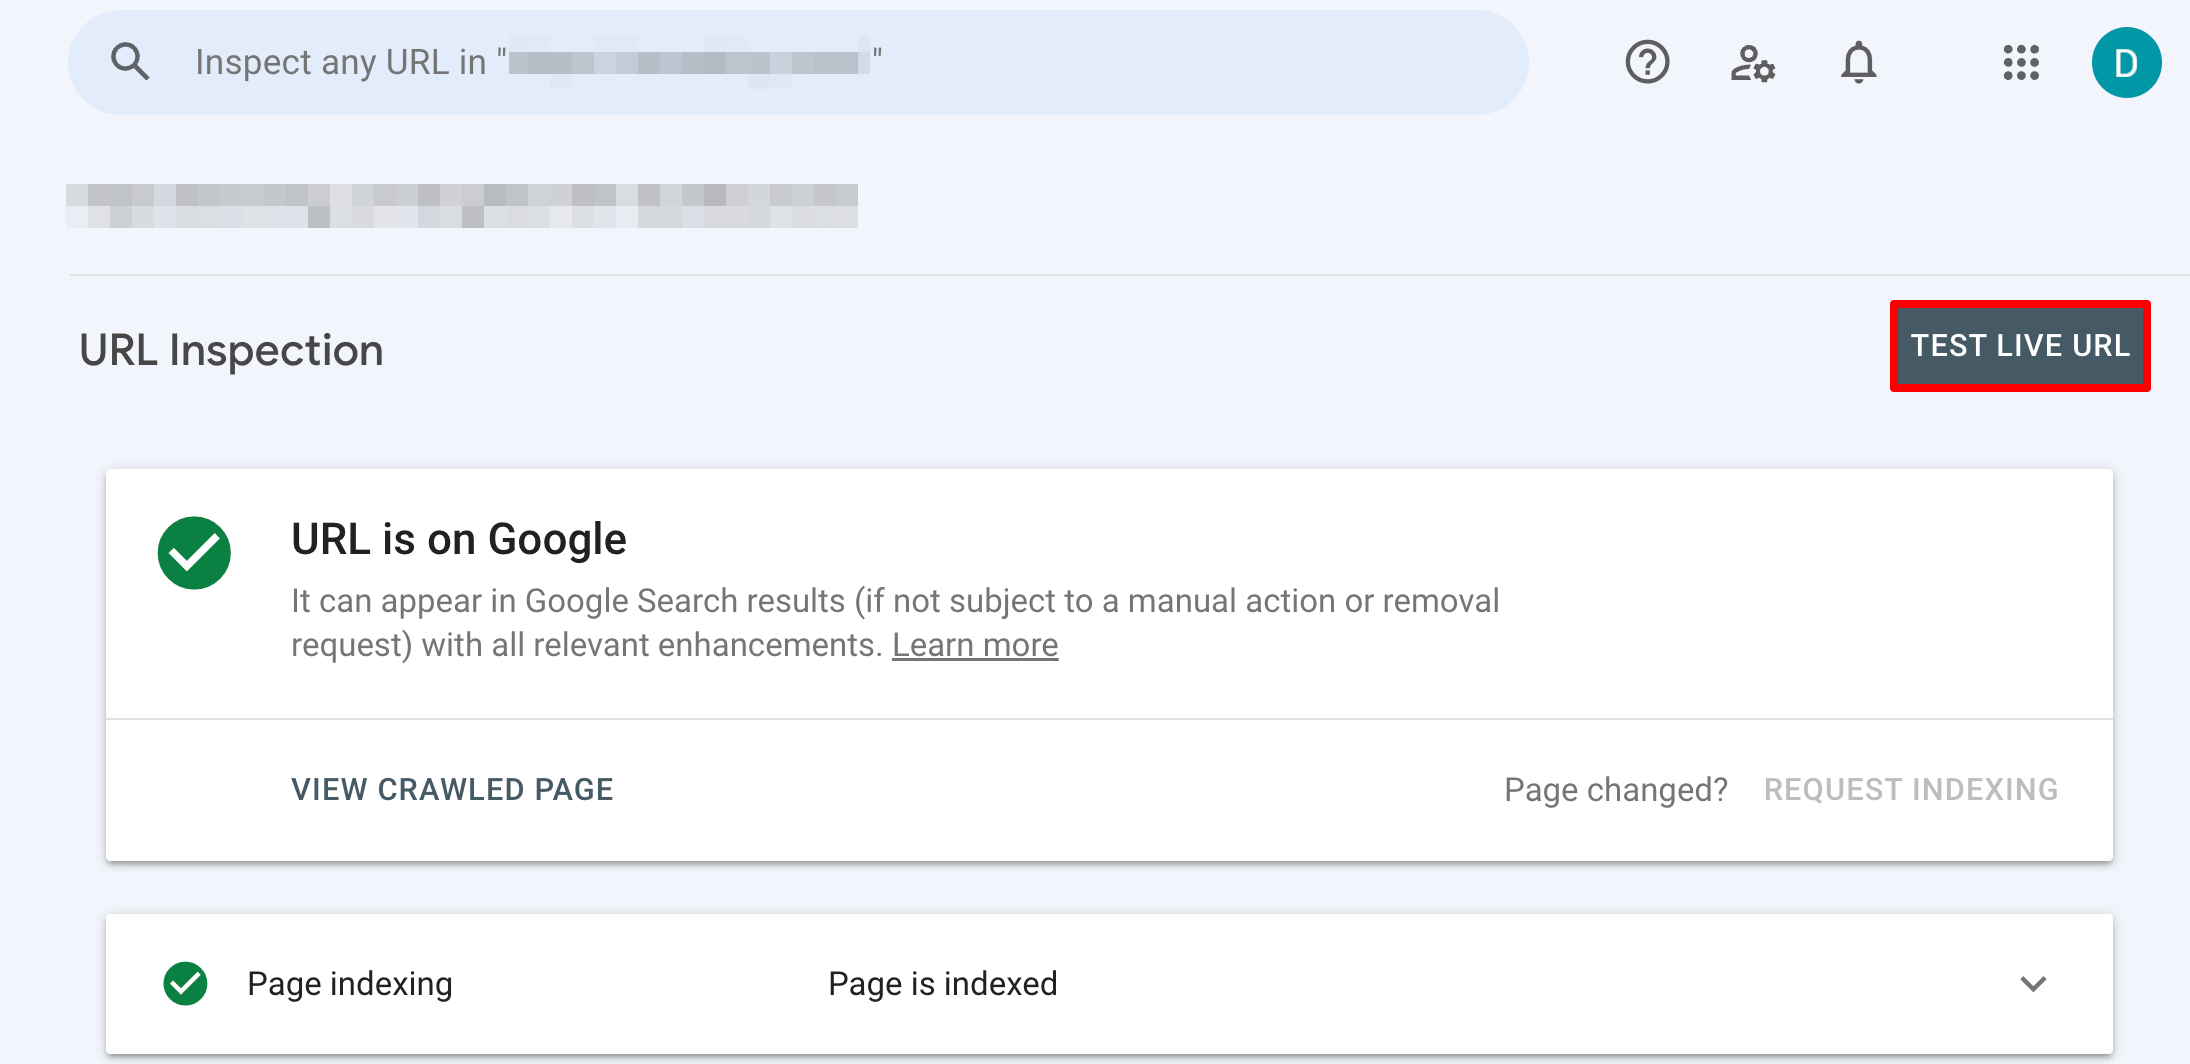
Note that in the URL Inspection tool, you can only view recently indexed page versions, which may have already disappeared from search results since the last crawl. To check your page in real time, click on the Test live URL button on the inspection result panel.
Performance on Search Results
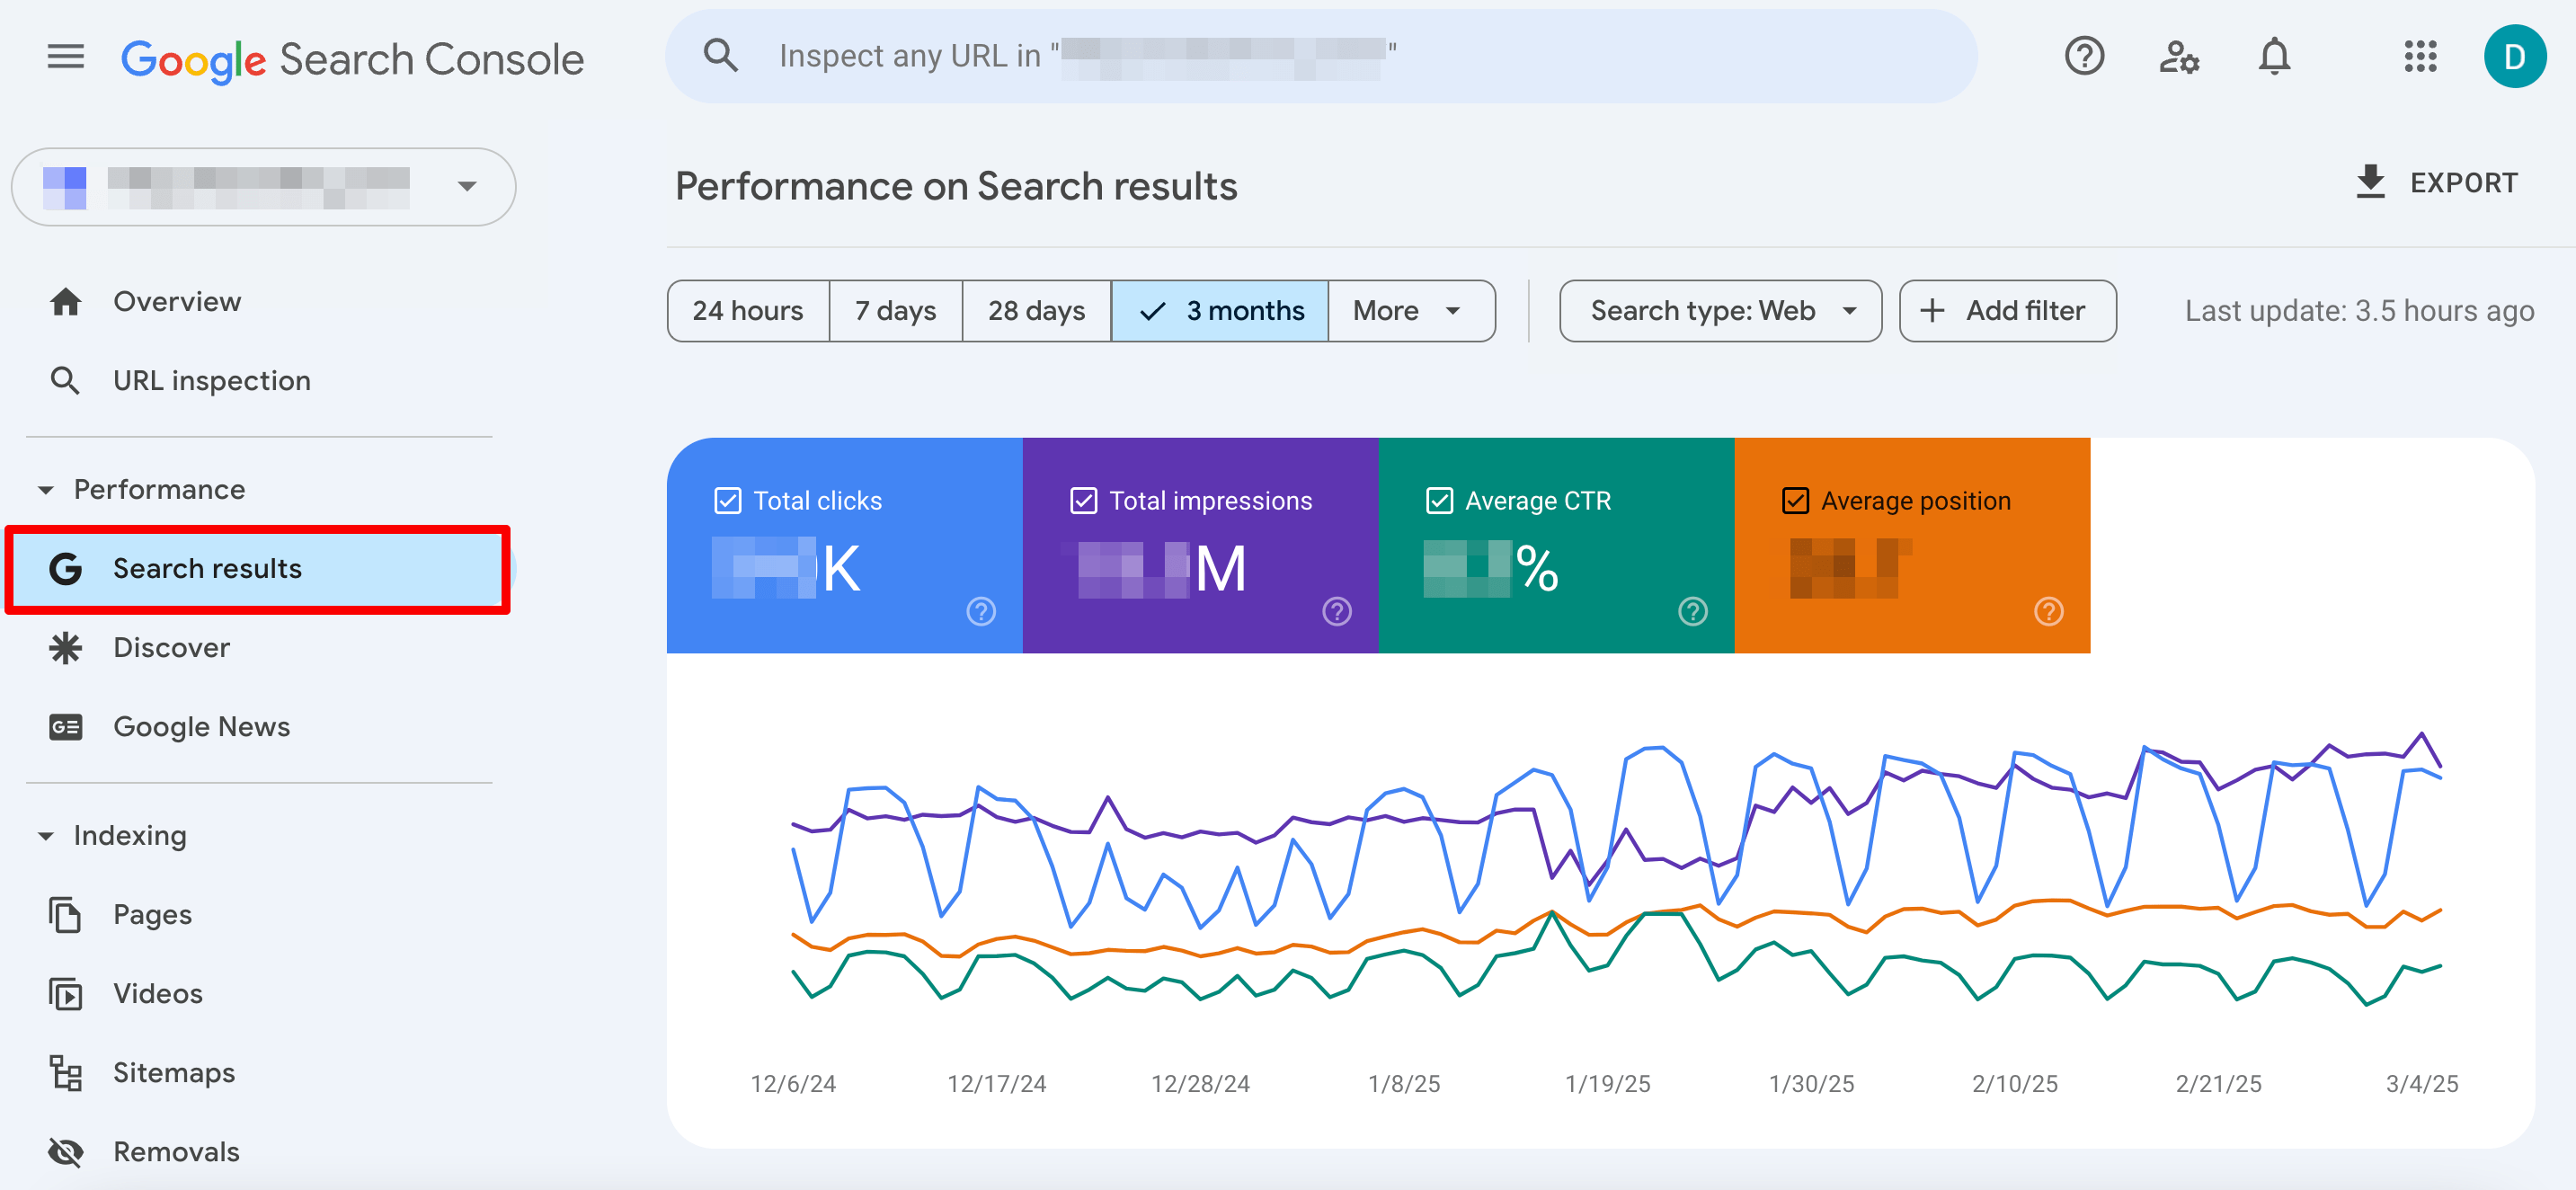
The Search results report displays important metrics about how your site performs in SERPs.
For example, it shows how your search traffic changes over time, where it’s coming from, which search queries your site is most likely to show up for, your most popular pages, the average ranking position of your pages, keyword cannibalization issues, and more. This is one of the most important reports for SEOs because it provides analytical data for website promotion analysis. Its in-depth data on keyword research, clicks, and impressions helps you hone in on the most successful keywords and pages to find growth opportunities.
Here is how GSC calculates data for each report:
1. Clicks. The number of Google Search clicks that brought users to your website. You can evaluate them in the table for specific queries, pages, countries, devices, and search appearances.
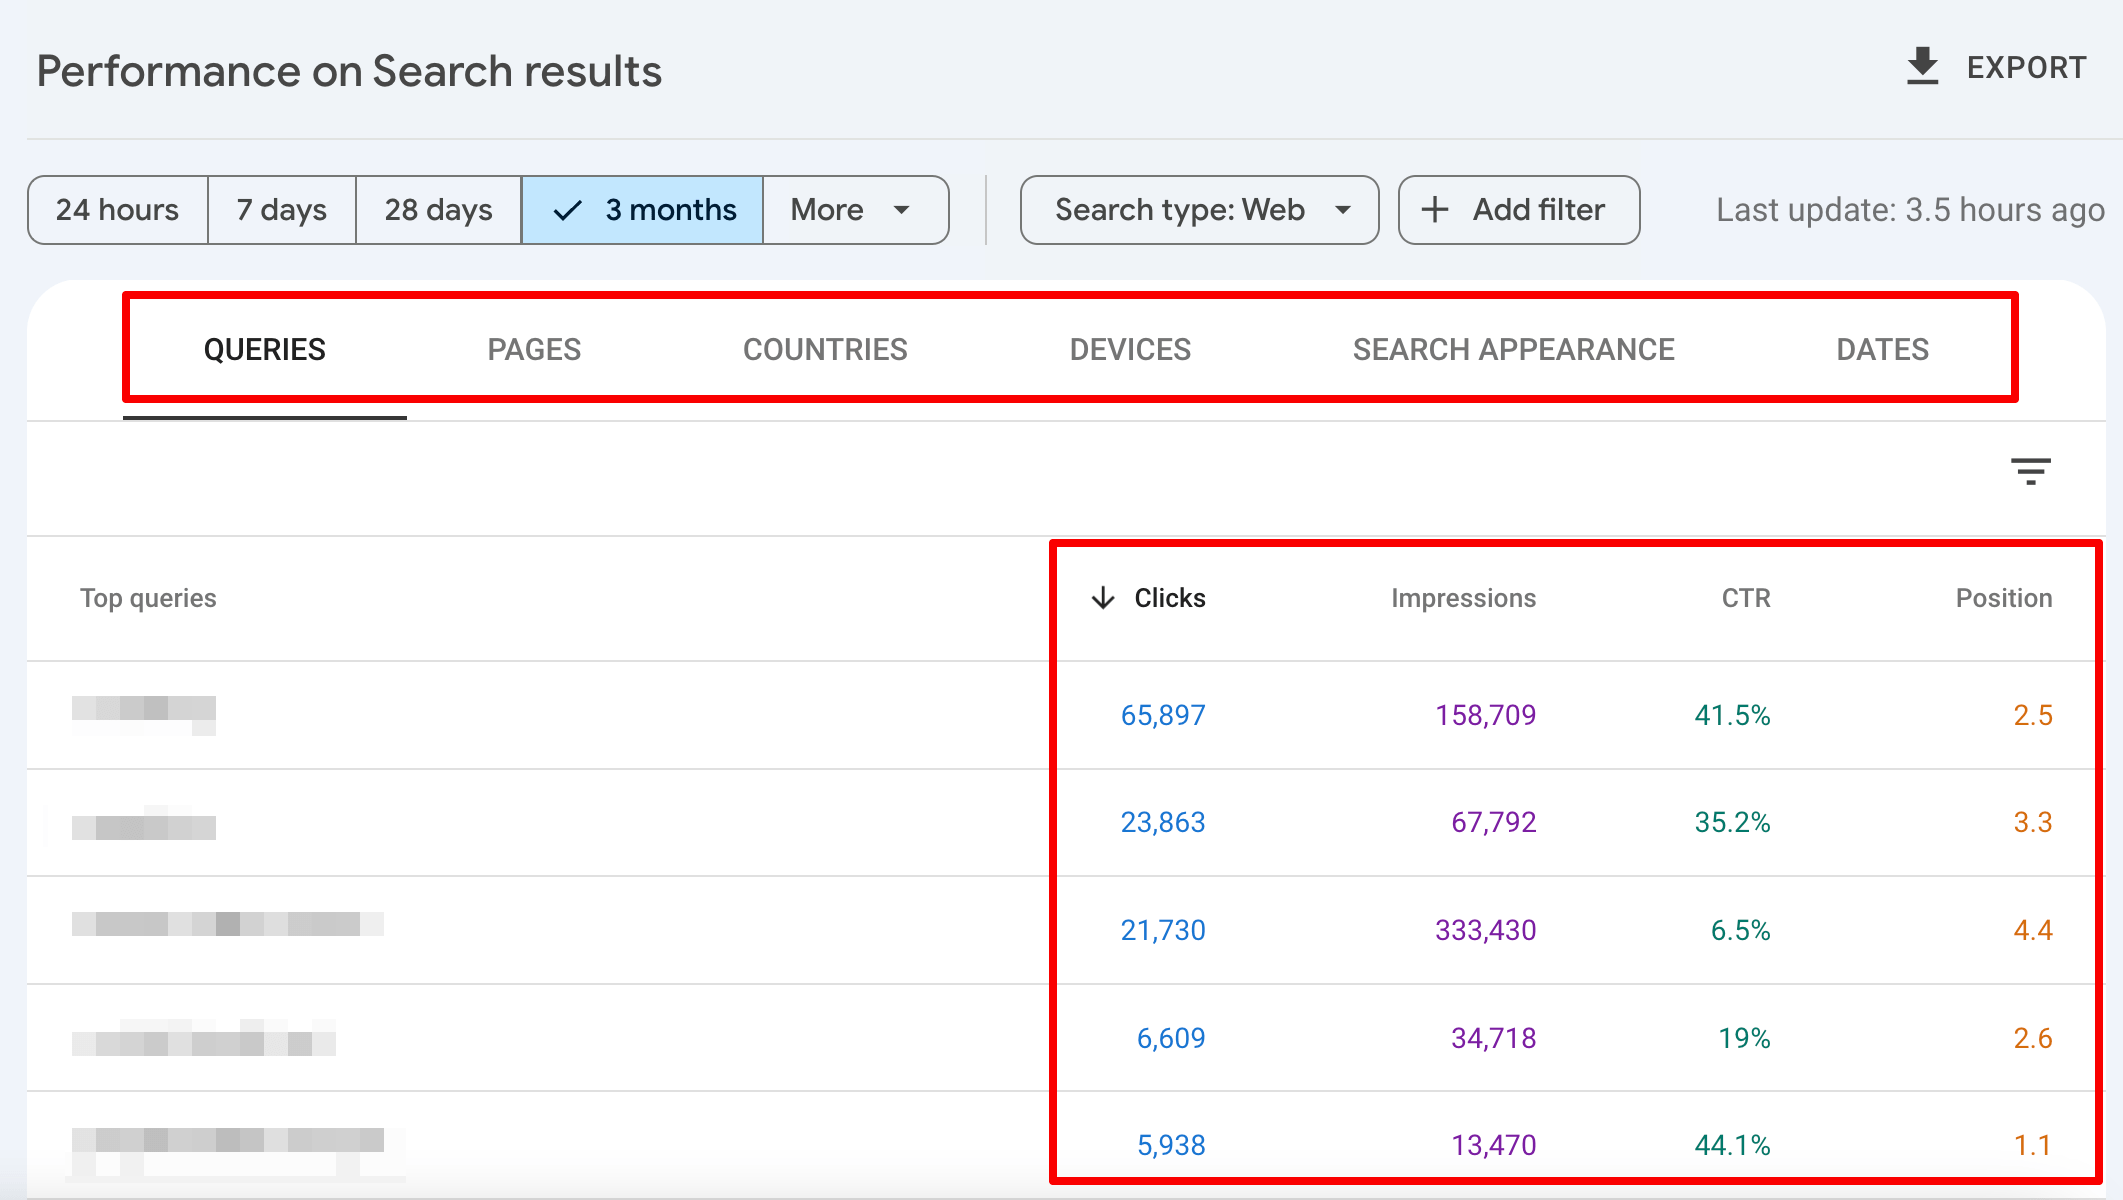
2. Impressions. Search Console records impressions when URLs appear in search results for users, even if those URLs are below the fold. For example, if your website ranks 8th (even if it is not visible to users), it will count as an impression.
Note that the impressions you see on the chart and in the table are aggregated by property, but you can view impressions for individual queries, pages, countries, devices, and search appearances in the table by selecting the appropriate tab.
3. CTR. This metric can be aggregated by property and page. It’s calculated as the number of clicks divided by the number of impressions multiplied by 100. For example, if you had 100 clicks and 1000 impressions, then your CTR would be 10%.
Learn more about click-through rate and how to improve it in our CTR for SEO guide.
4. Position. GSC shows the average highest position of your website in a property report and calculates the average position for all queries. If your site has appeared in different positions for a single query, GSC will use the highest one to calculate the average. If you check metrics by page or search appearance, you will see the topmost position of a page in search results, averaged across all queries where the page appeared.
For example, if a page achieved positions 3 and 5 for one query at different times, its topmost position in Google Search Console would be shown as 3. If the second query returned to positions 1 and 4, the top position would be 1, and the average position would be (3+1)/2=2. If the number was 2.2, your actual average position would still be 2.
The Search Console also makes data matching easy by letting you compare figures, set up filters, and visualize them in different ways. For example, you can group data by queries and countries to find out what people are searching for in a particular region. Alternatively, you can check which pages are viewed most by mobile users, for example. Combinations like these provide a more comprehensive picture of your website performance by showing you how various metrics are related to each other.
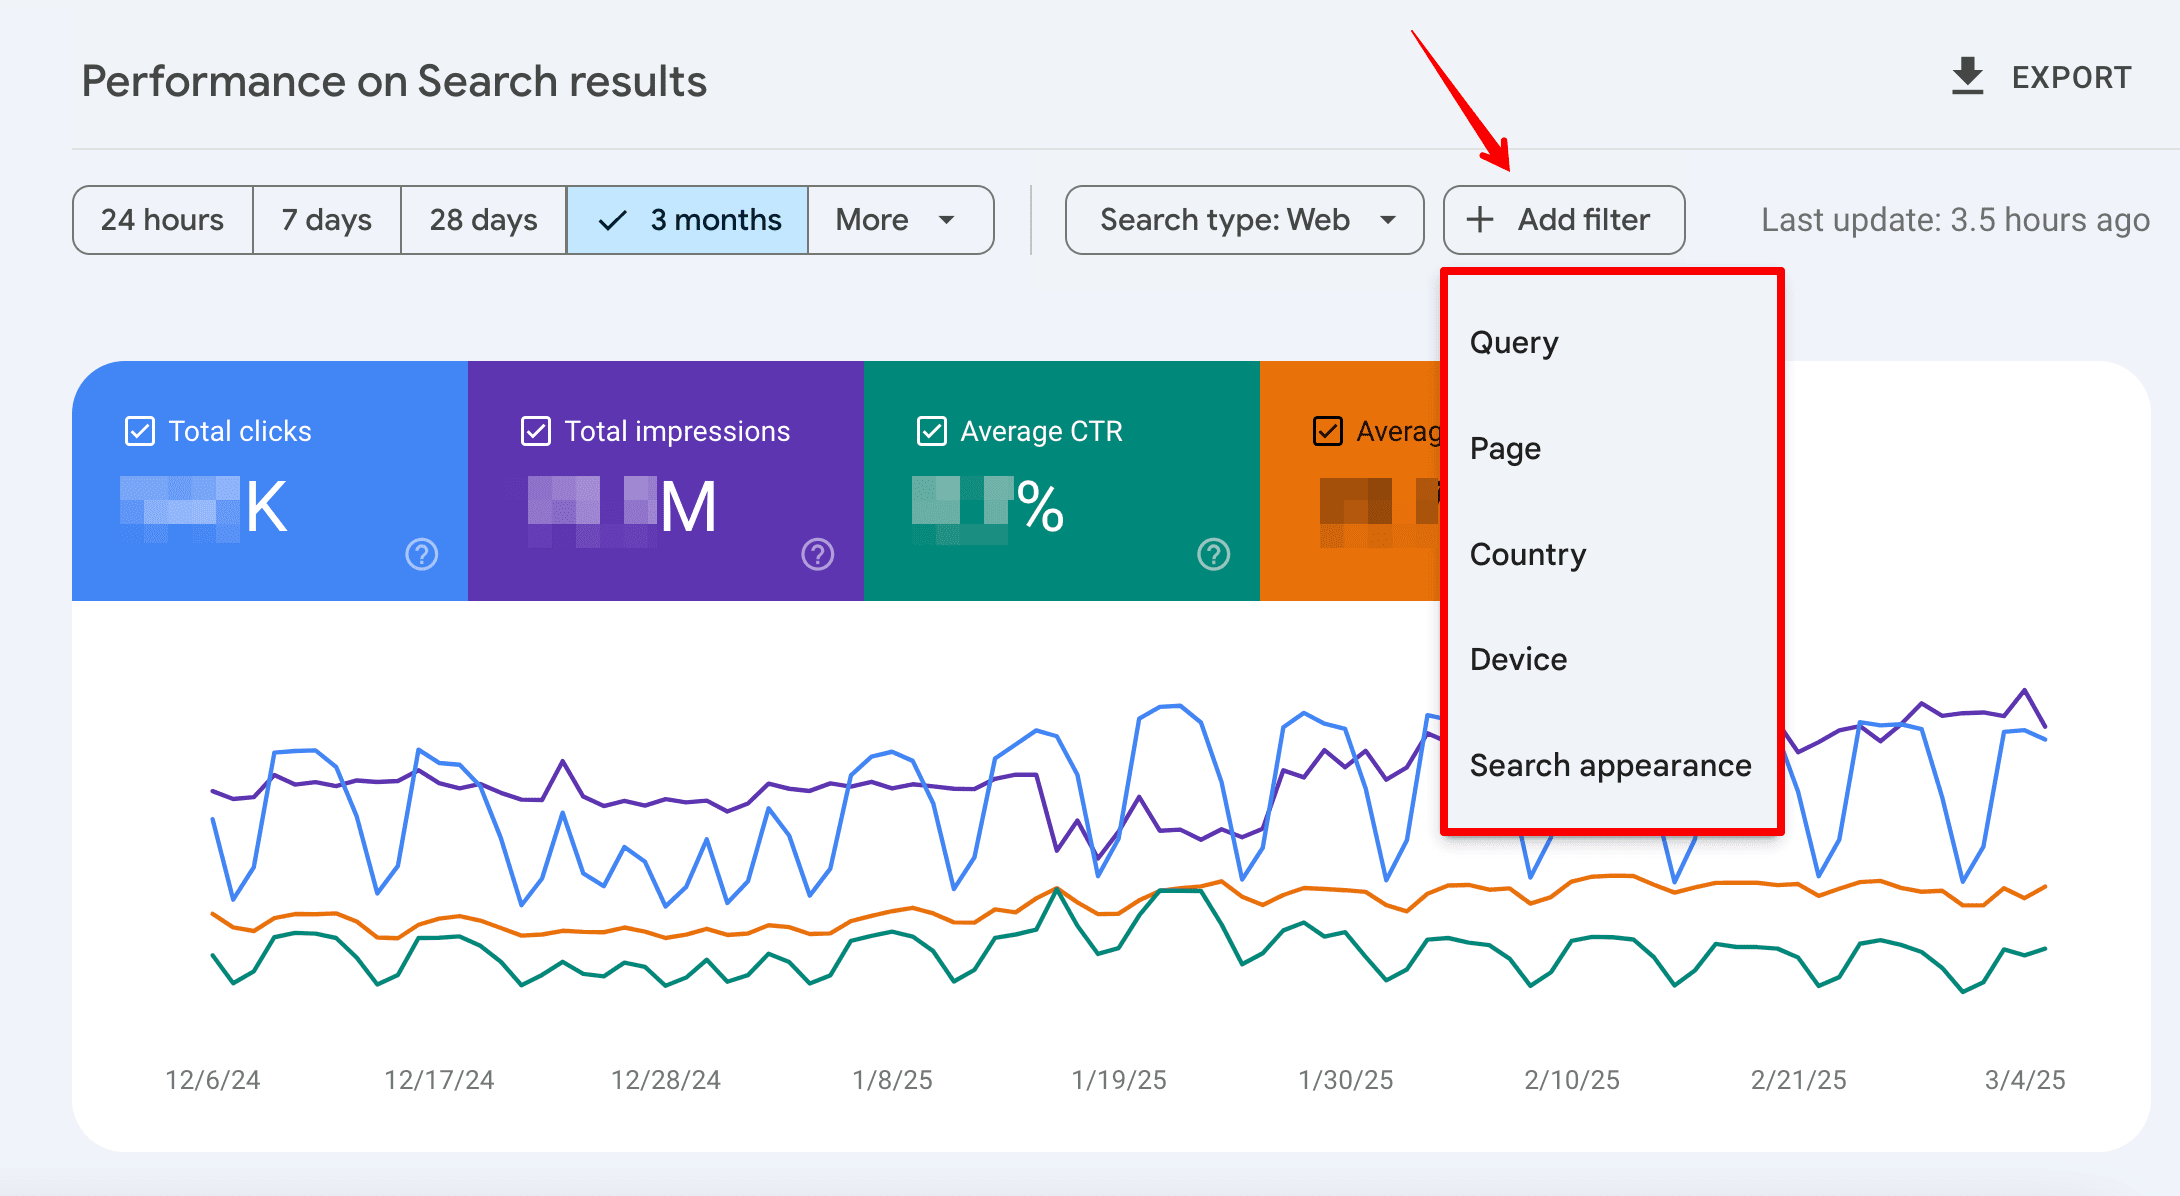
Click on the Add filter button to access filters and apply the following parameters:
- Query: View keywords searched by users on Google.
- Page: Collect search performance data by page.
- Country: Check where the searches come from.
- Device: Get statistics based on the type of device used during searches.
- Search appearance: Get data grouped by specific search appearance features or search result types.
Search Console offers two additional filters:
- Search type: Shows web results, images, videos, or news.
- Dates: Groups information by date. You can customize the time range, but data is only available for the past 16 months.
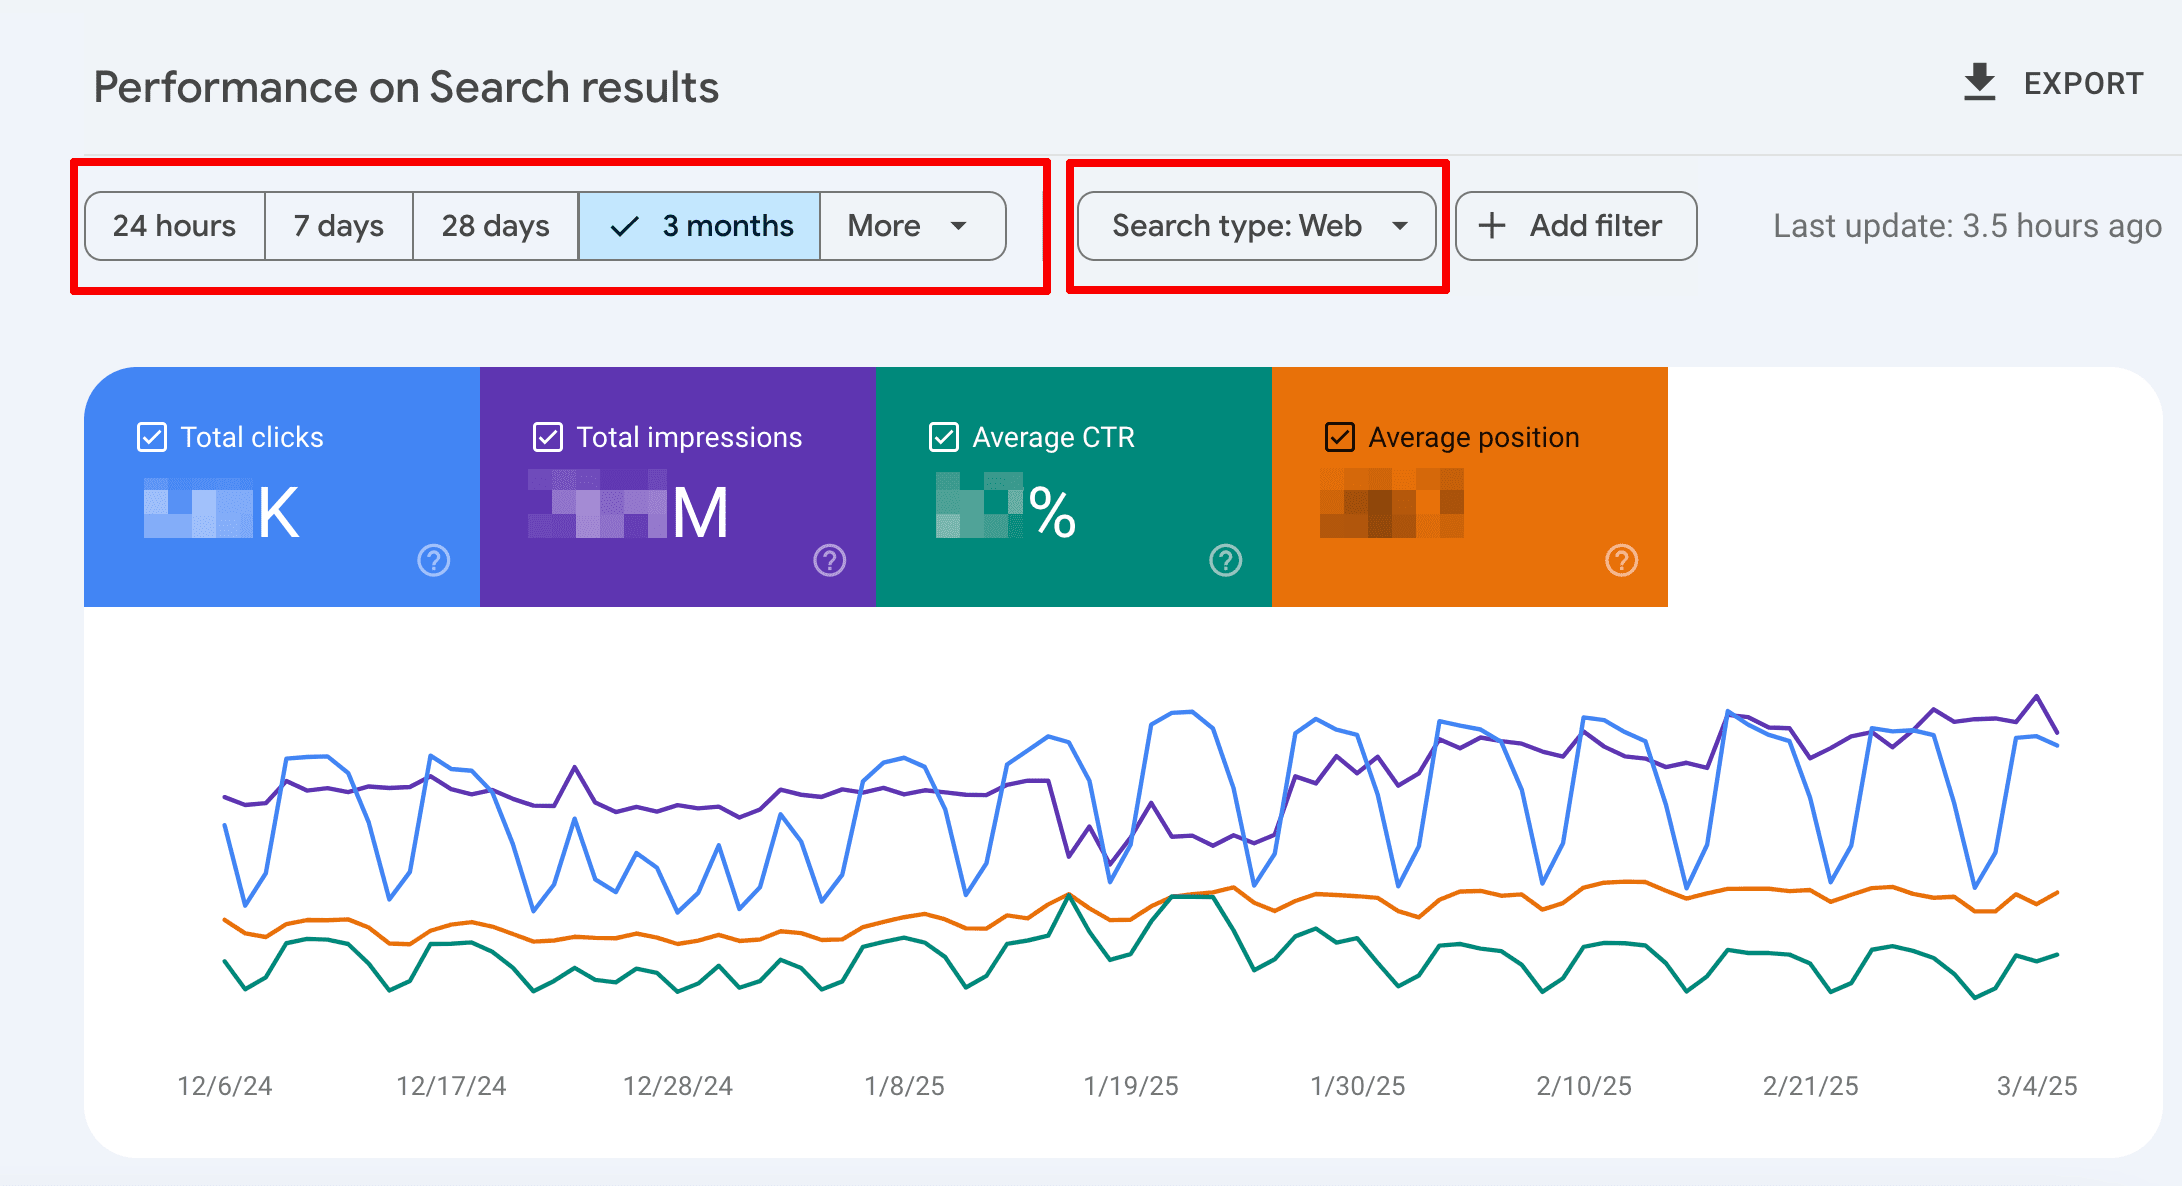
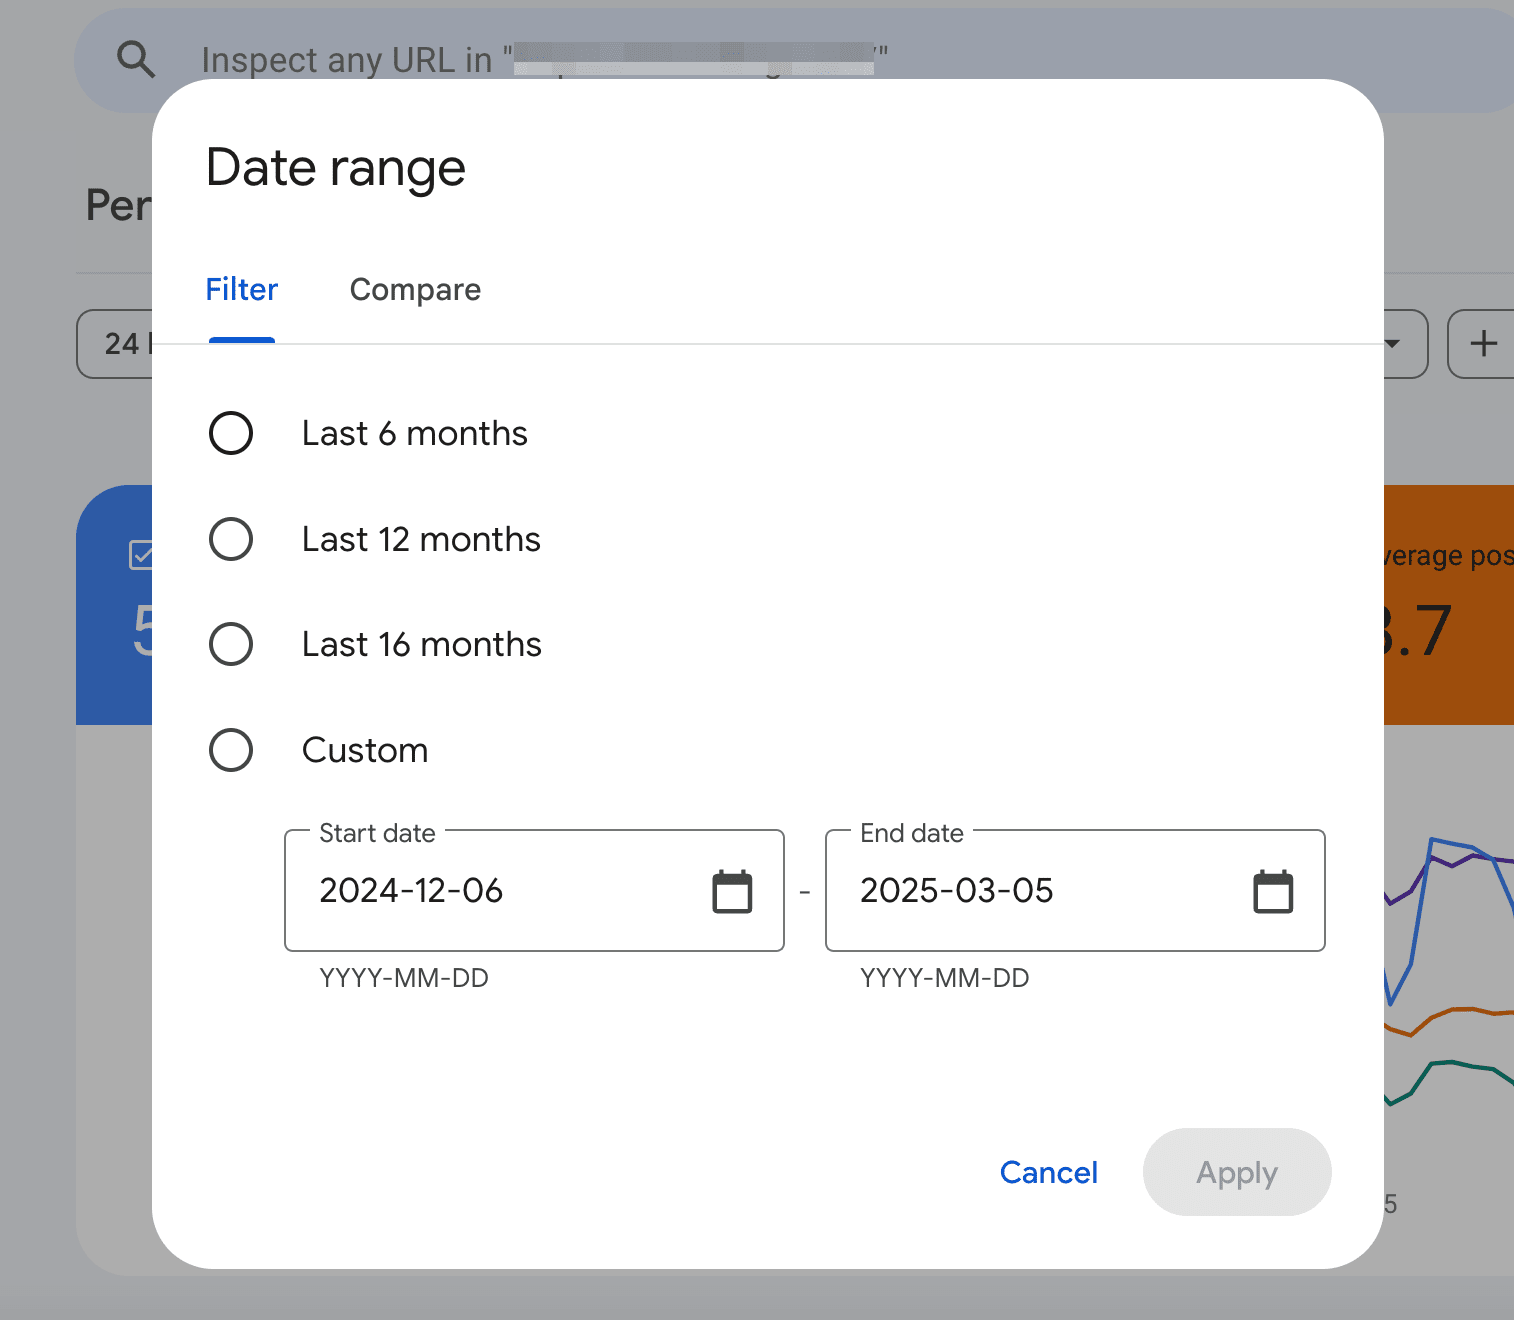
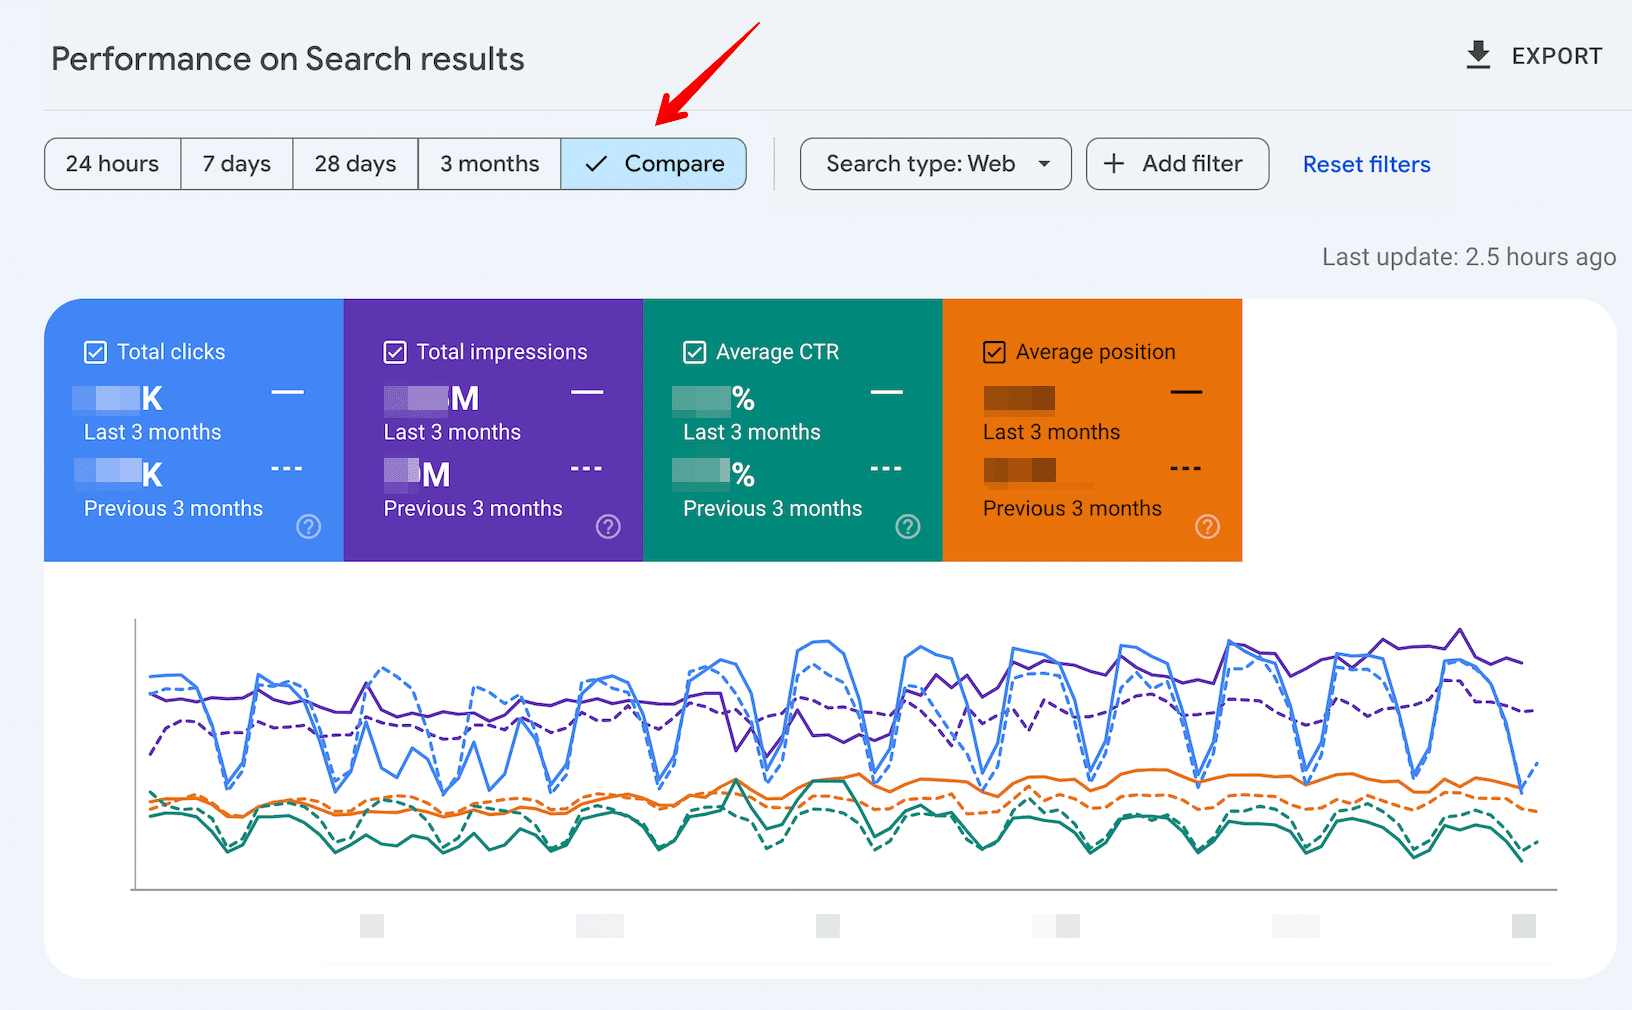
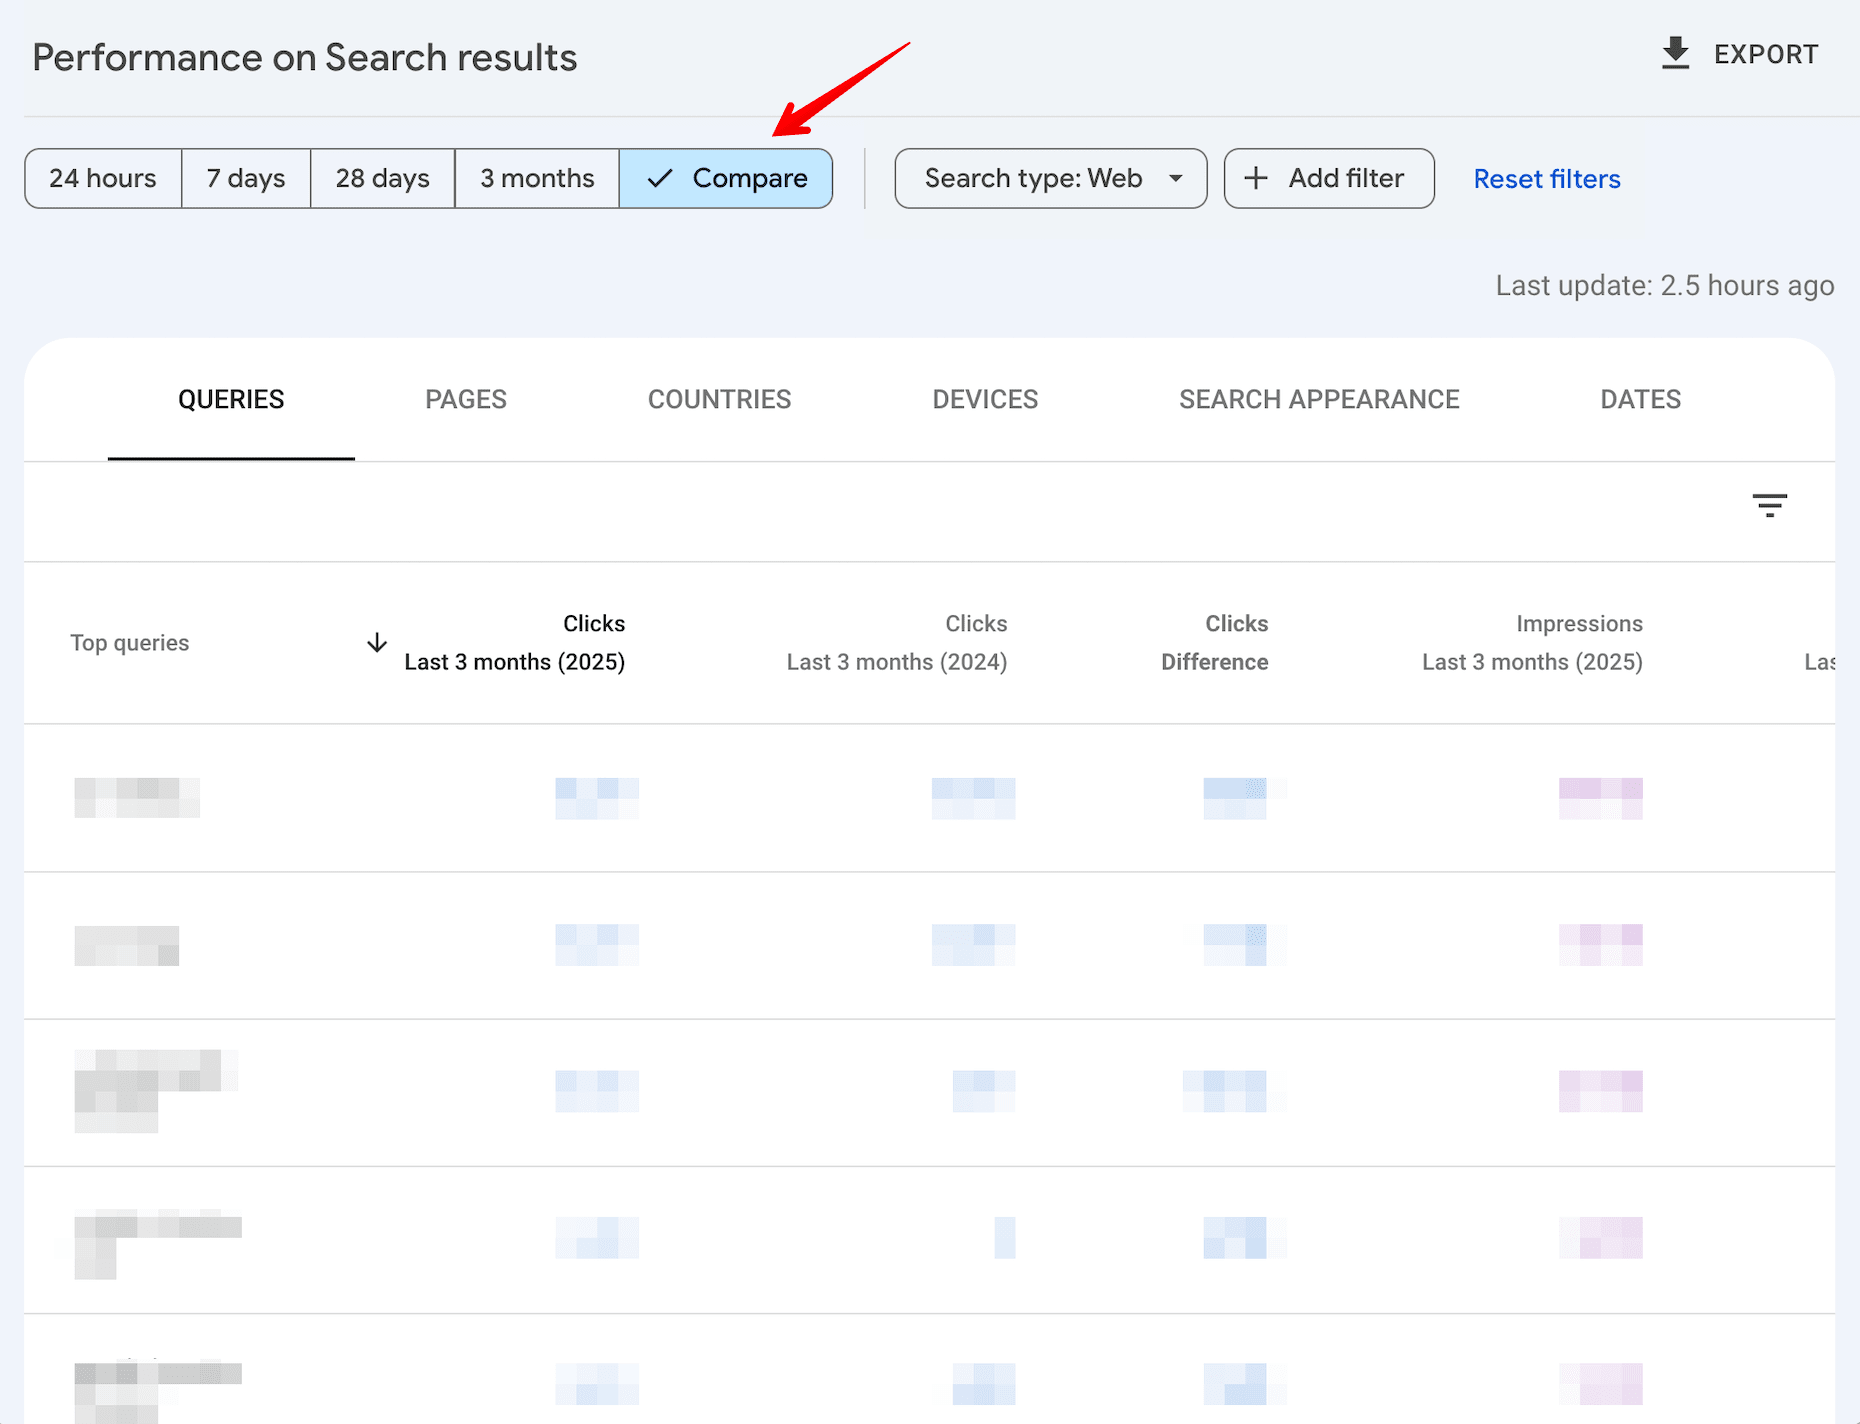
Each one of the parameters described above enables data filtering and offers a comparison feature. For instance, you can compare metrics between desktop and mobile, compare dates, different countries, pages, etc.
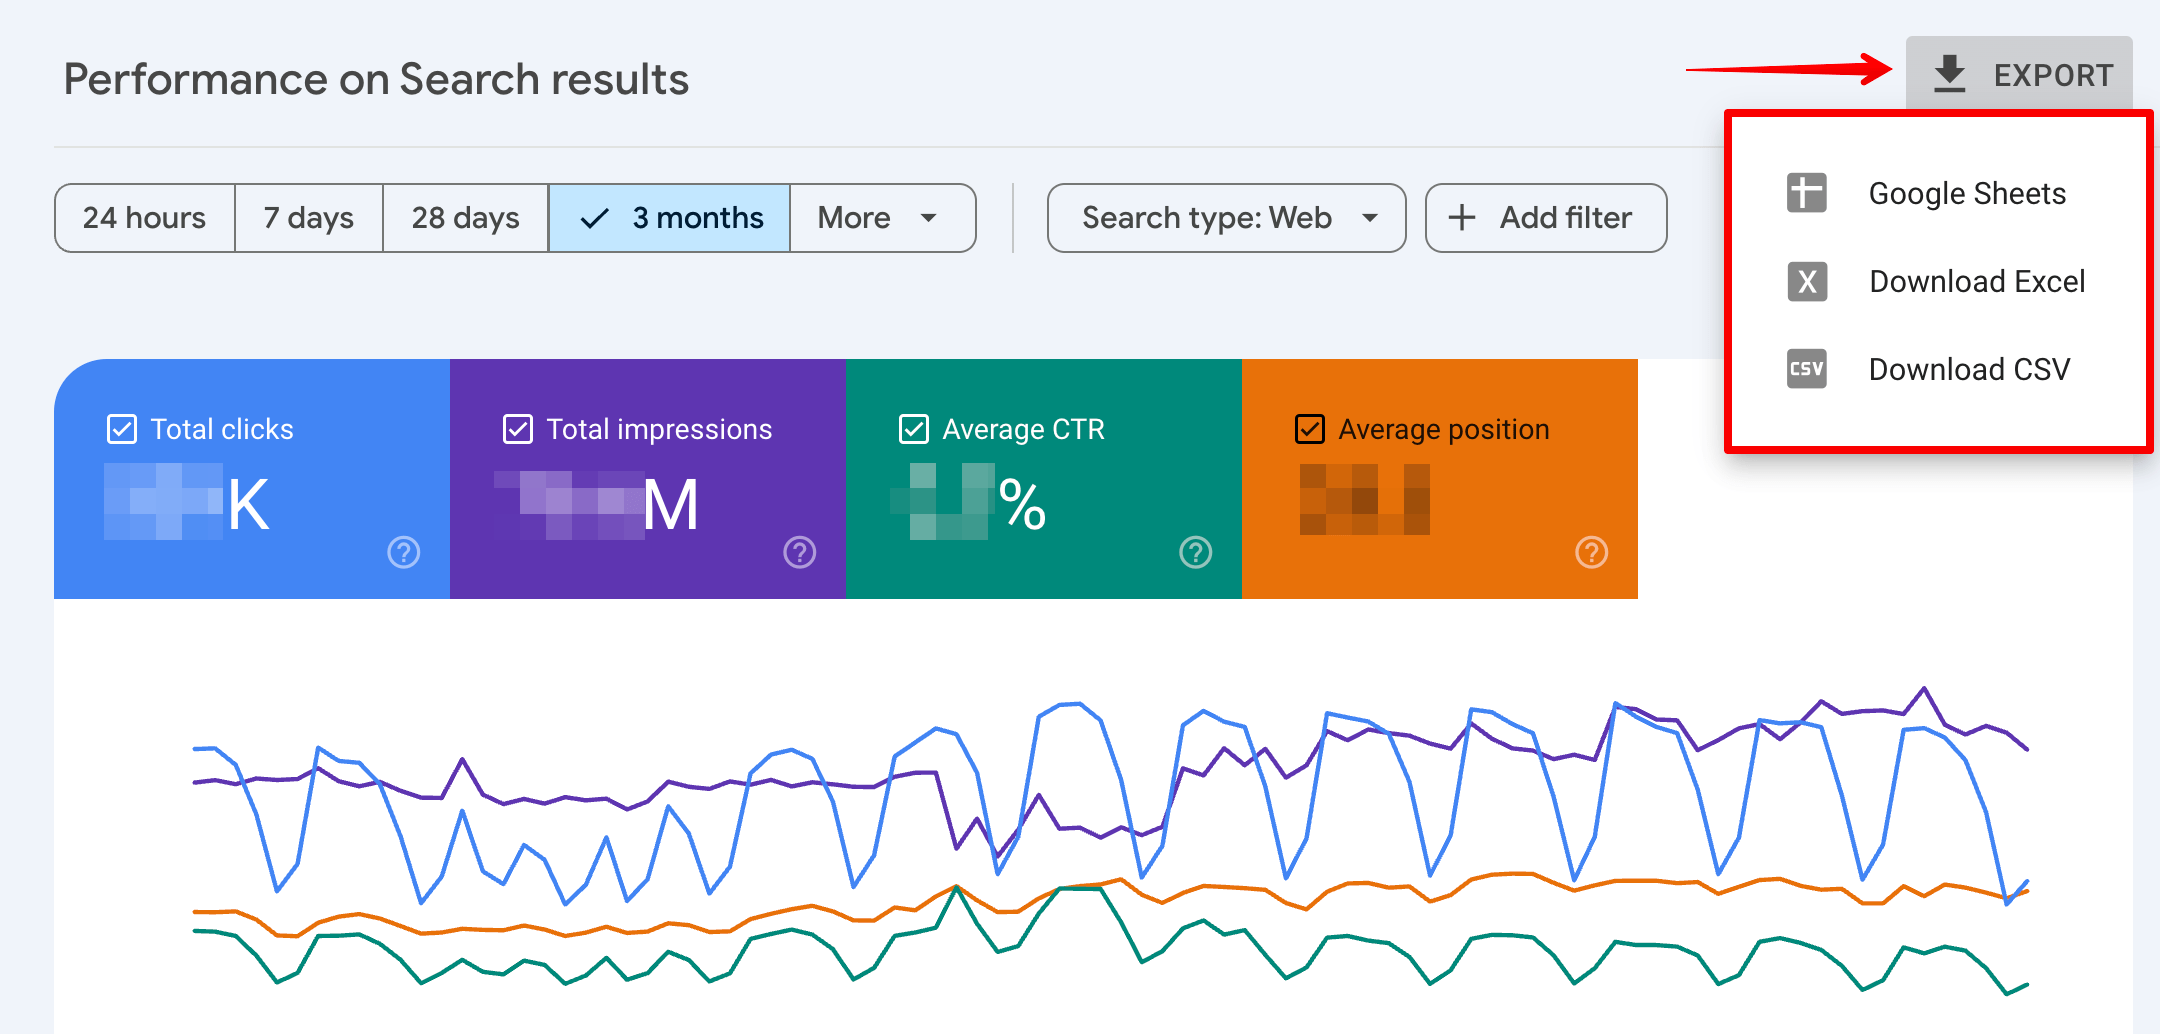
GSC also lets you export data to Google Sheets, Excel, or a CSV file, and in a single click. If any values show up as “not available” or “not a number” in the console, they will be replaced by zeros in the downloaded file.
GSC has its limits. It only reveals up to 1000 URLs or queries, and you can’t download more (checked Nov 2025). This is inconvenient for larger-scale sites, as analyzing them becomes more difficult upon downloading multiple files.
Let’s look at a few possible solutions to this problem.
One option is to use the Search Console API. However, this method is only appropriate for users with technical expertise, as it can be complex and time-consuming to export data using the API.
You can also export data from Google Search Console using the Google Sheets add-on. Enabling it gives you access to information about rankings, queries, and clicks. It displays this data in a spreadsheet with up to 5000 rows, which is the API’s maximum.
If you don’t have a strong technical background or a developer on your team, you can use third-party services to bypass GSC limitations.
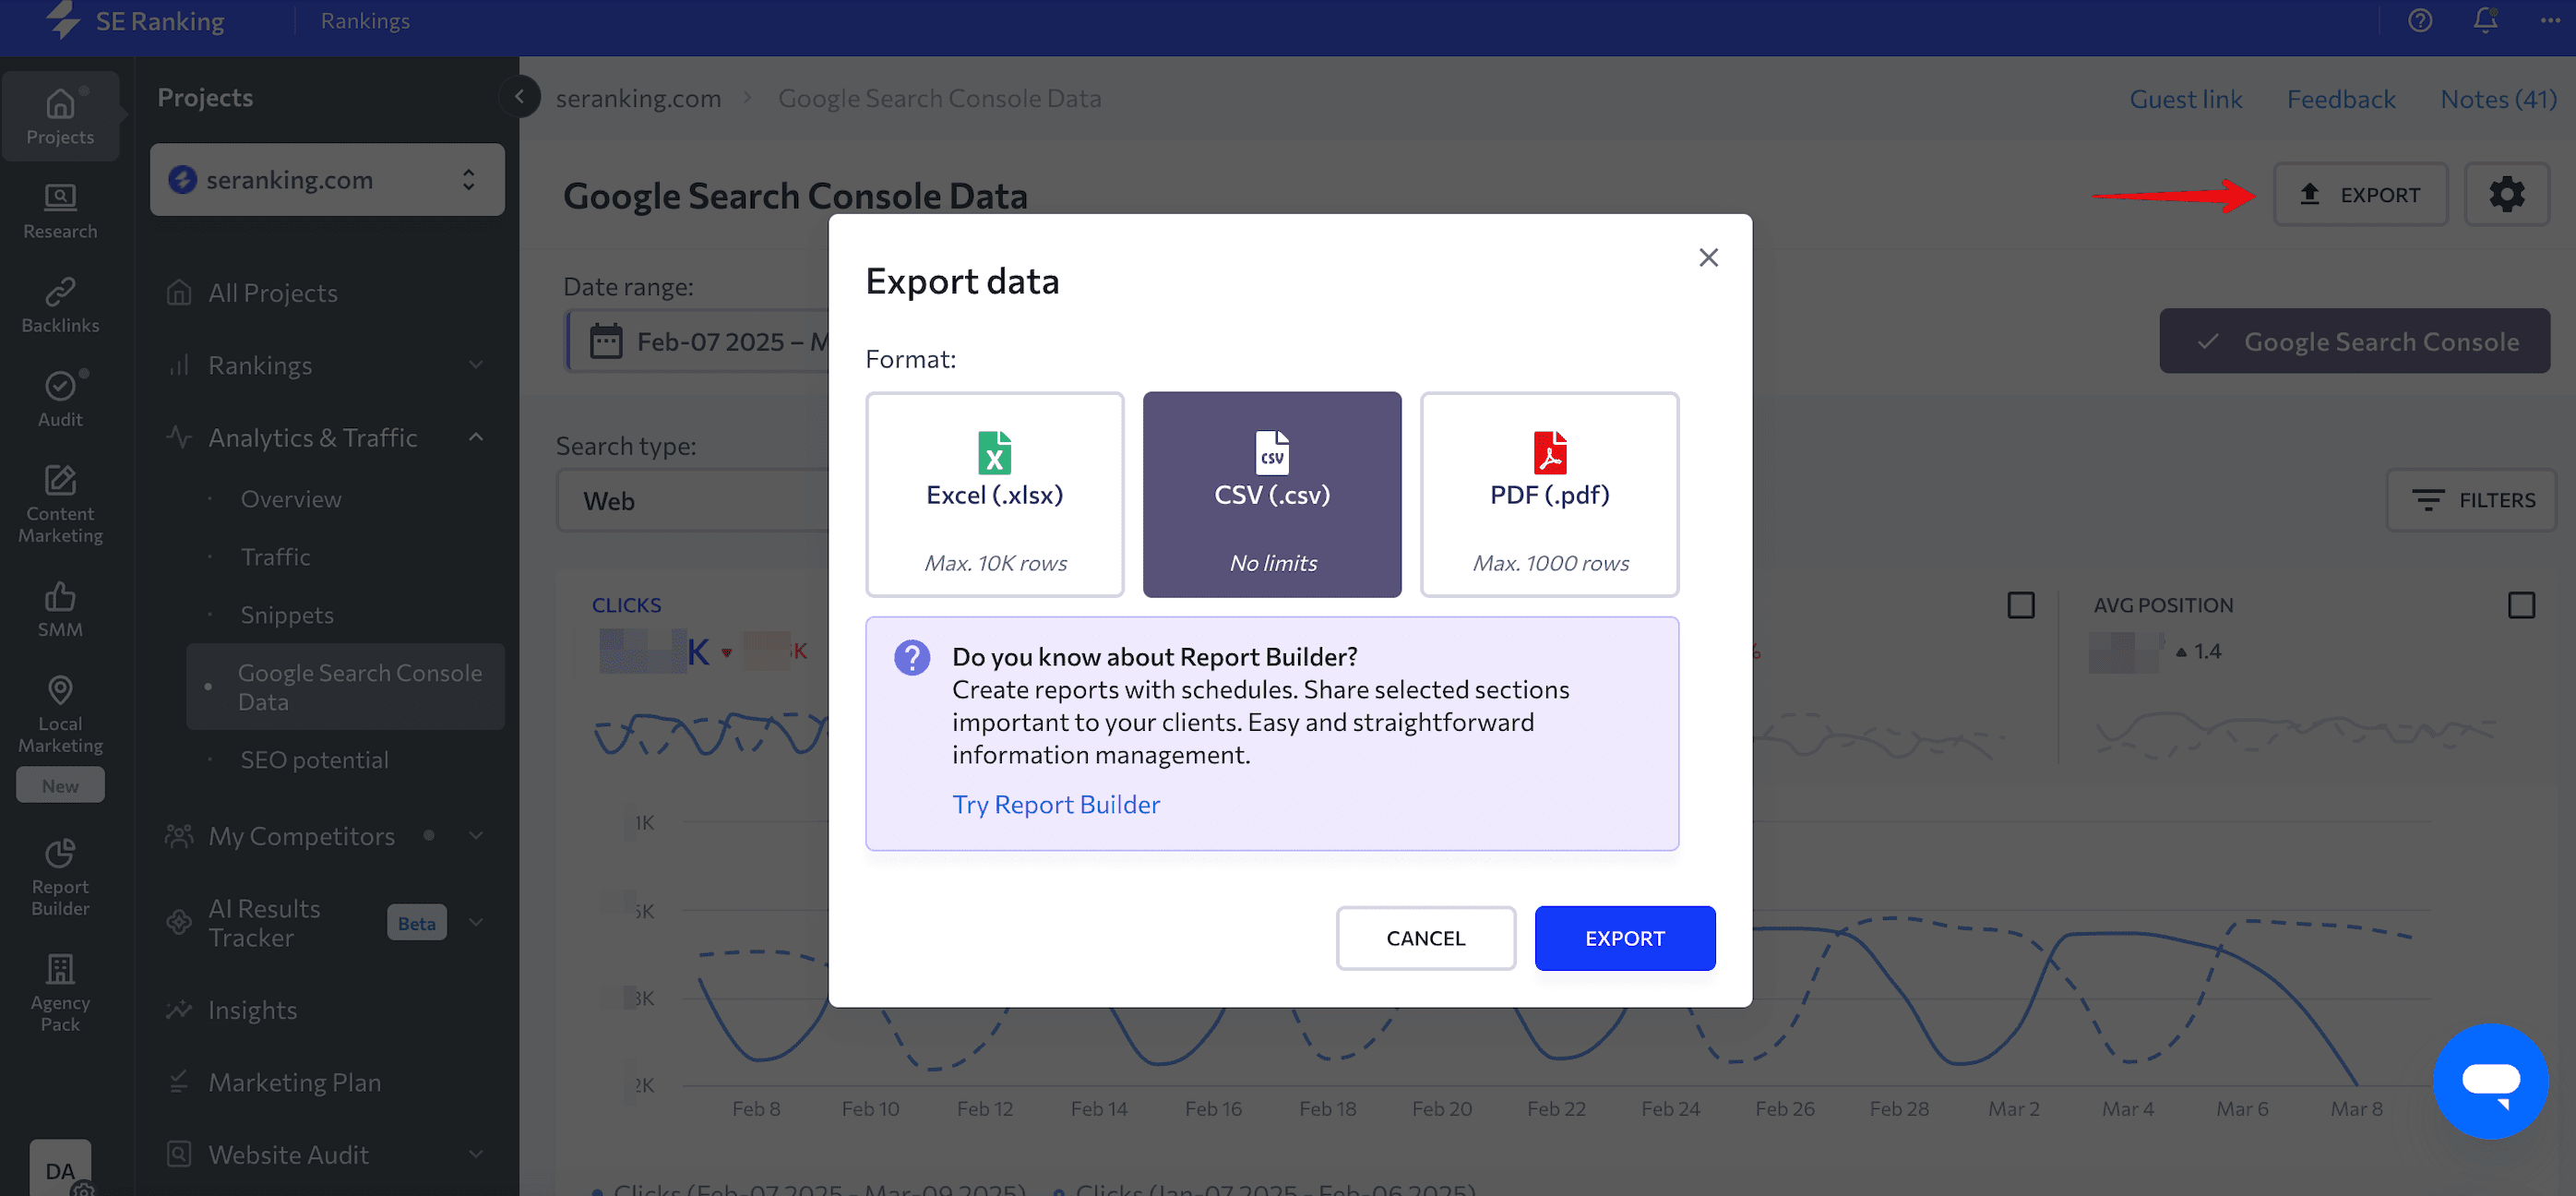
SE Ranking collects data from Google Search Console and presents it in a convenient format, making it easier for you to perform advanced analysis and visualize the data in different ways. With SE Ranking, you can export up to 10,000 rows in .xls format and an unlimited number of rows in a CSV file. This allows you to download all the data in a single click and have all the information in one place.
When Search Console data is updated
You can view information about the last update in the top right corner of GSC. However, GSC may take about a week to display this data after you add your website to the tool for the first time.
Note that there may be a delay in data displayed by GSC compared to other tools. This can happen as a result of Google neglecting to scan your website since your last update or GSC needing more time to process additional data.
Performance on Discover
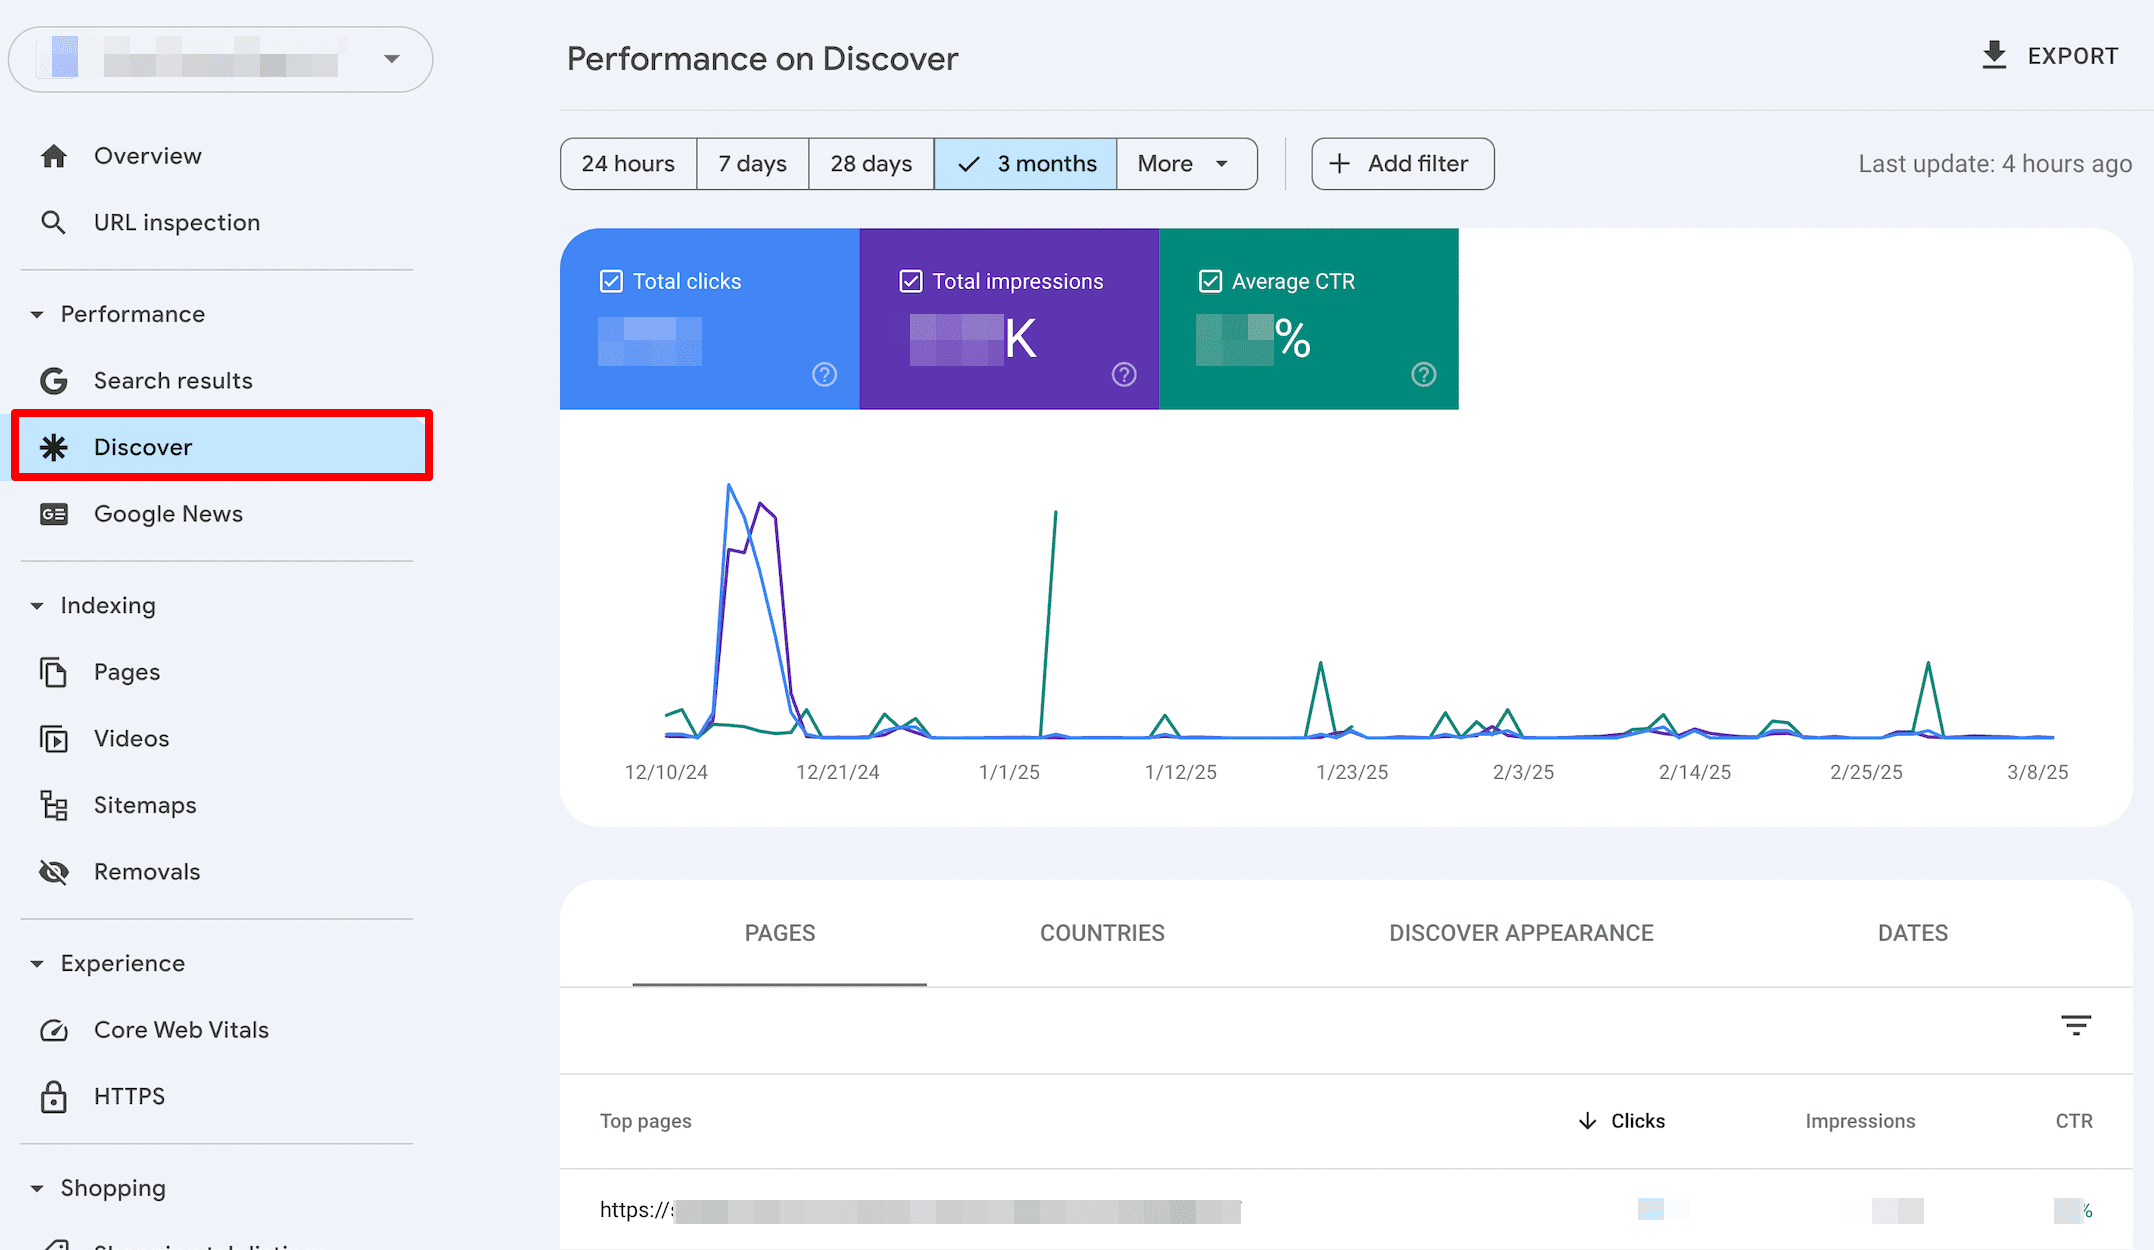
The Performance on Discover report displays the number of impressions and clicks on Discover, which is a feed created for mobile devices. It recommends content to users based on their past Google searches. This data helps you identify which content from the site appeared in the Discover feed and how much traffic it was able to drive compared to regular search results.
This data is aggregated by page for the selected time frame. You can group data by page, country, appearance type, and day, and compare figures. Note that this report will only be available if your site has reached enough impressions on Discover.
Performance on Google News
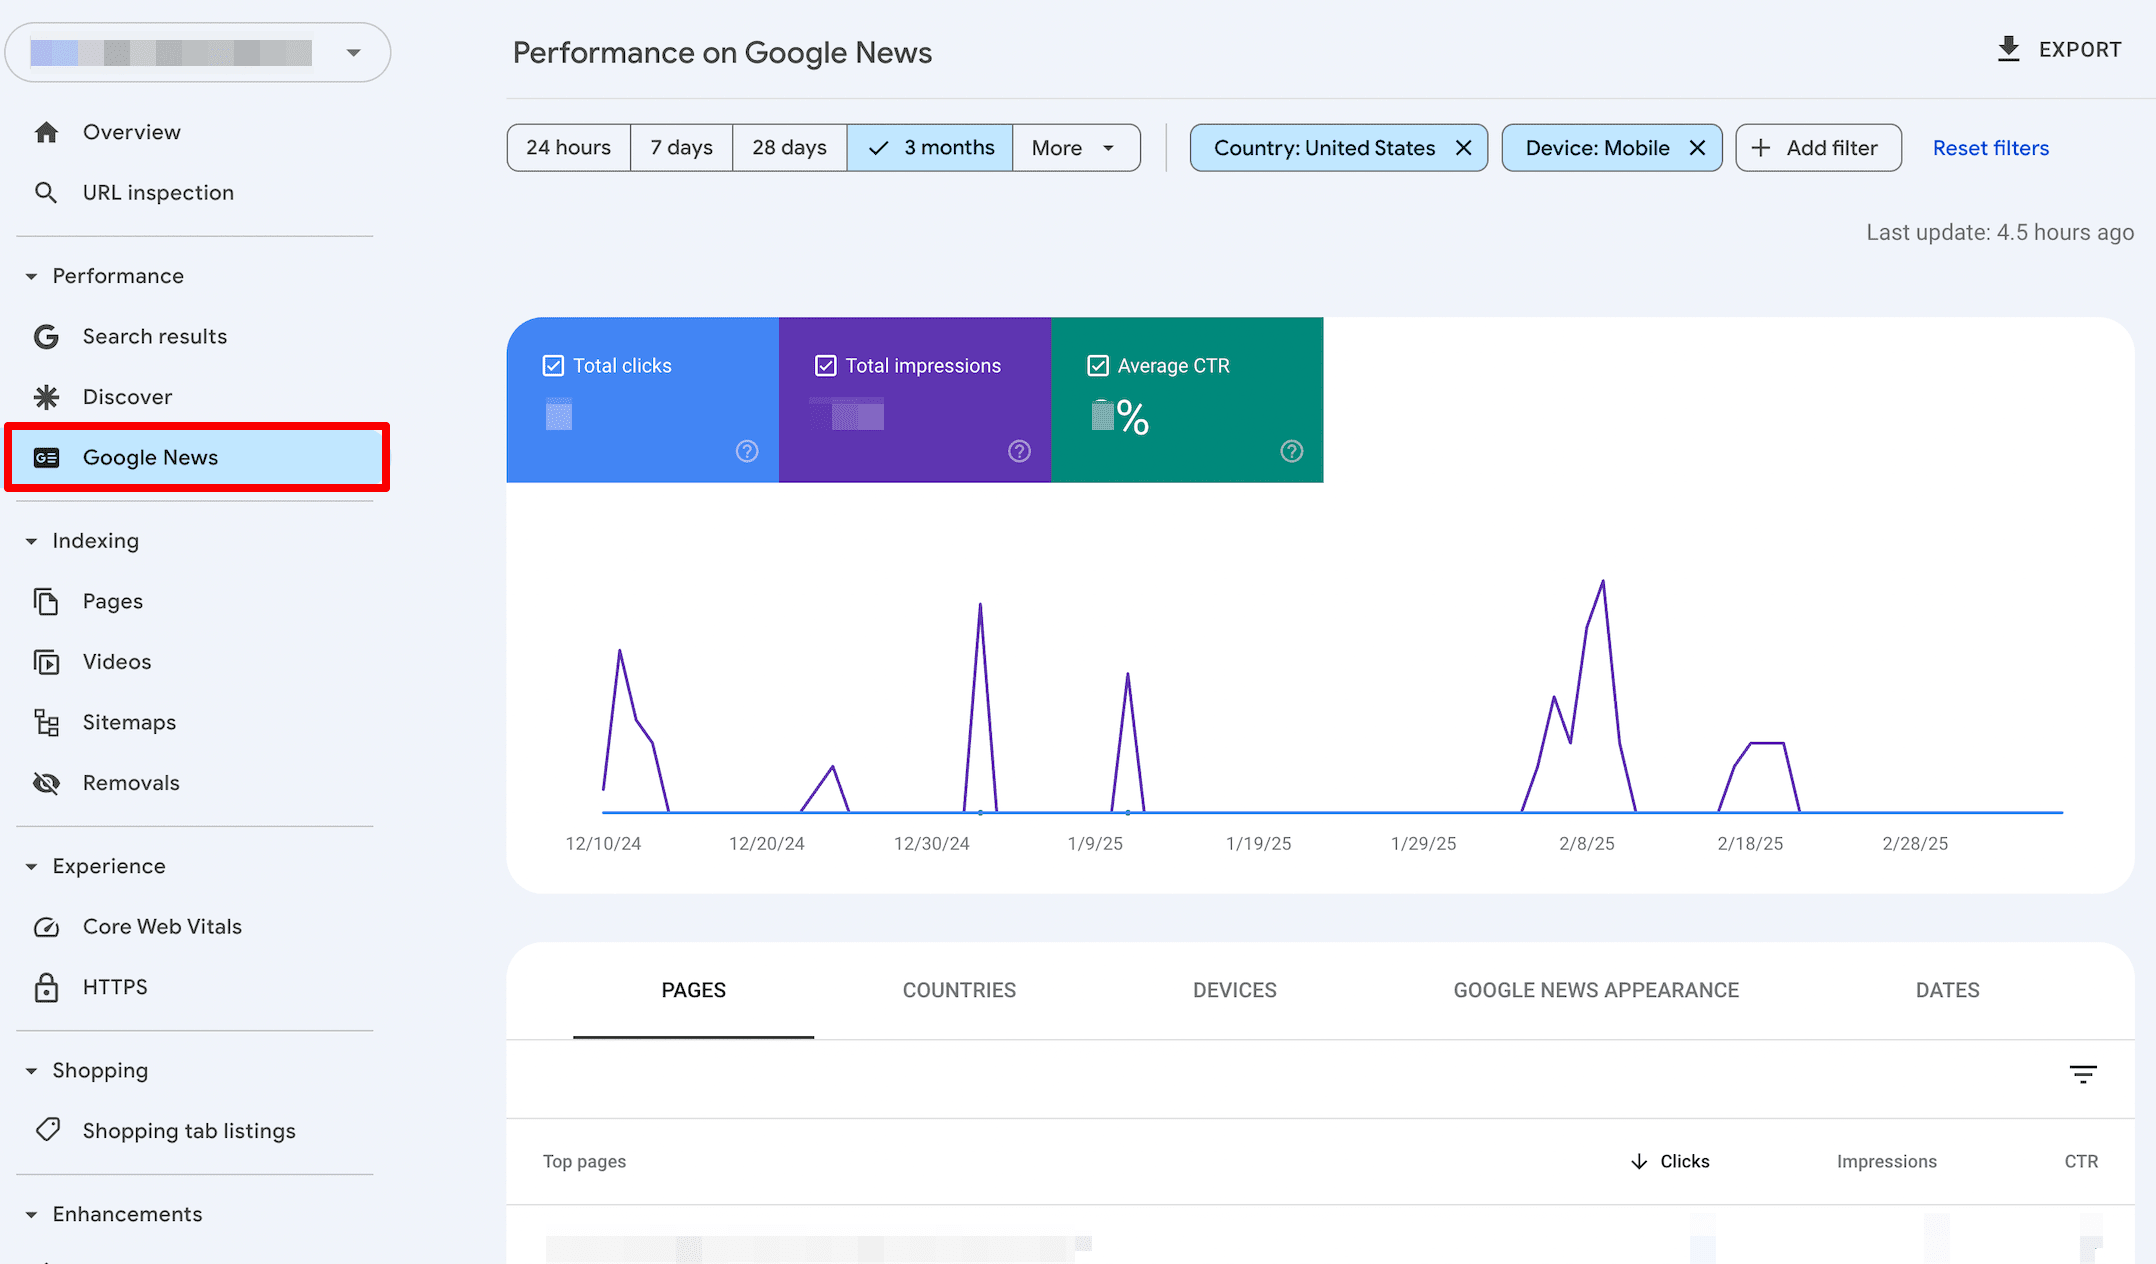
The Performance on Google News report gathers data on website performance from news.google.com and the Google News apps, which show millions of articles worldwide. It serves as an alternative source from which to drive organic traffic. Analyzing the click and impression count of pages can give you insights into the type of content appearing in this section. You can build your content plan around this data and refine your SEO strategy accordingly.
Note: This report doesn’t include the News tab in Google Search, which is covered in the Performance report for Search, filtered to the News search type.
If you see any of your website pages in this report, you can check their performance by viewing their clicks, impressions, and average CTR. You can group these metrics by page, country, date, Google News appearance, and device type.
Page indexing report
The Page indexing report helps you keep track of your site’s indexing status. It also indicates if tech issues are holding your pages back from being properly crawled and indexed. Check it regularly to spot and resolve issues before they can dampen your site’s performance.
Find the report by clicking on the Pages tab under the Indexing section.
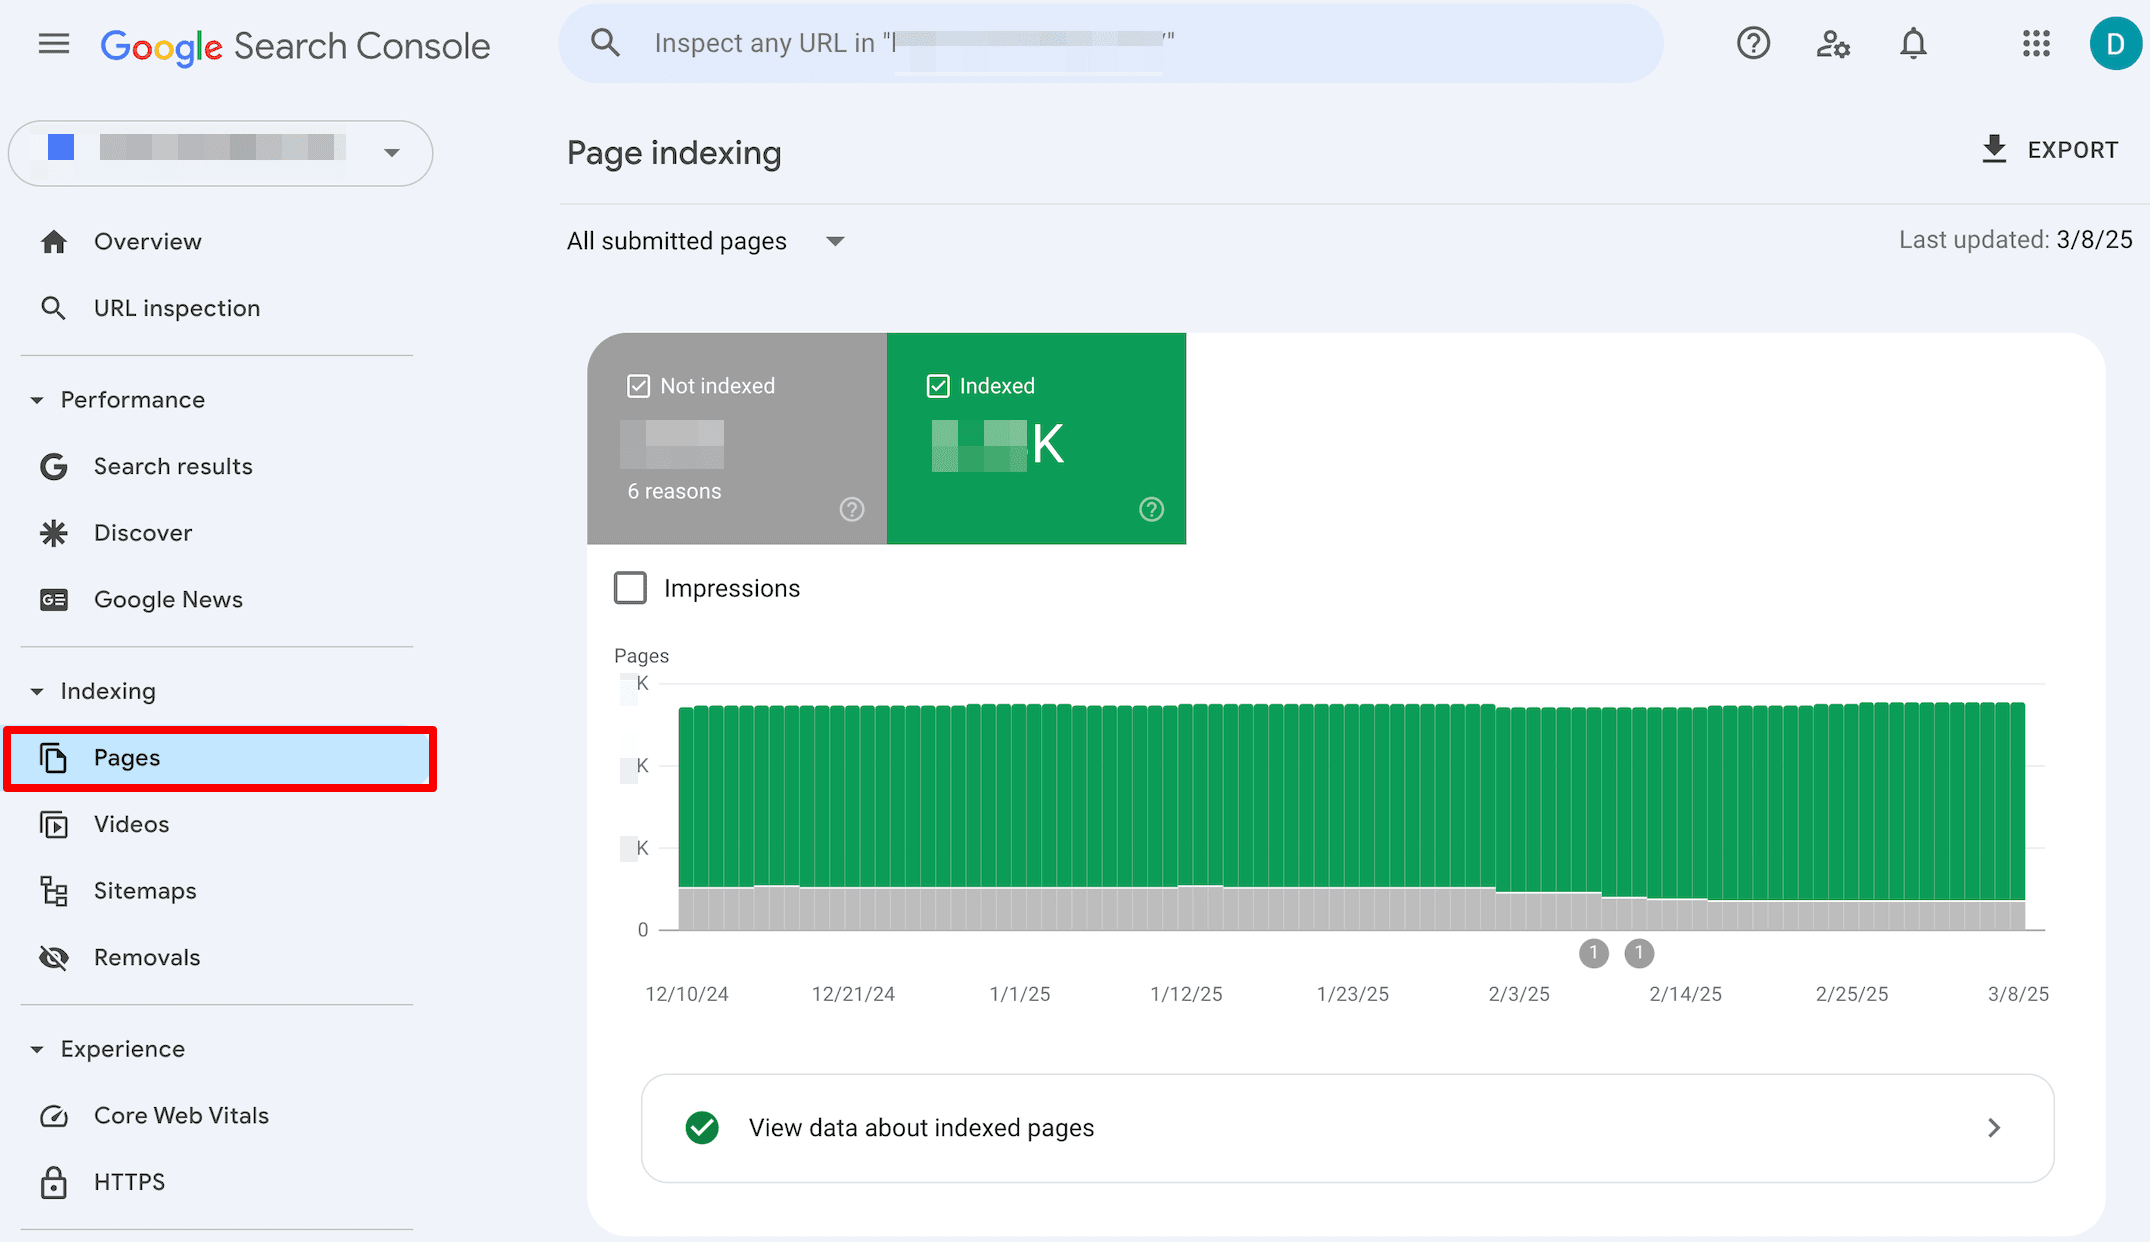
This section displays a graph and the number of indexed and non-indexed (but requested) pages you have. It also displays tables that reveal why certain URLs couldn’t be indexed. This section also suggests various other indexing improvements.
In the top-left corner, you can decide if you want to view:
- “All known pages” with every URL Google discovered by any means.
- “All submitted pages” with URLs submitted via a sitemap only.
- “Unsubmitted pages only” with URLs unsubmitted via a sitemap.
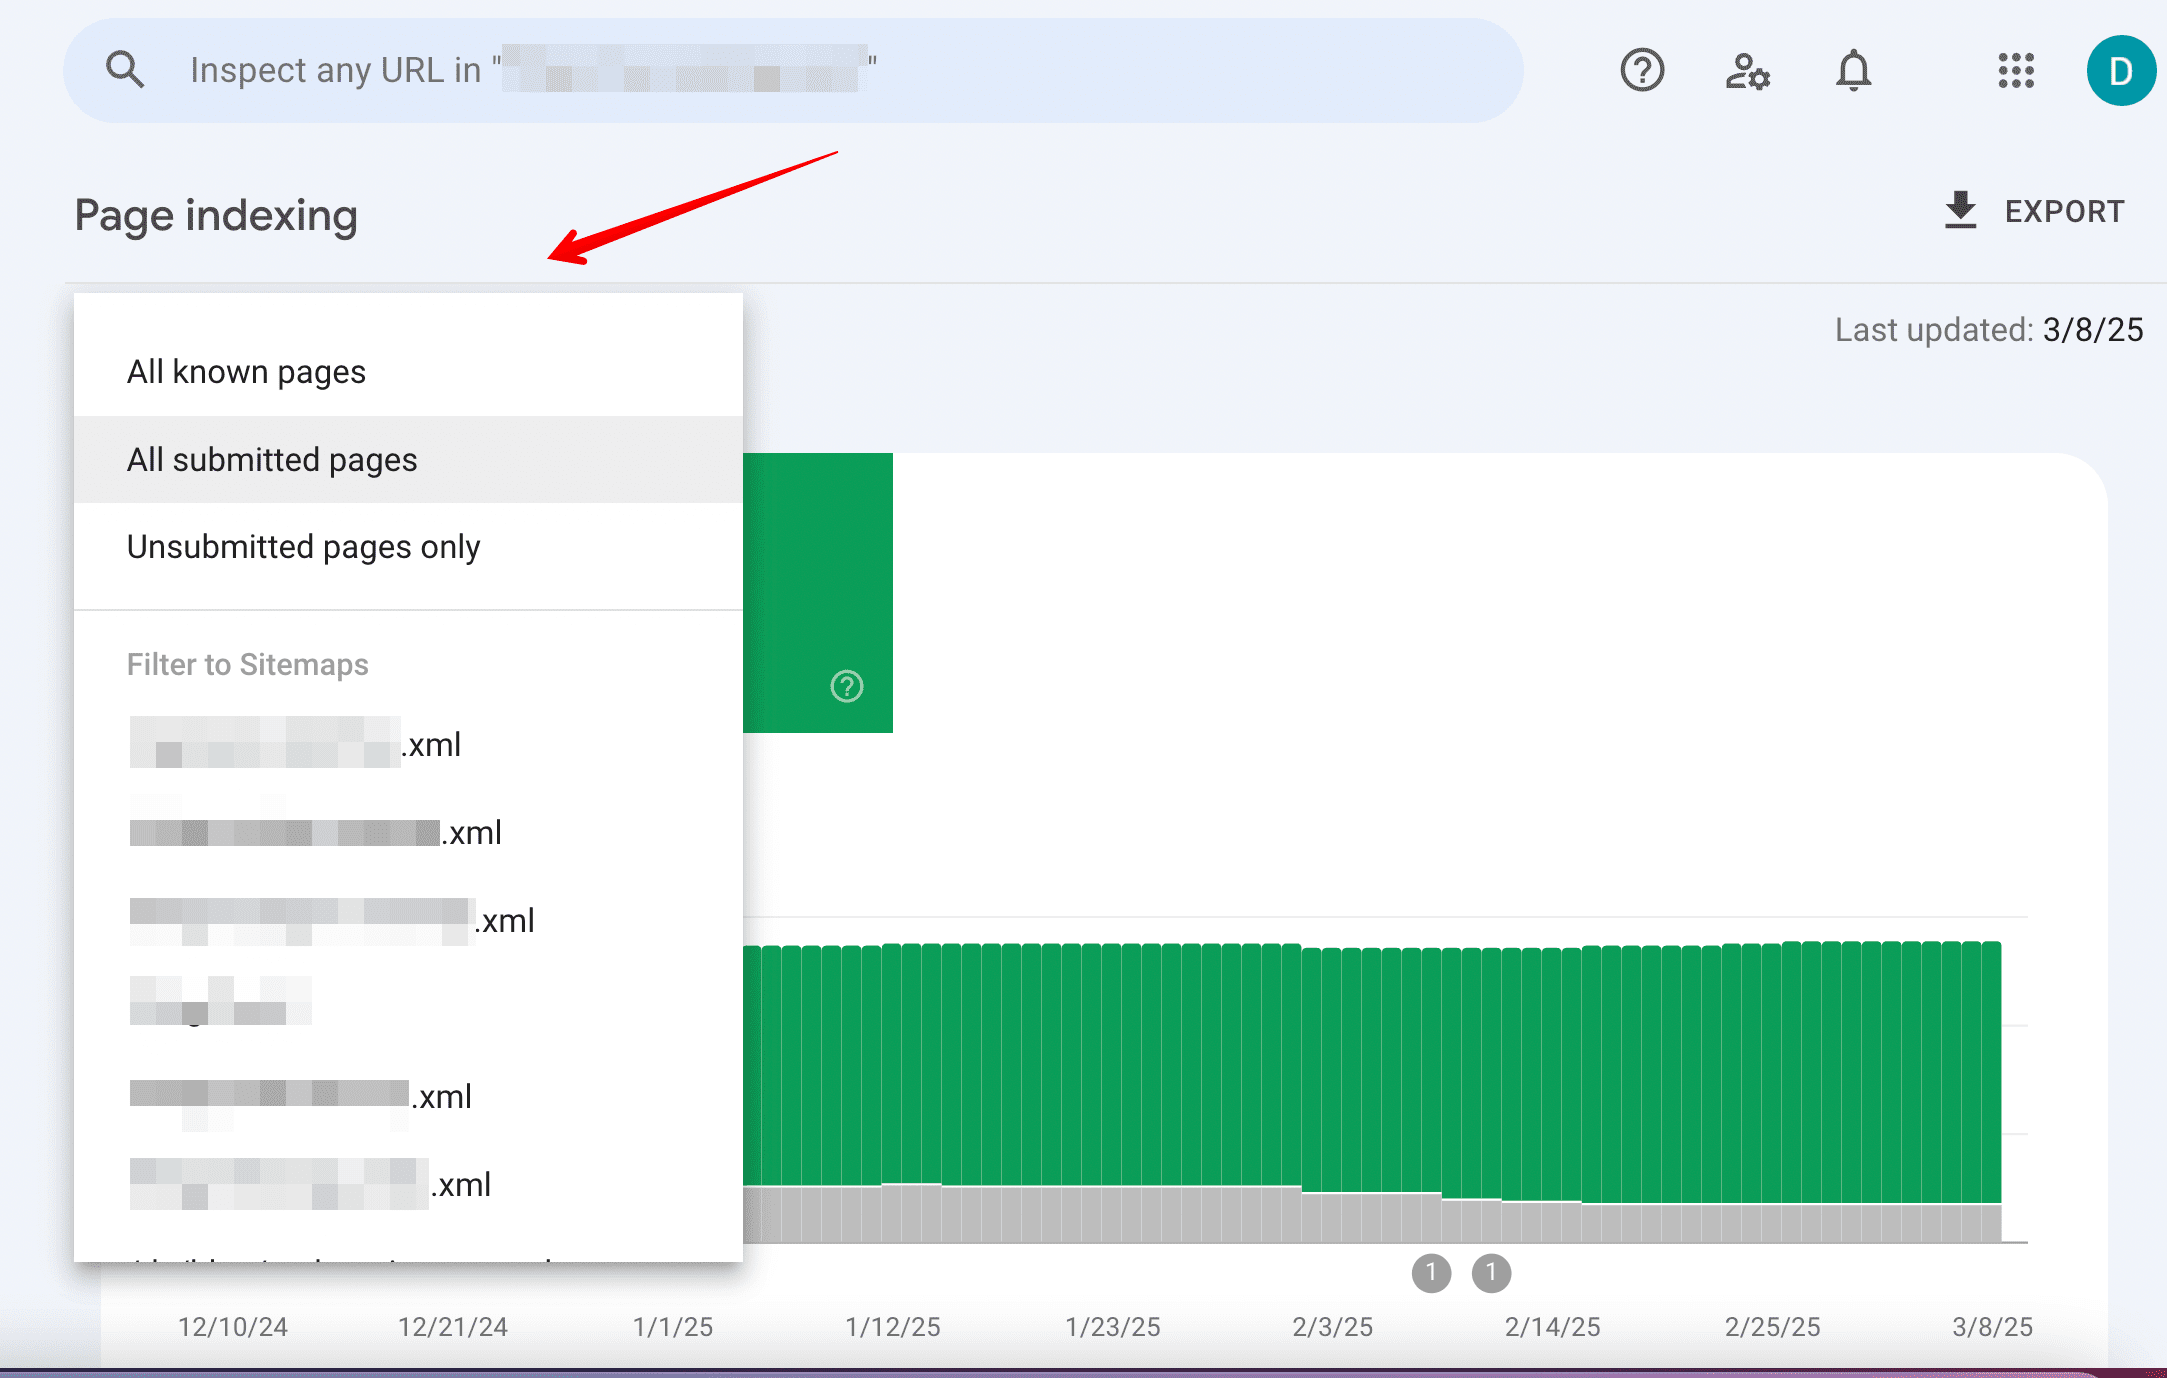
Note that the “All known pages” option generally has more URLs than the “All submitted pages” option. Also, the former includes more URLs reported as Not indexed. This makes sense because sitemaps should only include indexable URLs, and most sites have multiple pages that should not be indexed.
You can also filter results by sitemap.
So, make sure you’re looking at the right list when analyzing URL indexing statuses.
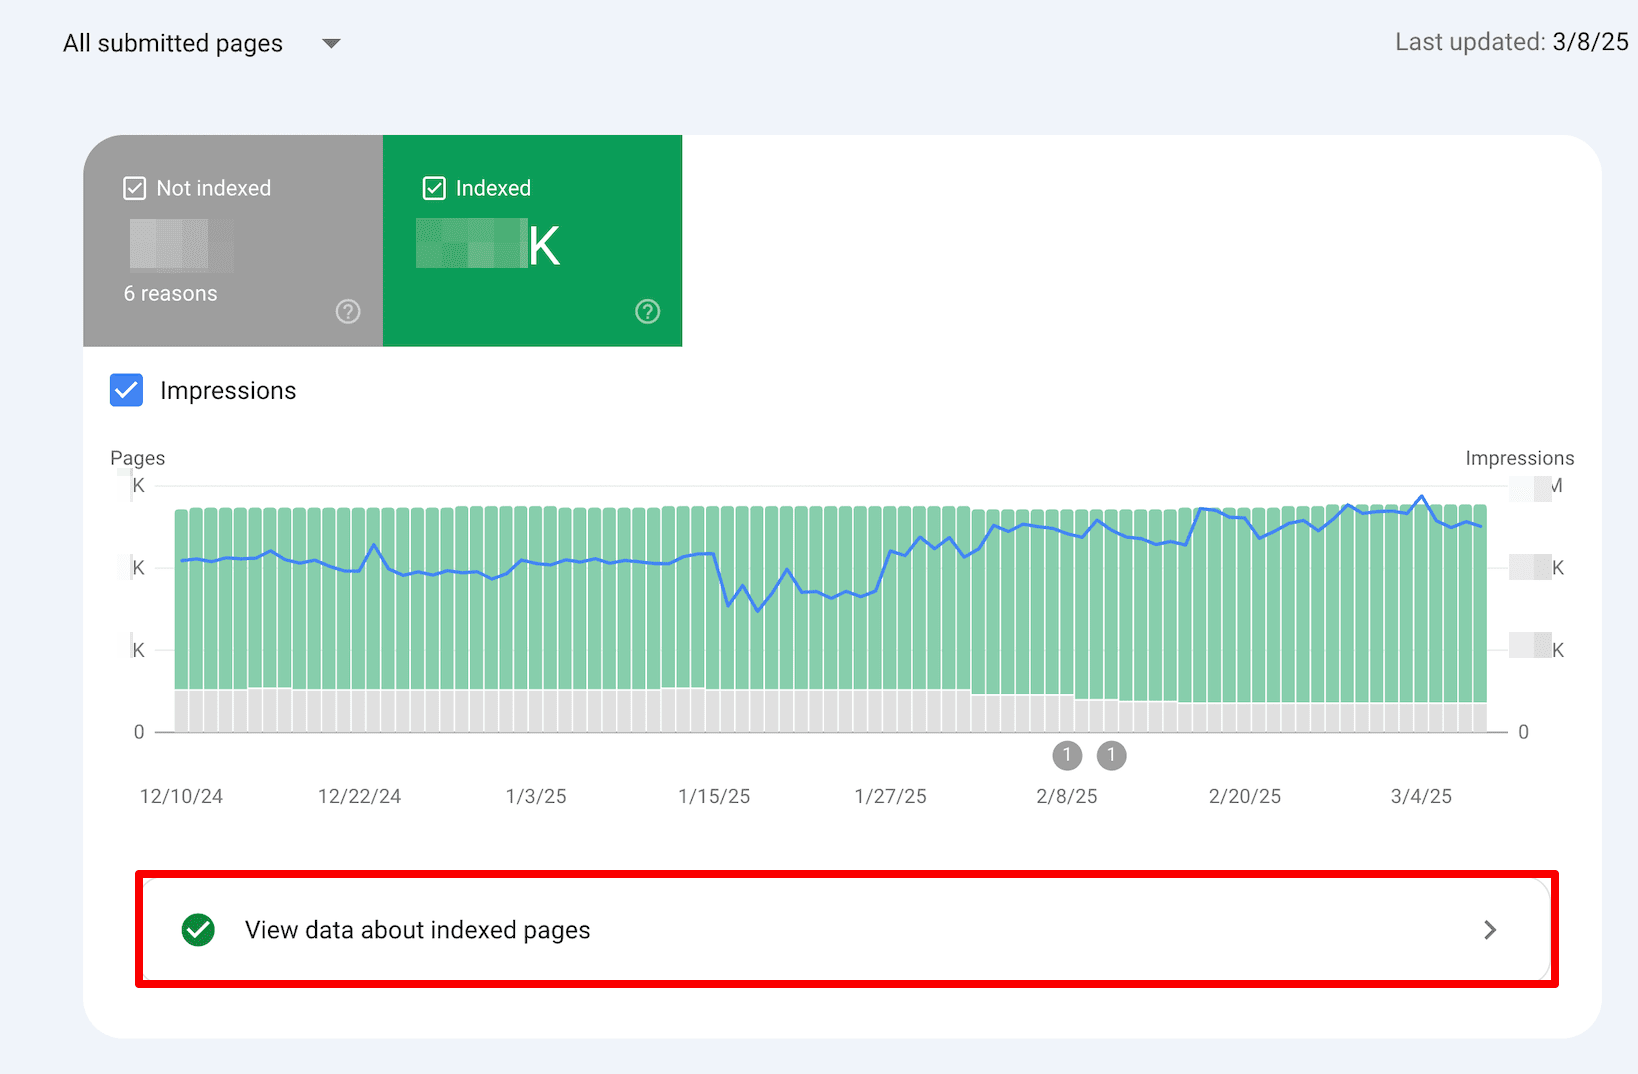
To take a closer look at all URLs indexed within your website, click on the View data about indexed pages section directly underneath the chart.
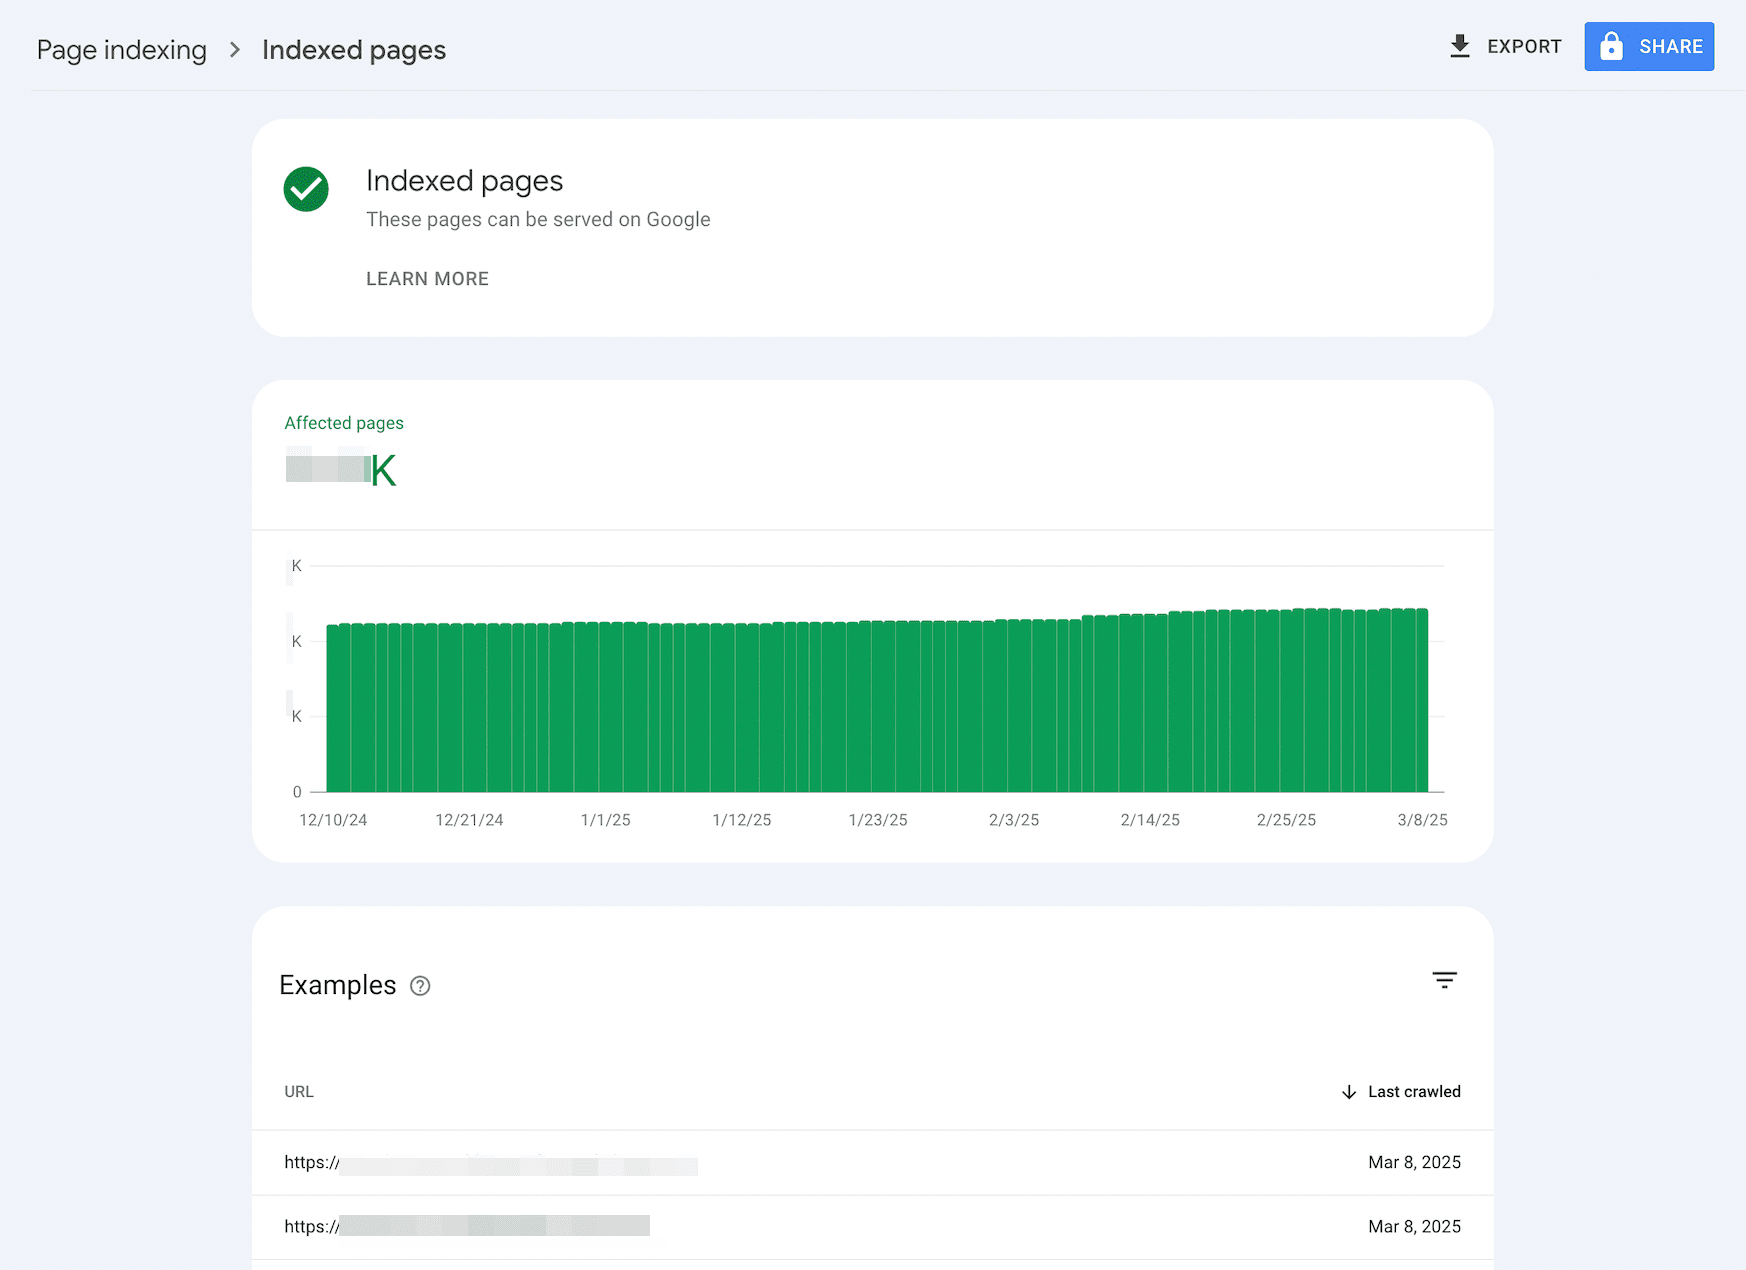
The Affected pages chart displays how the number of indexed pages on your website has changed over time. Below the chart, you’ll find a list of the indexed pages. However, keep in mind that not all of them may be visible to you.
Here are the two main reasons why:
- The report only displays up to 1,000 URLs.
- New URLs may only be added after the latest crawl.
You can filter the list by two parameters:
- By the last crawl. With this option, you can discover the most recently crawled pages.
- By URL. You can check the indexing status of a specific page or category of the site. For example, you can filter the results to show only blog posts.
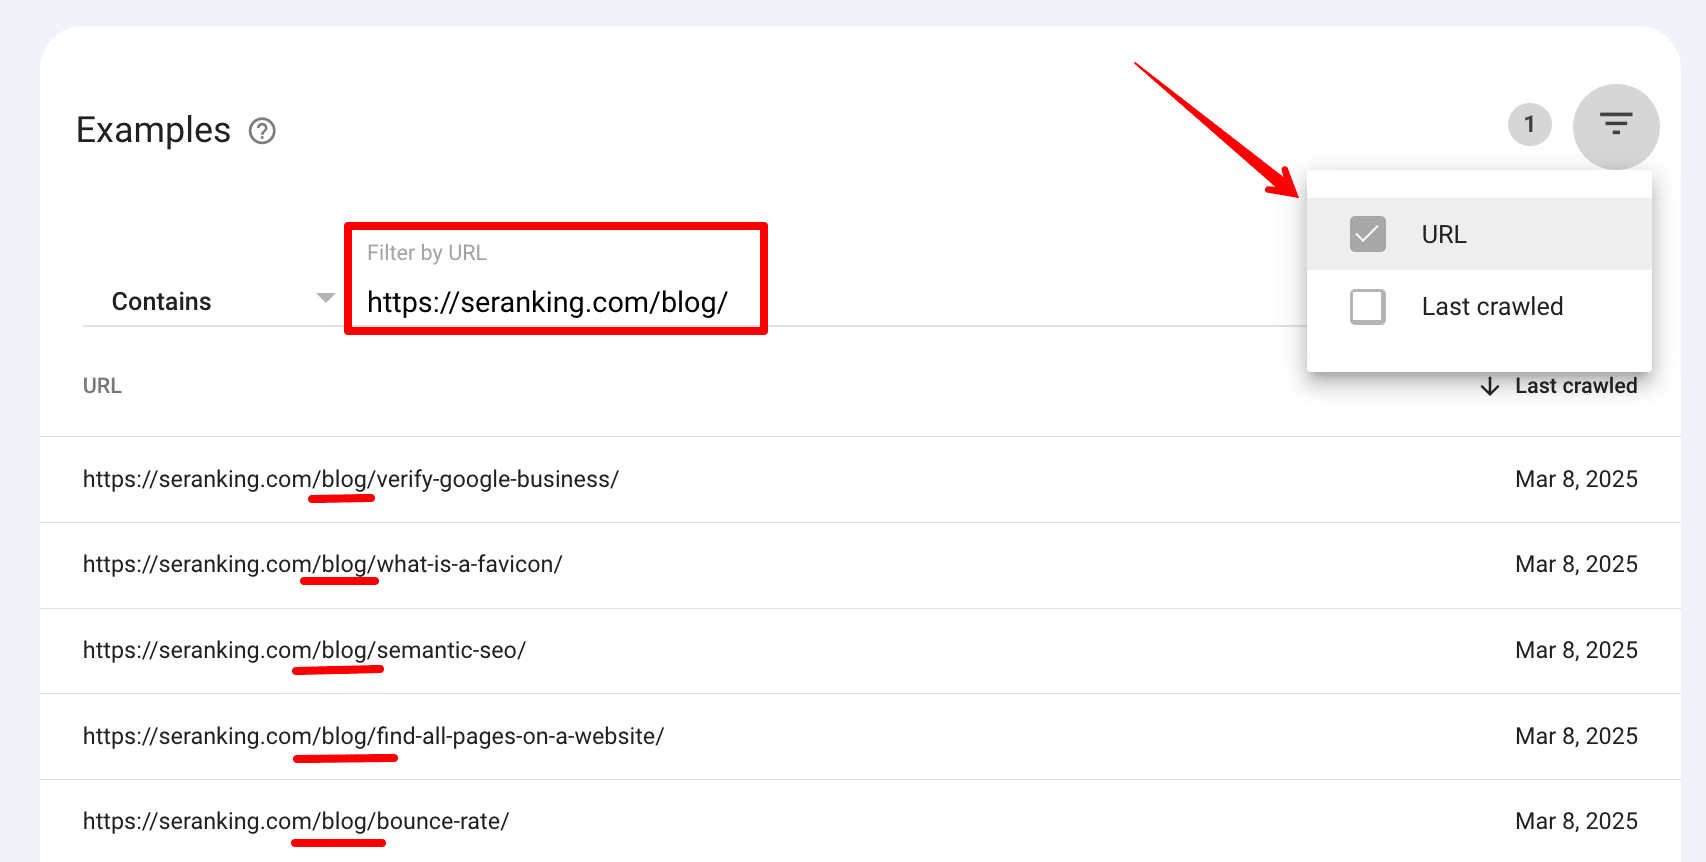
You can also inspect every URL here by clicking on the Magnifying glass icon.

As for URLs that are not indexed, you can get a detailed view of your pages that reveals why they aren’t being indexed. This info is located under the chart in the Page indexing report:
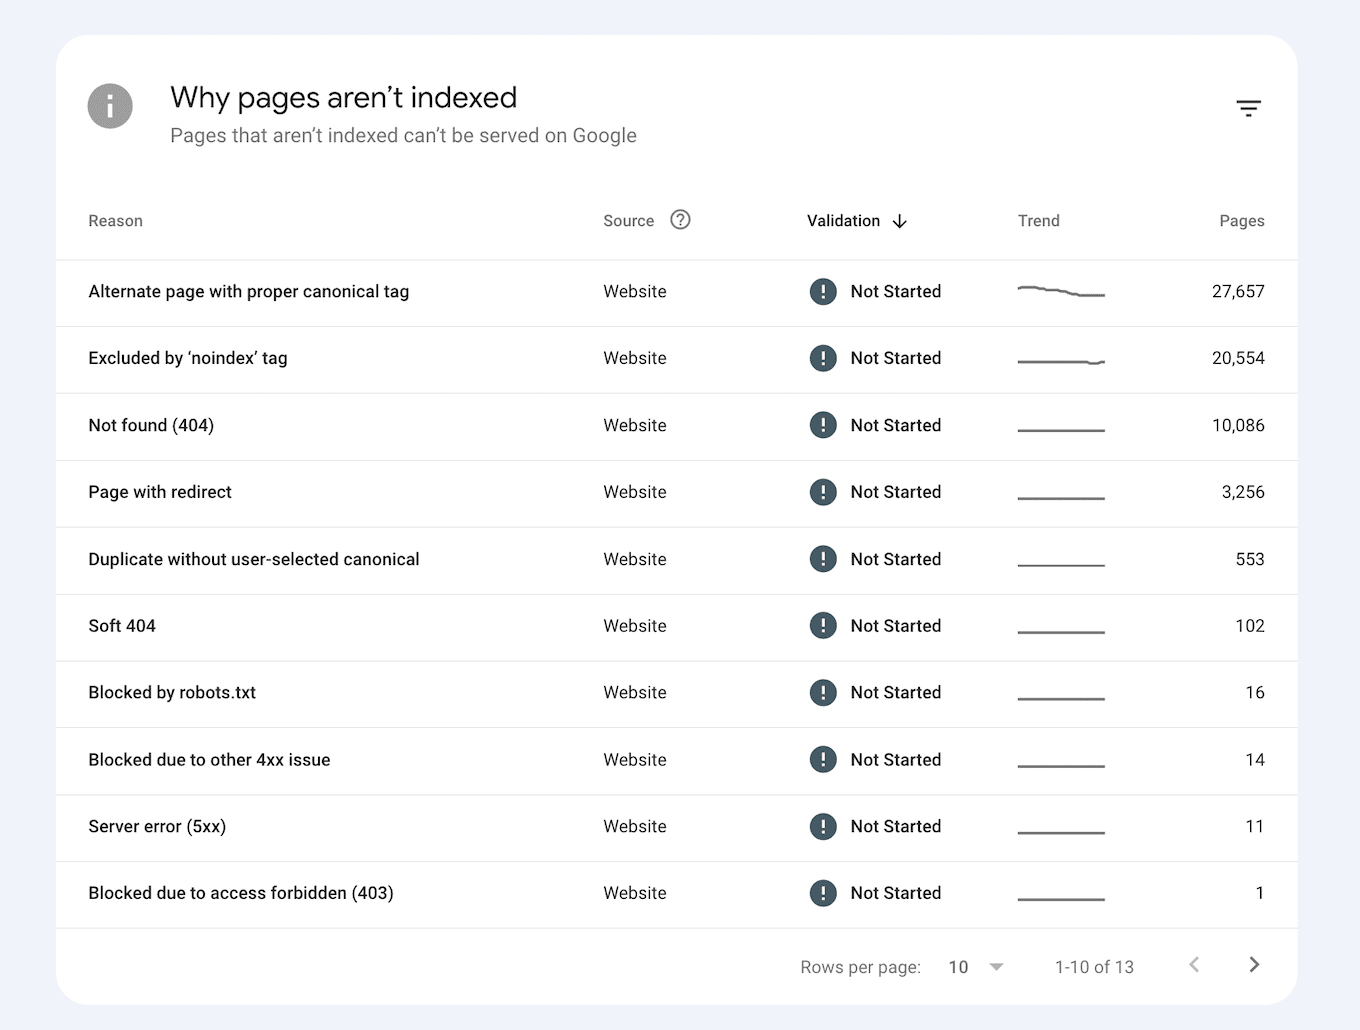
This report reveals the reason behind a given status. It also allows you to discover the source of the problem (whether your website or Google’s system caused the issue), and find out how many pages have been affected in total.
You can also view the validation status. Once you have fixed an issue, let Google know so they can validate the fix. You can do this by clicking an issue at the top of the report:

Although the validation status can appear as “Passed,” these URLs can also show up as “failed”, “not started” or other statuses. If this is the case, double-check them.
Furthermore, the trend for each status is also displayed on the screen. It indicates whether it is going up, down, or remaining constant.
After clicking on an issue type, you will see which URLs have this status and when each URL was last crawled.
Video page indexing report
The Video page indexing report shows how visible your video content is in search results and helps you identify any issues impacting your videos’ ranking.
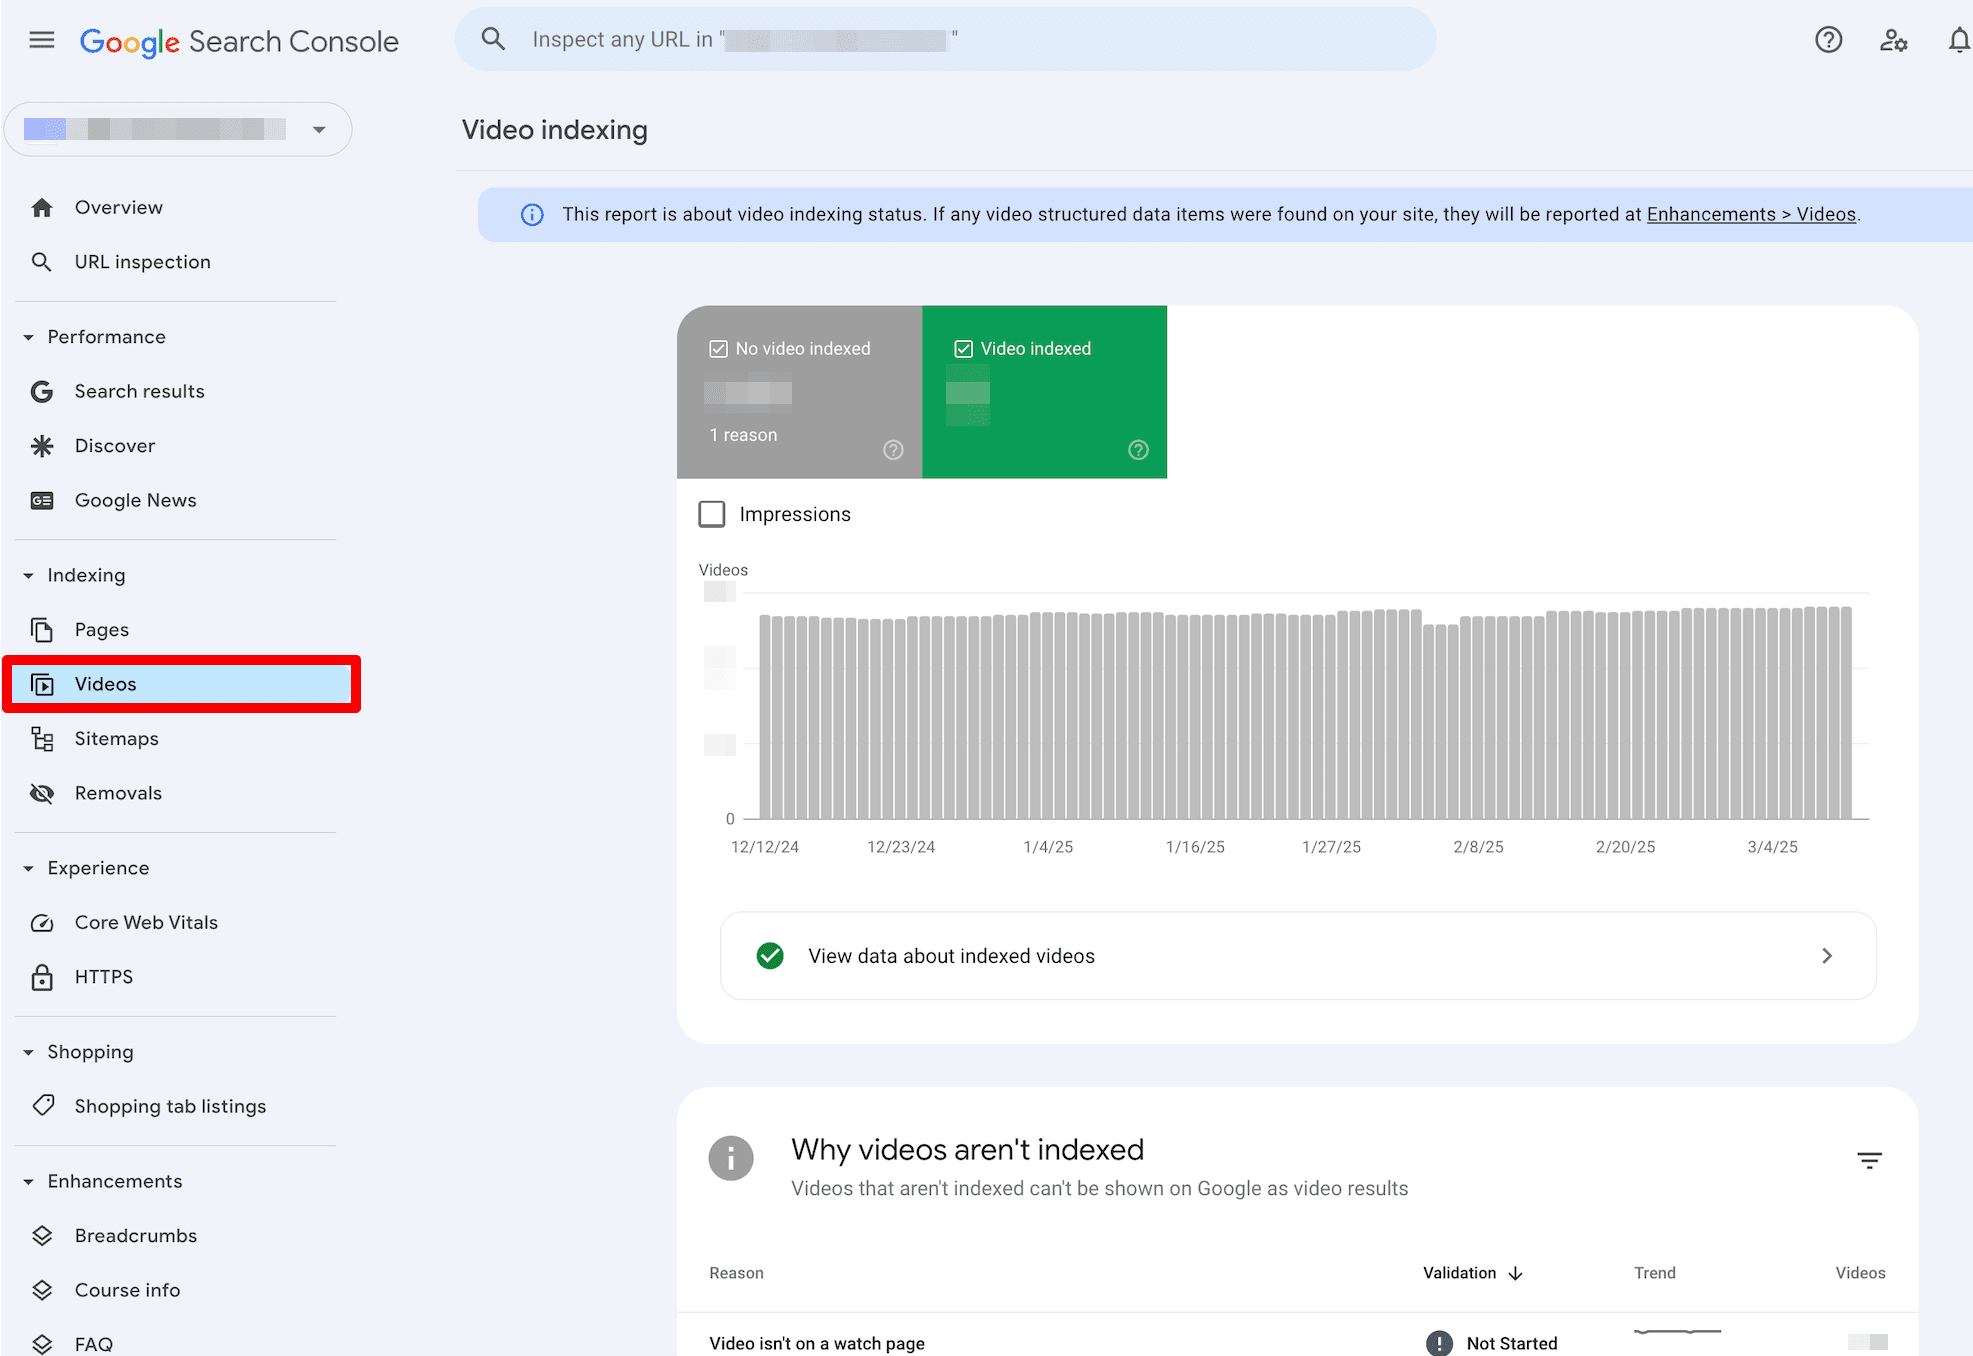
The Video page indexing report shows the following information:
- The number of indexed site pages with at least one indexed video, plus info on the video’s details.
- The number of indexed site pages containing a video that could not be indexed and why.
Note that this report doesn’t always show the total number of unique videos on your site unless certain conditions are met. For example, if your site has a single, unique video on every page, Google may index all of these pages. In this case, the report will reflect the total number of videos on your website.
However, if you have several videos on a single page, or if the same video is present on multiple pages, or if Google is unable to index every page that contains a video, the chart totals will not represent the total number of unique videos indexed on your website.

Here’s what to do when analyzing the Video page indexing report:
- Ensure all videos not considered the page’s main content appear as No video indexed. They will appear in the table below, listed under the reason, Video isn’t on a watch page.
- Ensure that the number of Video indexed combined with the total number of No video indexed is roughly the same as the number of site pages with videos. If this is not the case for you, many pages containing videos aren’t getting indexed on your site.
- If you have a large website with multiple videos, you should see a growing trend in videos over time. If this is not the case, Google is having problems indexing your assets.
Learn more about Video page indexing in Google’s official documentation.
Sitemaps report
The Sitemaps report in Google Search Console is important because it provides crucial insights into Google’s level of success in crawling and indexing your website. It allows you to submit sitemaps, track the submission history, and identify any errors encountered by Google when parsing your sitemap files.
You can submit a sitemap by clicking Add a new sitemap, entering your sitemap URL, and then hitting the Submit button.
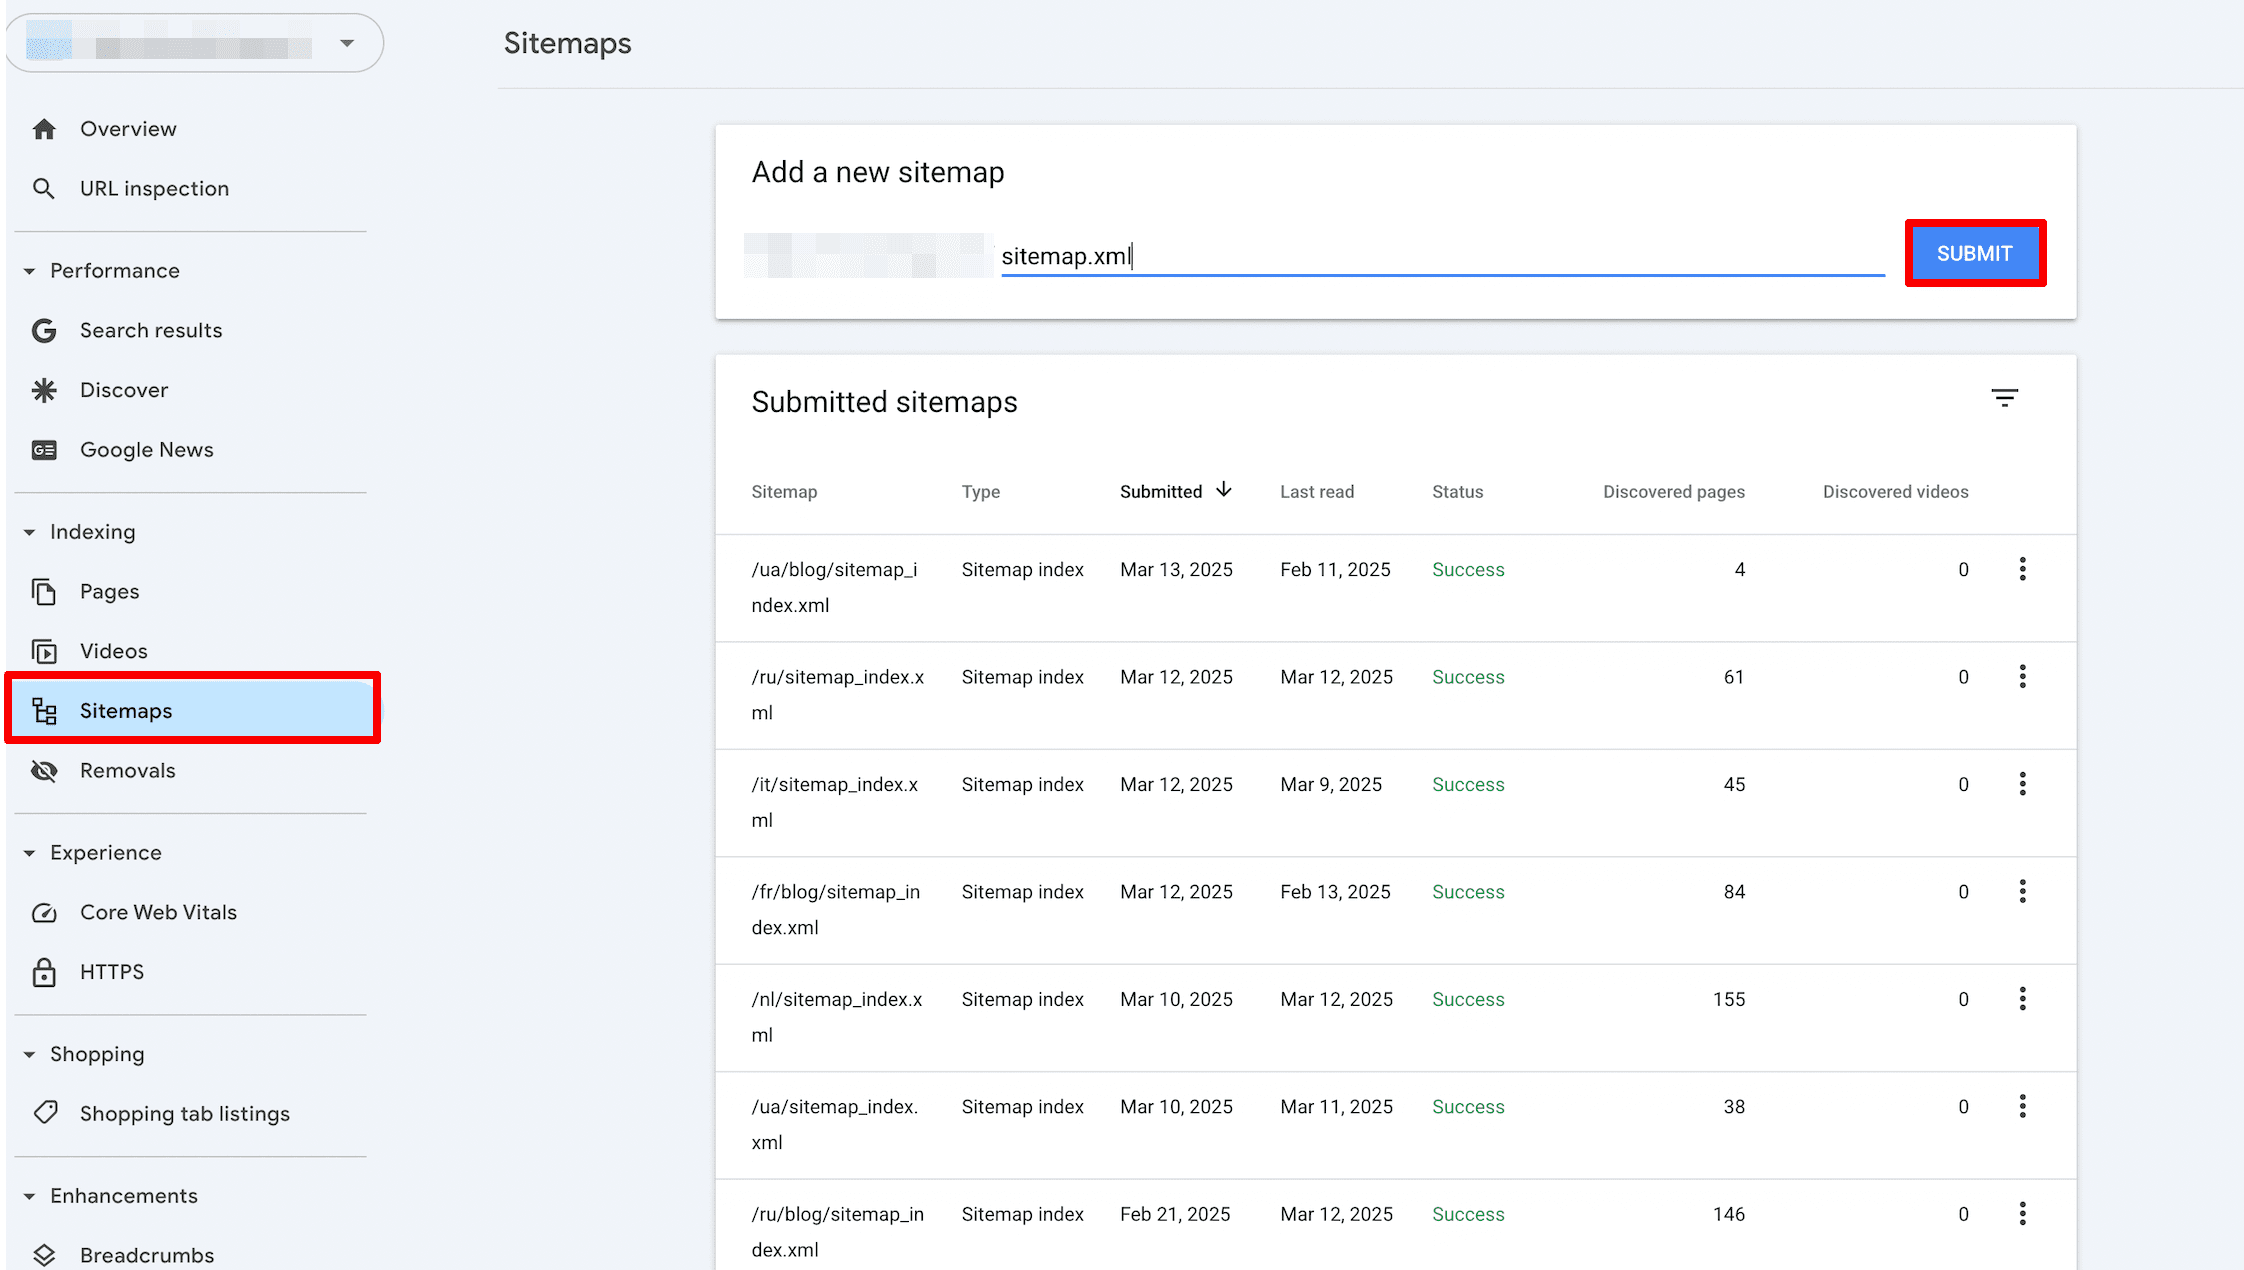
This report shows the URL where the sitemap is posted, the sitemap type, its submission date, and the last time Google processed it. Search Console also provides information on the sitemap’s status, which has three possible values: Success, Sitemap had X errors, and Couldn’t fetch.
If your sitemap’s status is Sitemap had X errors or Couldn’t fetch, use our sitemap polishing guide to find solutions to these issues.
The last two columns include discovered pages and videos. This is where you can see the number of URLs and videos listed in your sitemap.
By clicking on the sitemap and selecting See page indexing, you’ll get a report that shows which of your submitted pages are indexed and which are not. Pay close attention to the issues to fix them on time. If you make significant changes to a sitemap, you can resubmit it with a new request.
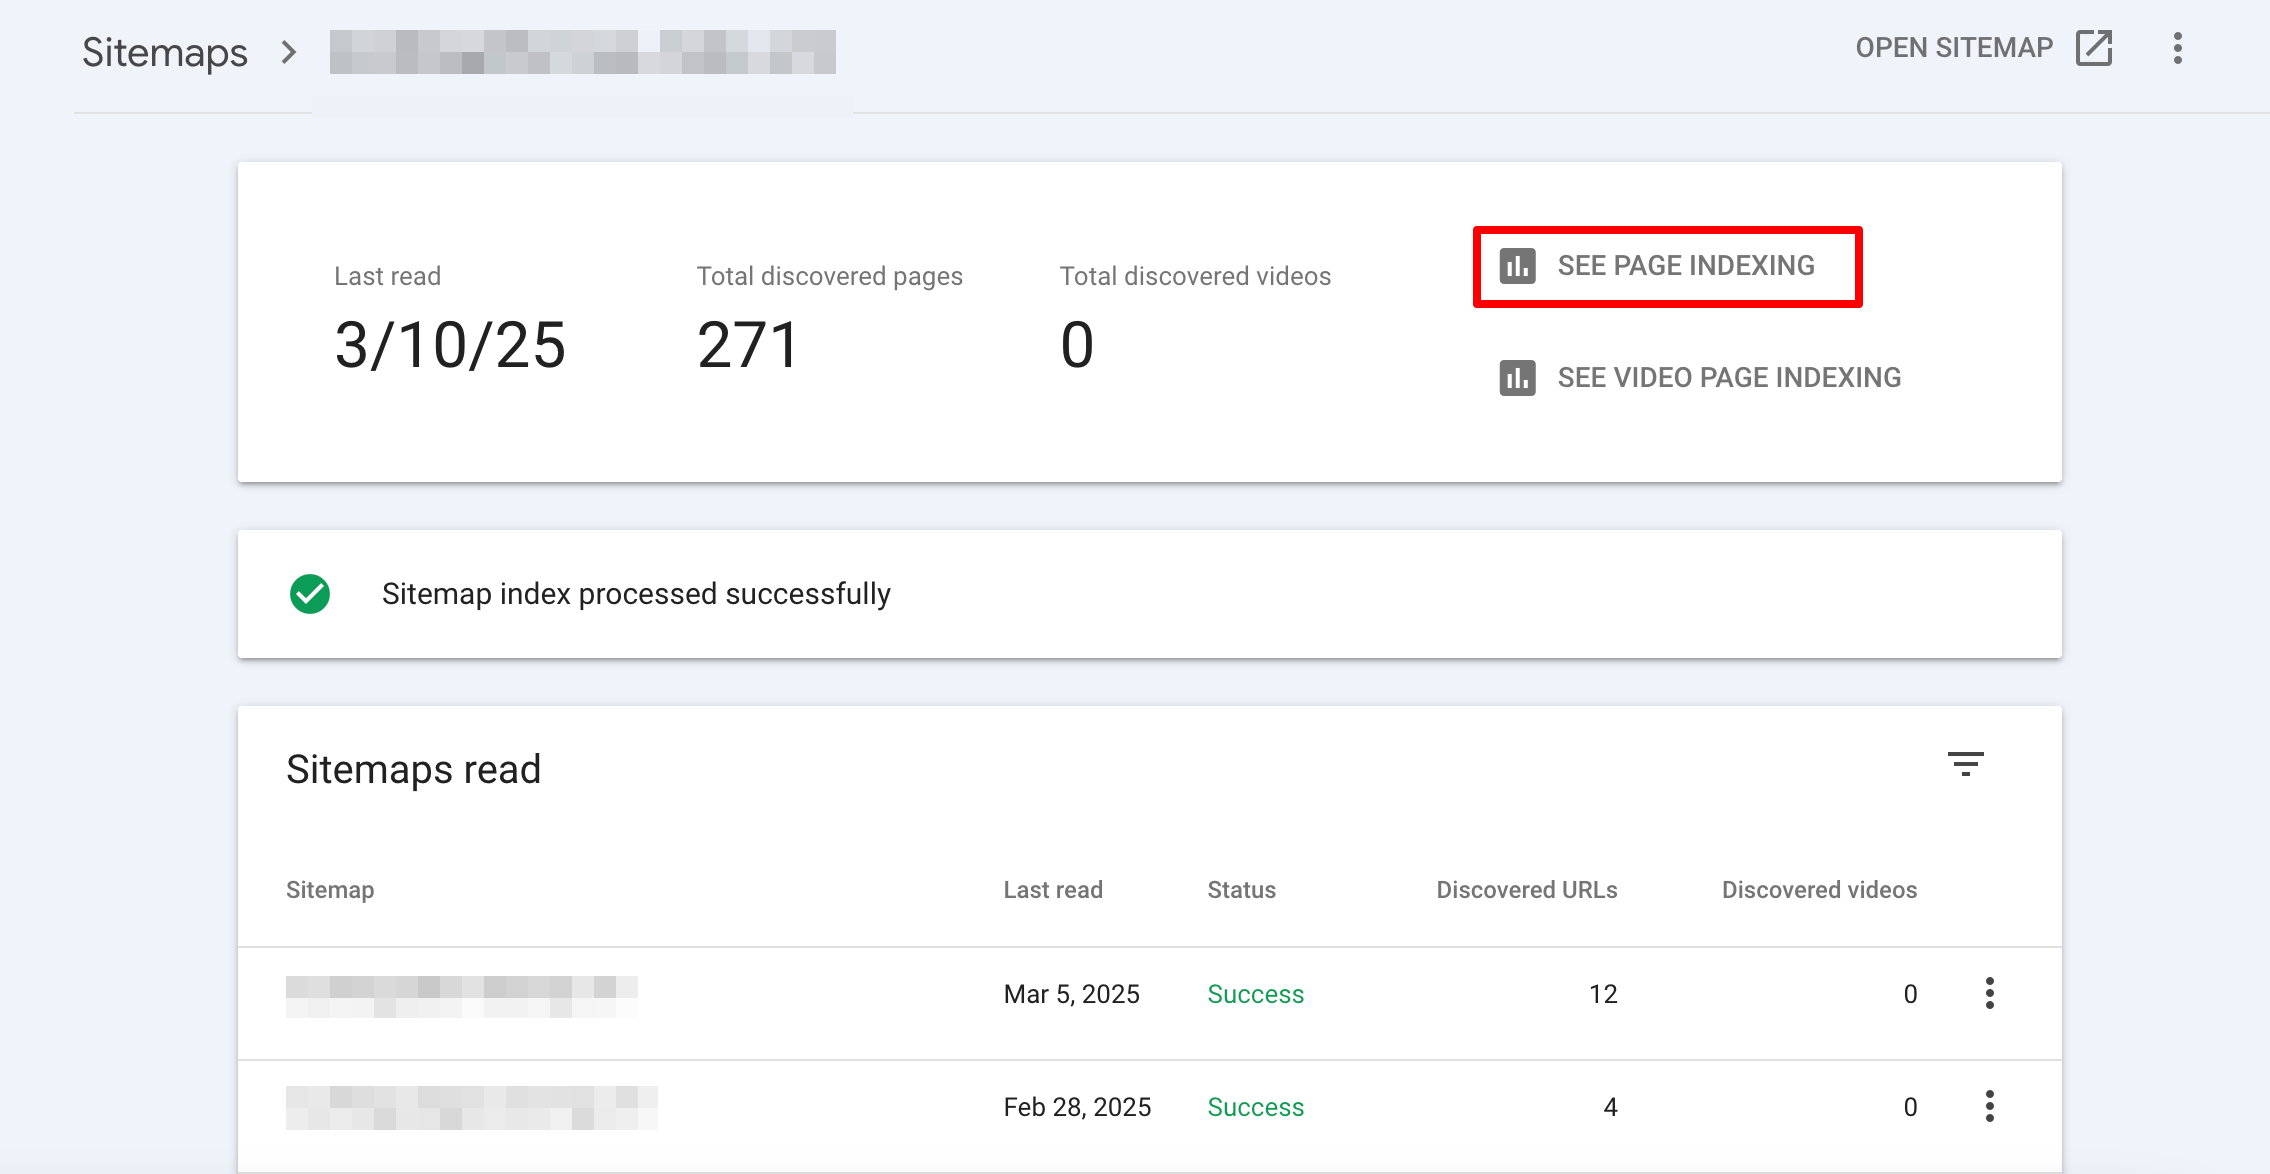
You can also remove the sitemap from the list, but bear in mind that Google won’t forget the sitemap or any URLs listed in it.
Removals tool
To quickly clean up unnecessary content, use the Removals tool. However, consider that it only temporarily blocks the indicated pages from appearing in Google Search results, not from the Internet at large.
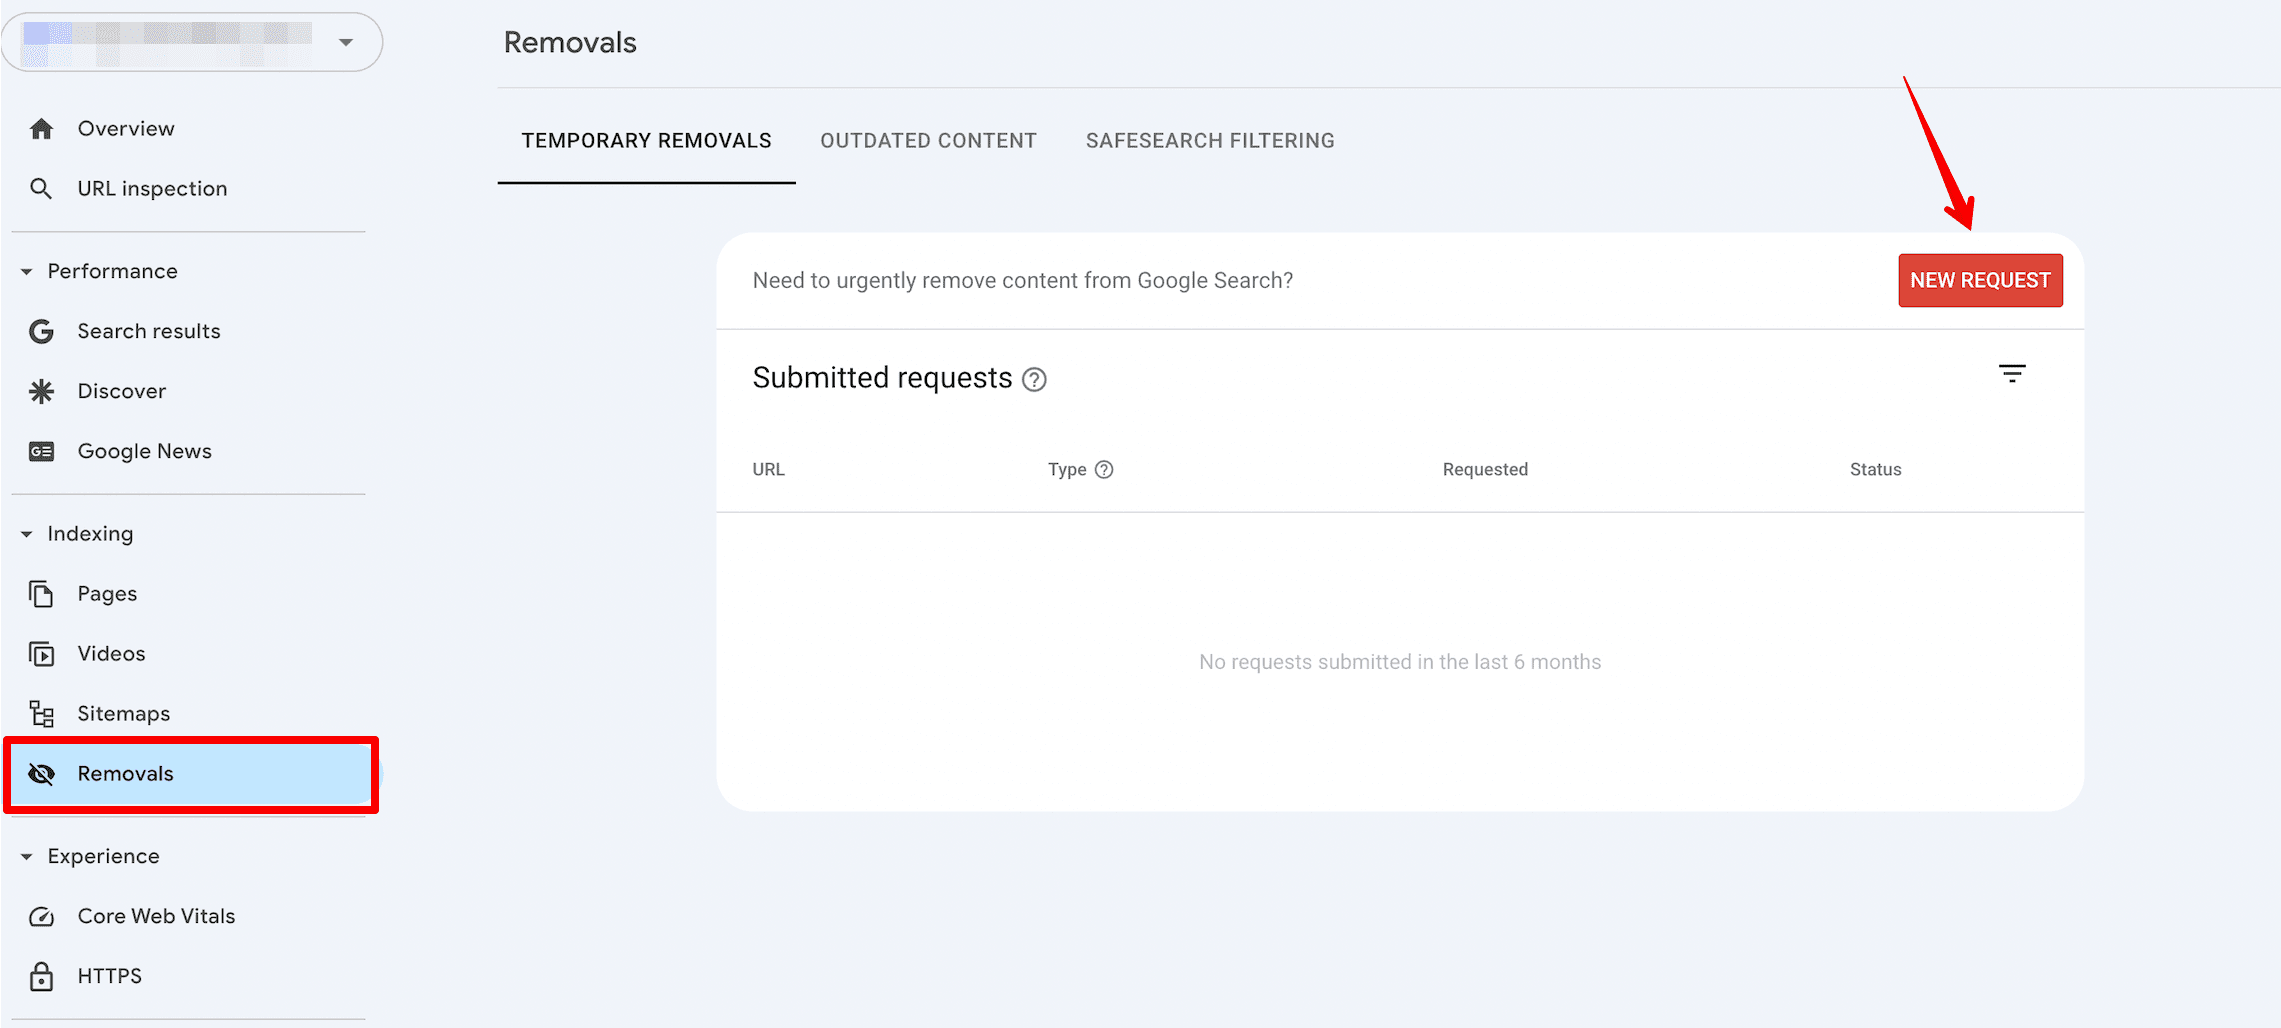
The Removals tool also lets you check the history of removal requests and reveals any URLs that were reported to have adult content. However, you can’t block a page on a website that you don’t own. This tool also cannot permanently remove a URL from search results (only for six months), but you can use it as a reliable first step. To stop specific URLs from being indexed, use the noindex directive.
Core Web Vitals report
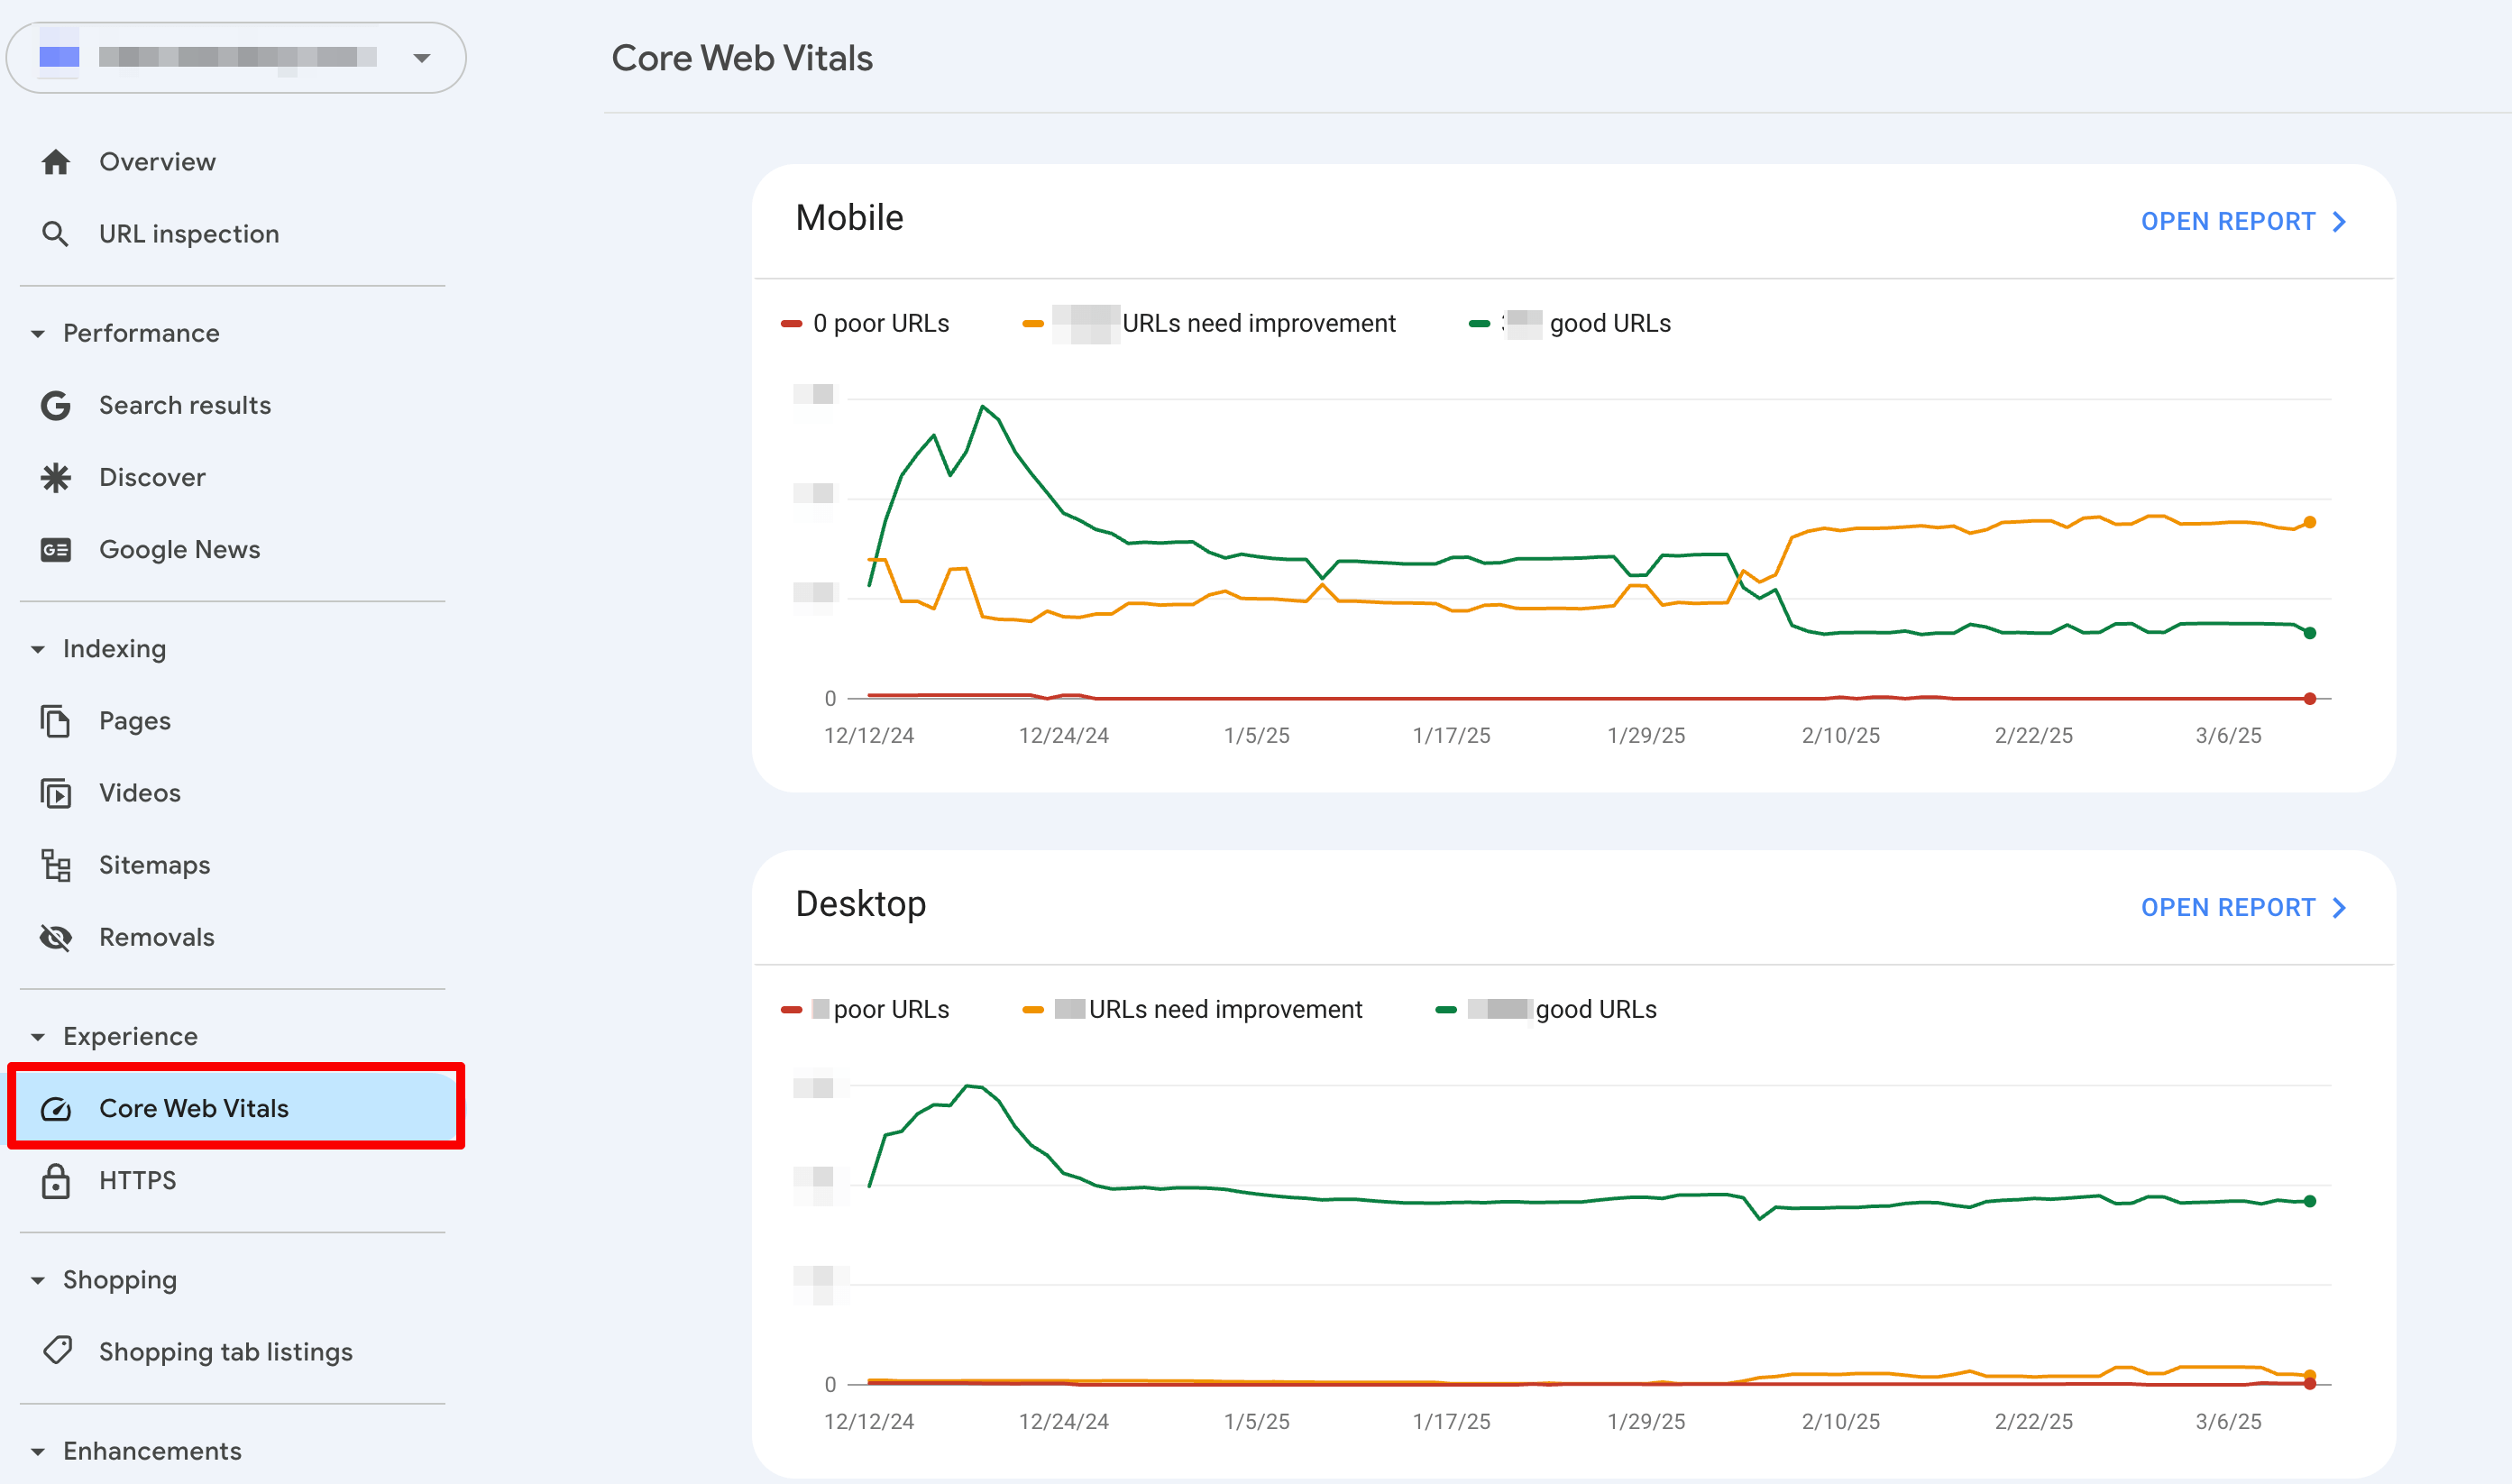
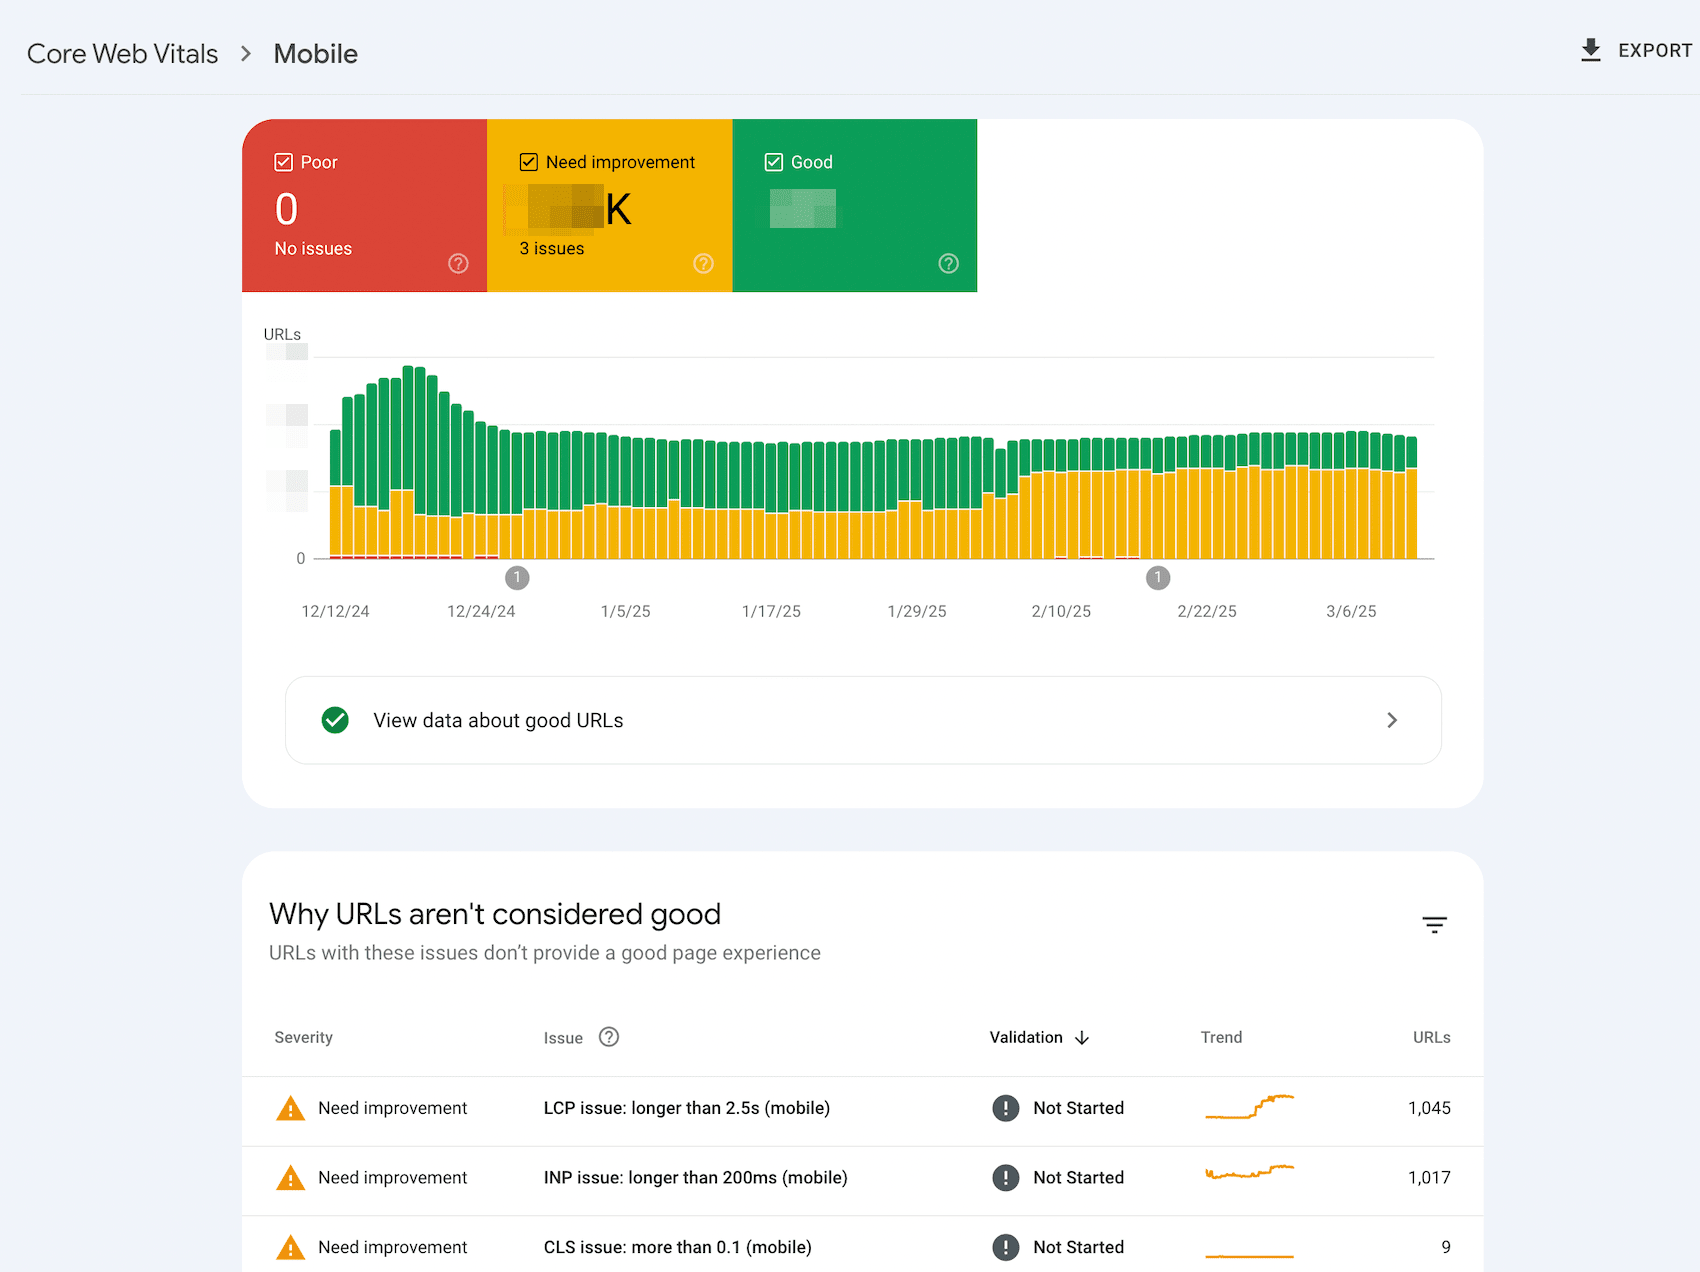
The Core Web Vitals report evaluates the performance of indexed URLs based on their loading speed, interactivity, and visual stability. These are critical Google ranking factors, so to rank high on SERPs, you must address any issues related to them. Stay vigilant. Monitor this report carefully.
Also, the report is divided into Mobile and Desktop sections.
It uses the following parameters:
- LCP: This stands for Largest Contentful Paint, which indicates the amount of time needed to load the largest element (typically an image or video) visible within the viewport.
- INP: This stands for Interaction to Next Paint. It evaluates the page’s overall responsiveness to user interactions by measuring how quickly the website responds to actions (i.e., clicks or key presses).
- CLS: This stands for cumulative layout shift, and represents the total number of individual layout changes.
To put it in simpler terms, the first render should load fast, be stable, and quickly respond to users’ actions.
After GSC evaluates the URL using LCP, INP and CLS metrics, it gets one of the following statuses: Poor, Need improvement, or Good.
To see how your website’s URLs perform, first open the full Mobile or Desktop report. From there, you can either review data for URLs that are performing well (Good) or scroll down to see which URLs are categorized as Poor or Need improvement.
HTTPS report
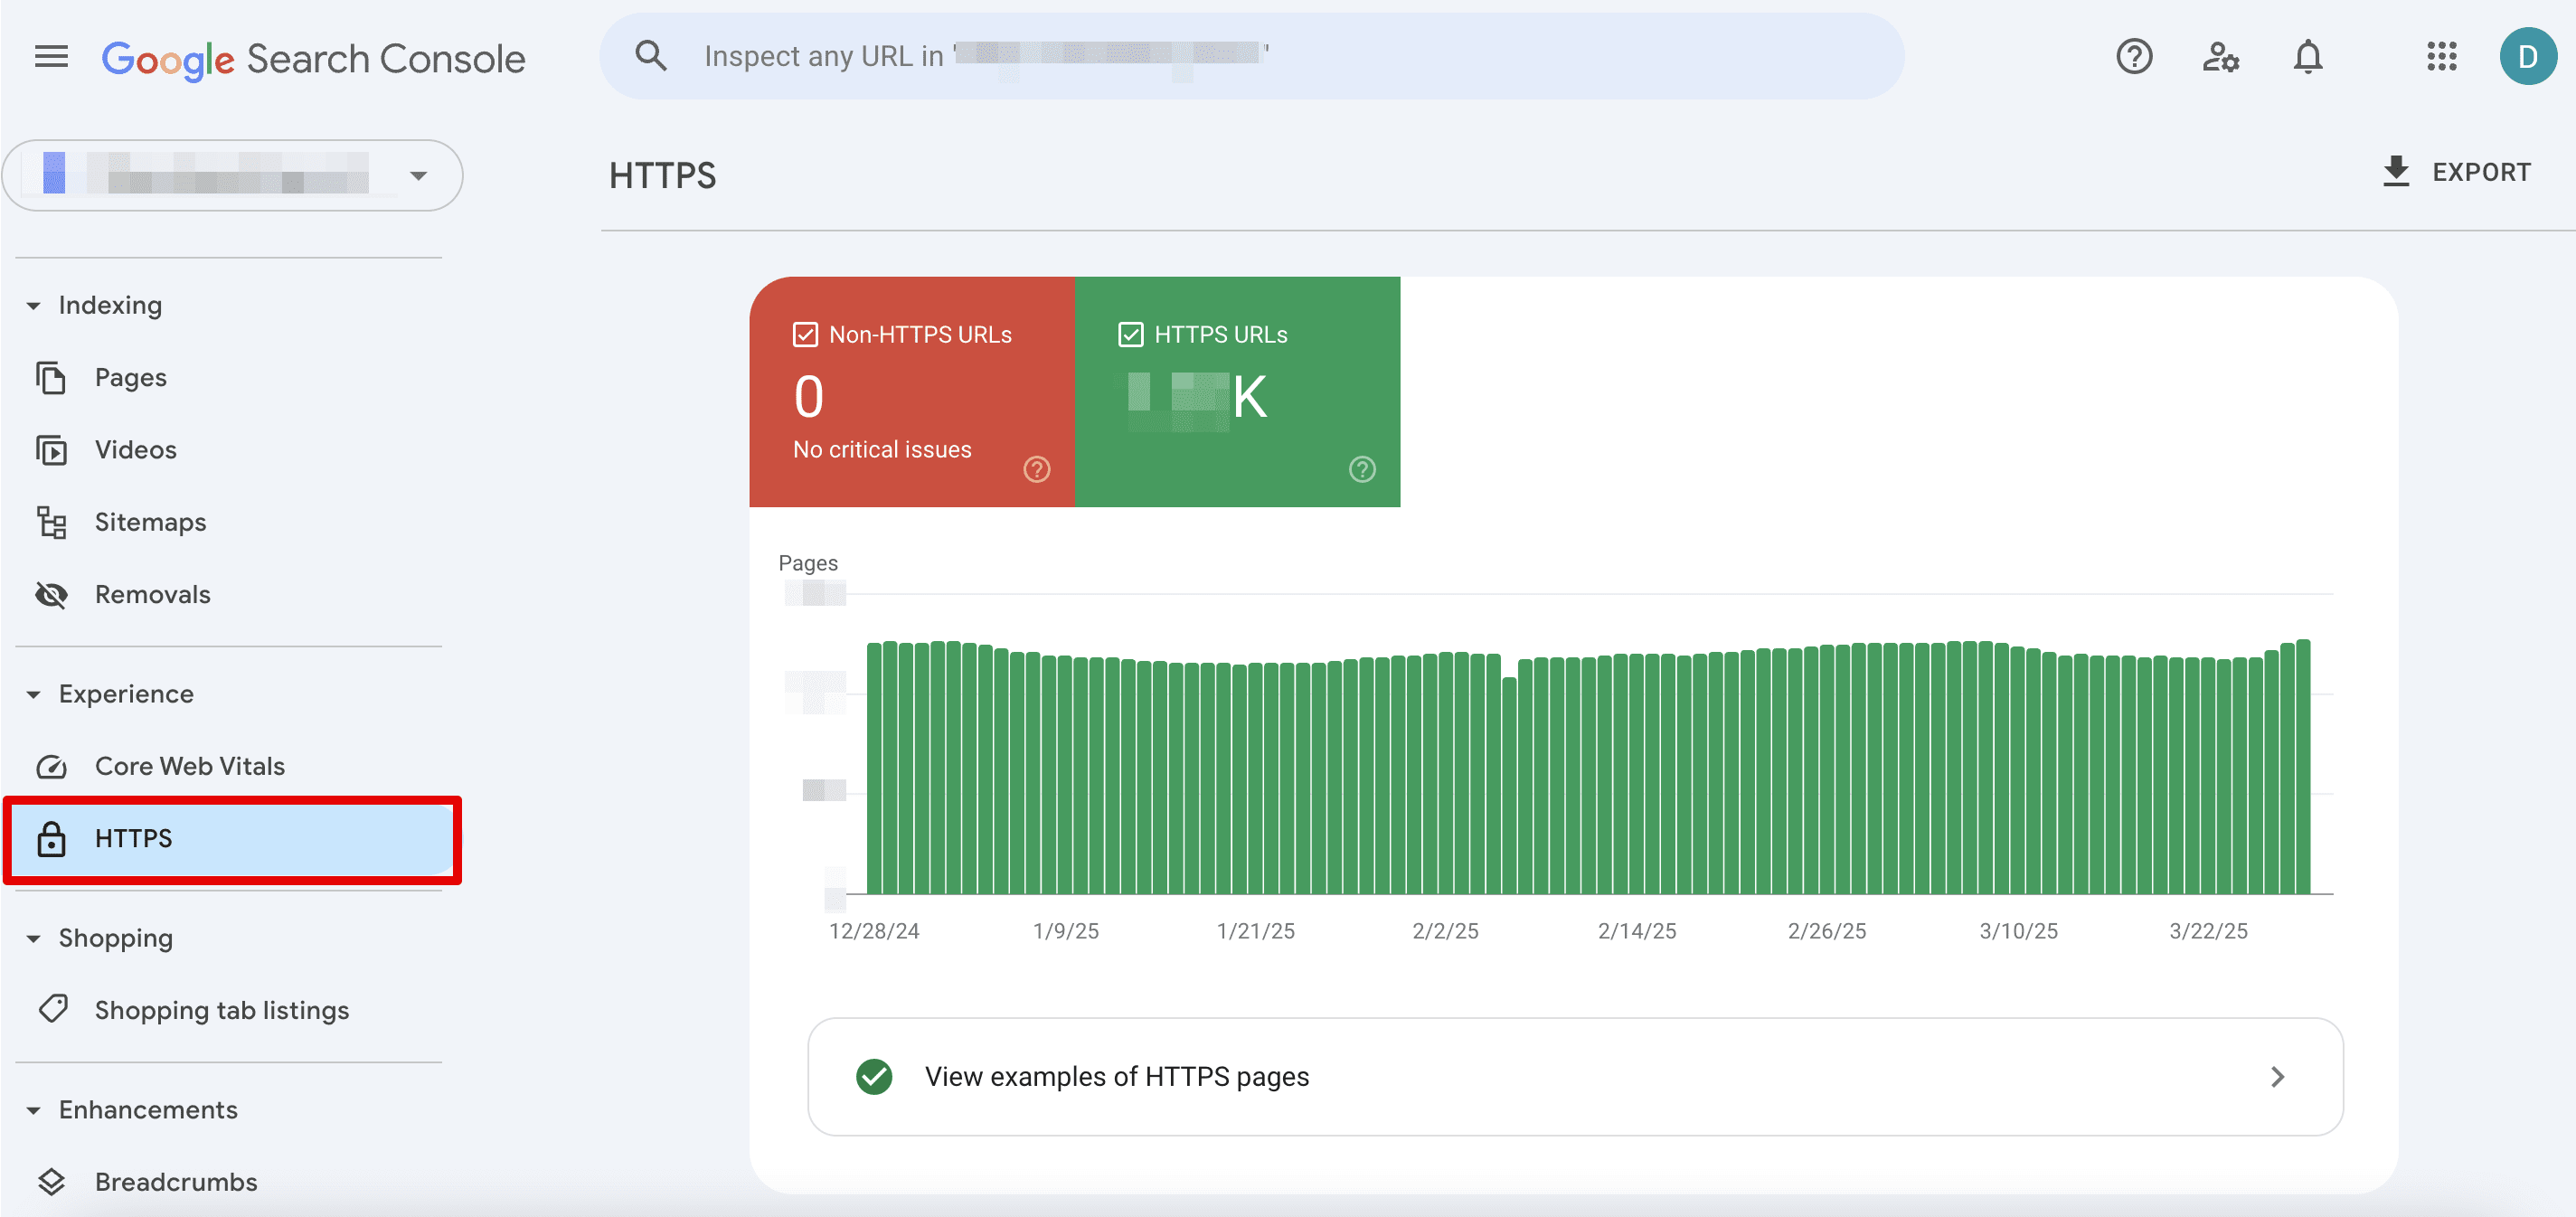
The HTTPS section can show you if you have security issues. If there are no problems, the website is reported as Good. If it’s an HTTP URL-prefix site, the resource will be categorized as Failing, and the HTTPS report will not be available. To view details, click on the section and move to the HTTPS report.
Shopping reports
Shopping reports assist ecommerce website owners in effectively showcasing their products on the Google Shopping tab. These reports enable you to track the visibility and performance of your product listings, identify any issues or errors, and optimize your product data accordingly.
To view this information, connect the Google Merchant Center with Google Search Console.
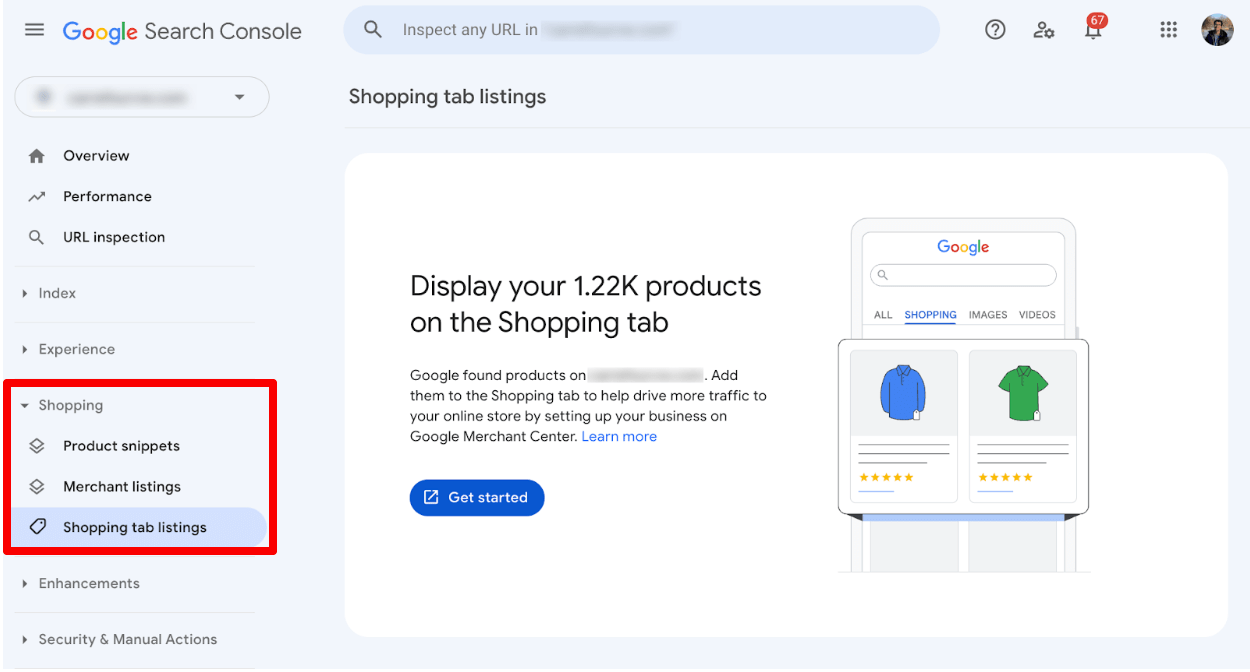
You can see one or more of the following reports here, but what appears will depend on the type of structured data Google discovered on your website:
- Product snippets: This report is accessible if Google found the Product Snippet structured data on your site. This pertains to pages that provide product review information or aggregate product data from various sites.
- Merchant listings: This report is for the Merchant Listing structured data discovered on your site. It pertains to pages that sell products.
- Shopping tab listings: If your items are present or could qualify to appear in the Shopping tab of Google Search results, you’ll either find information on your listings here or receive instructions outlining how to get your products to appear there.
Enhancements report
SERP features with structured data stand out from the typical list of pages and are more likely to be clicked. If you don’t make proper use of structured data on your website, you risk missing out on additional traffic.
Under Enhancements, you’ll find individual reports for each type of rich result that Google discovered on your site. These reports also include any issues Google encountered during parsing. Use this section to quickly fix issues preventing Google from properly crawling and displaying pages in search results.
Search Console provides reports on the 26 following rich result types:
- Breadcrumbs
- Course info
- Education Q&As
- Events
- FAQs
- Hotels
- Image metadata
- Job postings
- Merchant listings
- Product snippets
- Profile pages
- Q&As
- Recipes
- Review snippets
- Special announcements
- Vacation rentals
- Videos
- And many more, which you can find in Google’s documentation
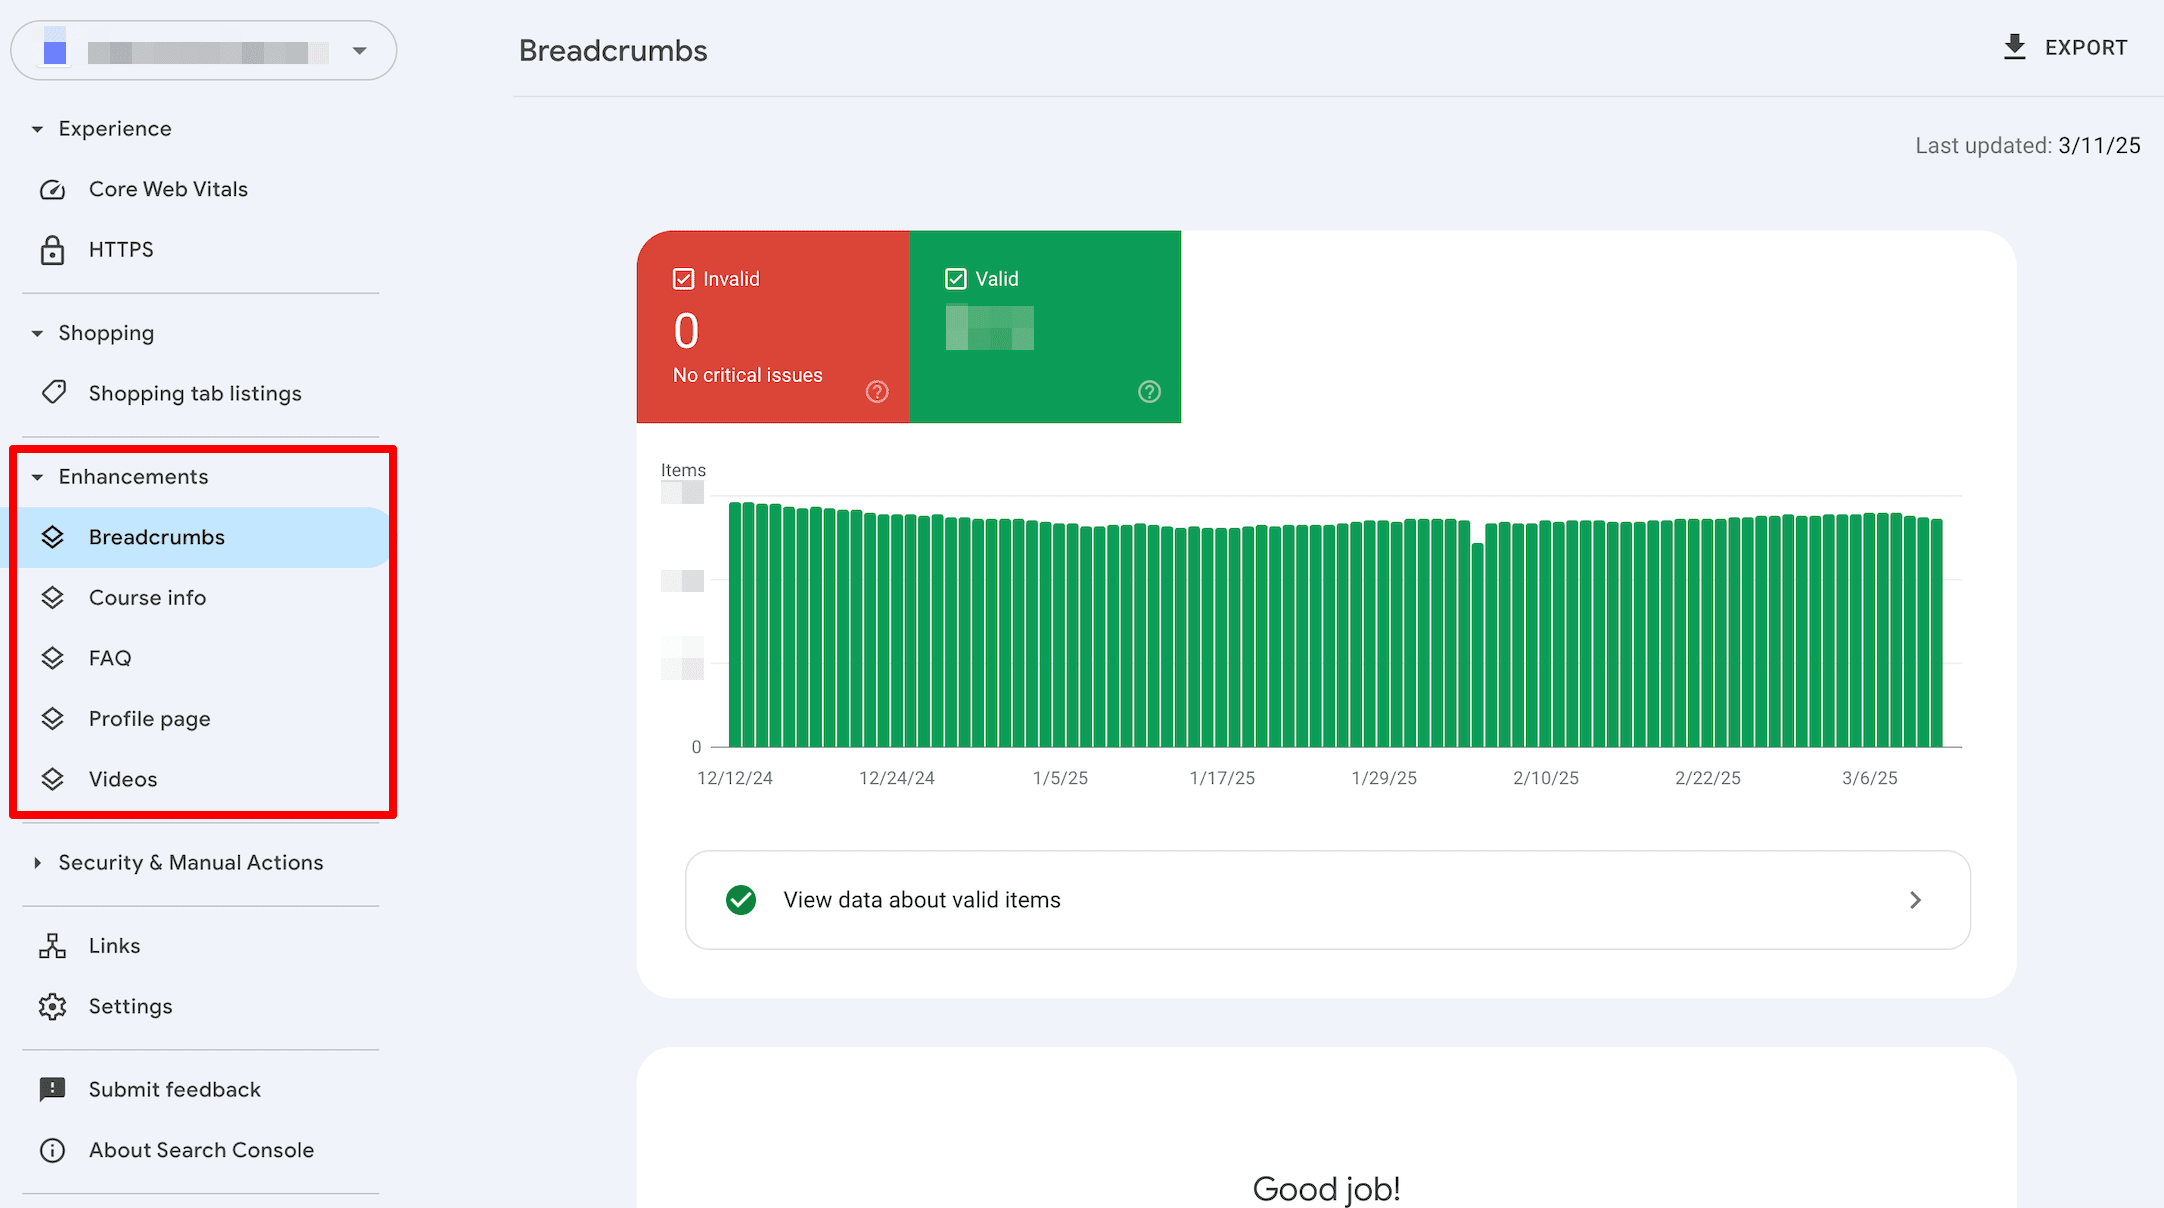
Aim for a 0 count of invalid errors, as shown in the screenshot above. Warnings won’t disqualify your rich results from appearing in Google Search with special features, but they may lead to a slightly less optimal user experience.
Note: The numbers in the report count items, not pages. One page can contain multiple structured data items.
Additional Google Search Console tools and reports
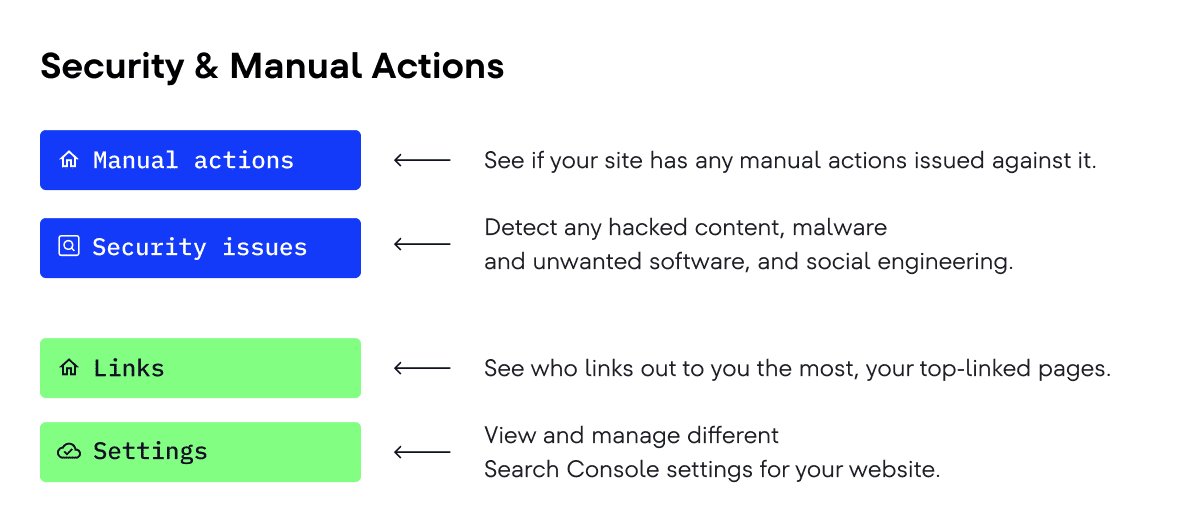
Google Search Console offers other vital tools and reports not displayed on the Overview page. This includes Security issues, Manual actions, Links, and Settings.
Manual actions report
The Manual actions report shows you if your website was affected by any penalties from Google reviewers for violating Google’s spam policies. Since manual action usually results in pages being ranked lower or even omitted from Google search results, it’s important to know your site’s history.
Manual actions might be taken due to various reasons. For example, if you’re getting spammed by site visitors who are aggressively promoting their business, Google may penalize your website. Websites in so-called gray niches sometimes add links to their company website on forum pages or user profiles of other sites. While their business gains more visibility, your site becomes spammy. To prevent this, you must always monitor suspicious user activity on your website.
Google also punishes sites for publishing low-quality content, plagiarizing content, or adding too many keywords to text. The keywords in your text must always look natural, and your content should carry genuine value for users.
To see the full list of manual actions and how to fix them, visit the Search Console Help Center.
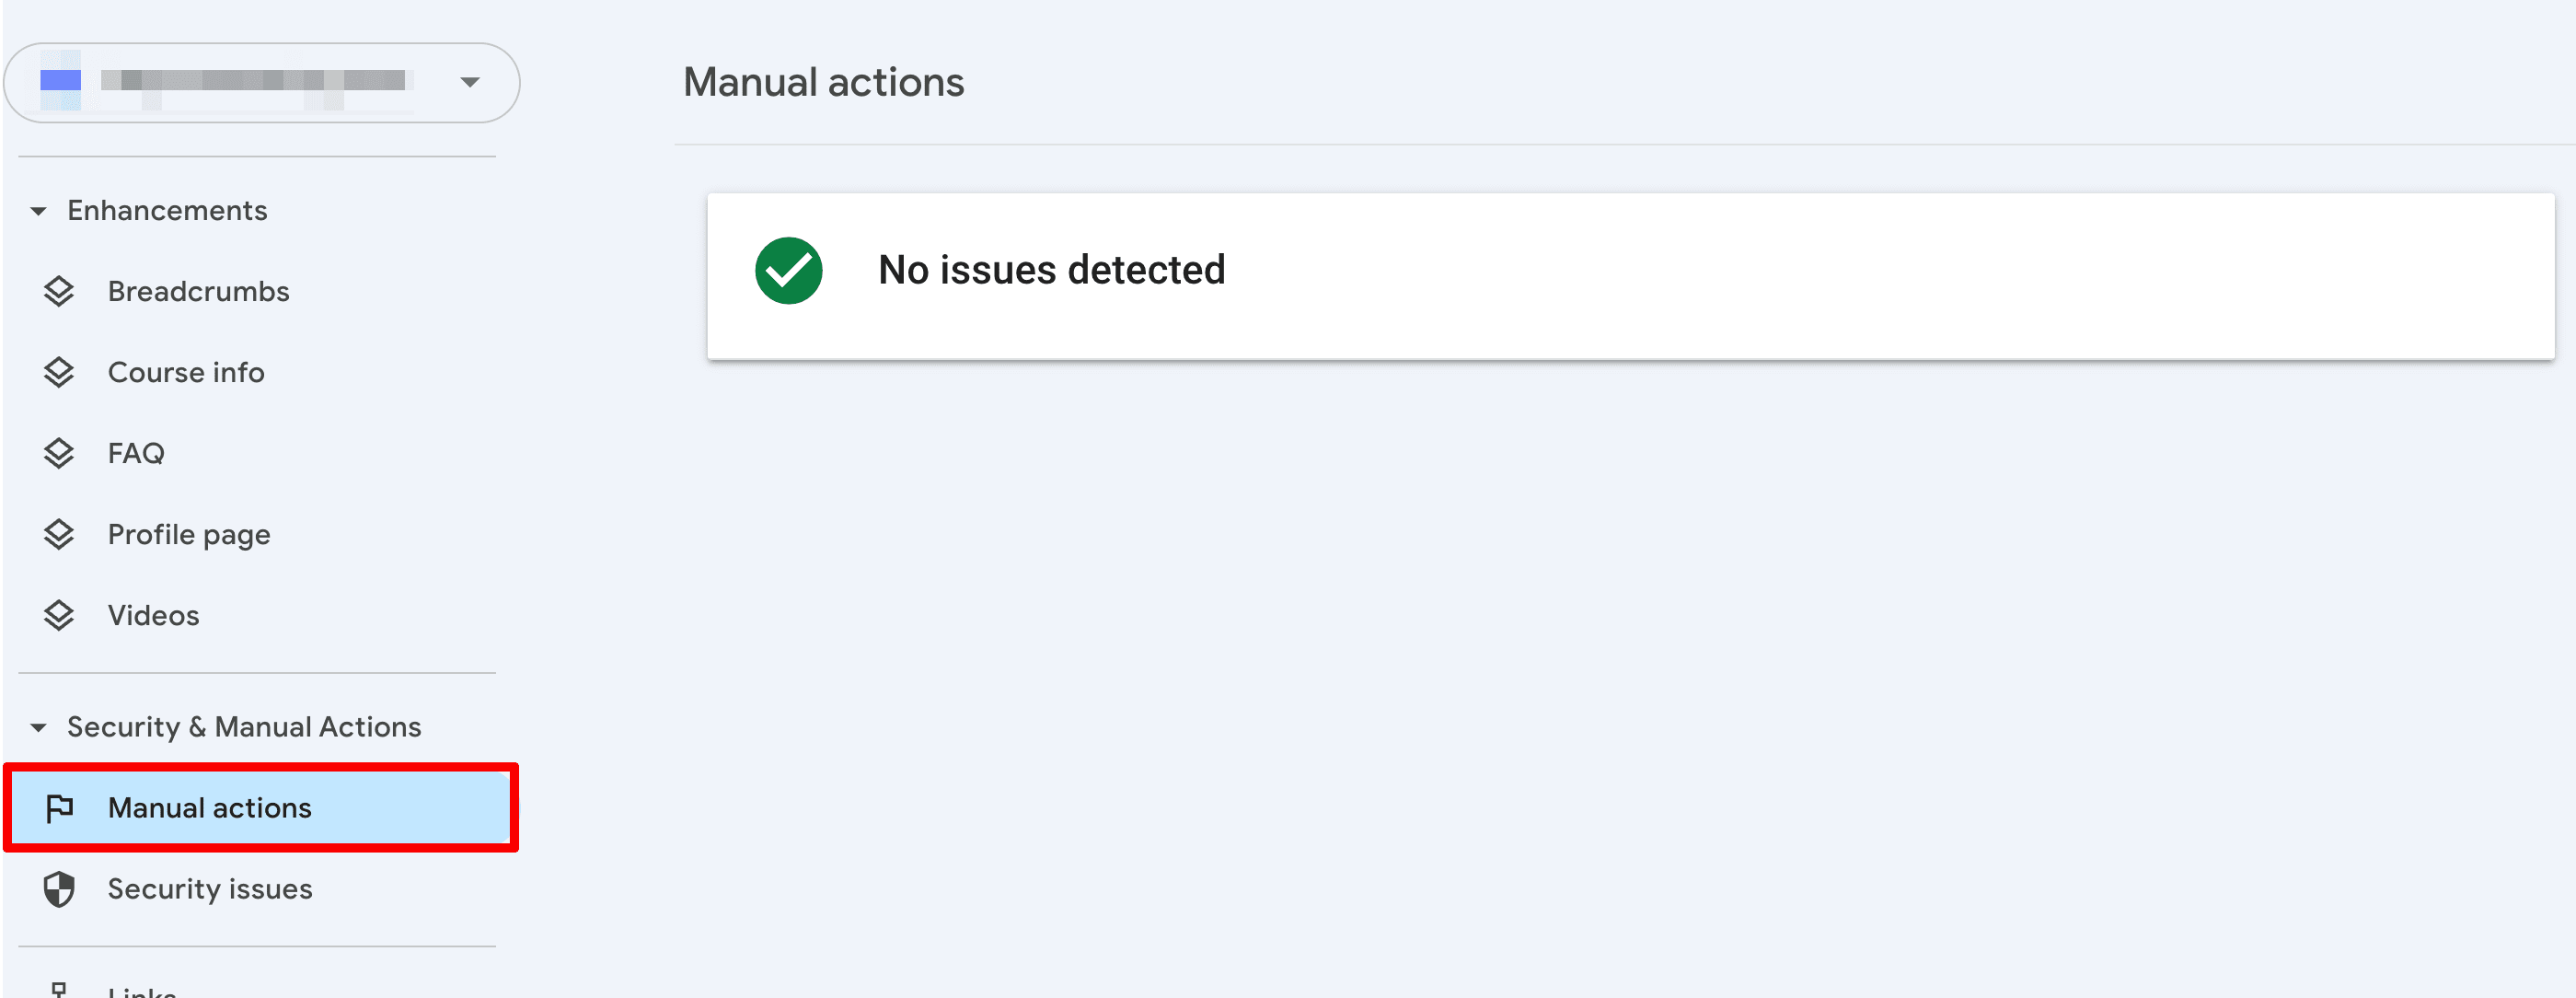
Security issues report
The Security issues report displays Google’s findings if the search engine detects that your site has been hacked or if it contains content that could potentially harm visitors. Resolving the security issues flagged in this report right away protects site visitors from potential harm, maintains the site’s reputation, and prevents it from being penalized or blacklisted by Google. Additionally, addressing security issues promptly can help maintain trust and credibility with users, leading to better overall user experience and potentially higher search engine rankings.
The Security issues report provides data on issues that fall within the following categories: hacked content, malware and unwanted software, and social engineering.
Let’s take a closer look at issues related to hacked content. To put it plainly, hacked content is any information placed on your site without your permission. Hackers may either inject malicious text into existing posts or add new pages. Sometimes, they do it using CSS or HTML, so it gets harder to spot. One of the most common cases of content hacking is adding code that redirects users to unwanted spammy pages. These could include betting platforms, adult content, or other gray-niche websites.
Monitor the Security issues report regularly to keep your site safe. If any of your pages are affected, you’ll see a list of security issues at the top of the report. Otherwise, you’ll see a message that says “No issues detected” and a green check mark next to it.
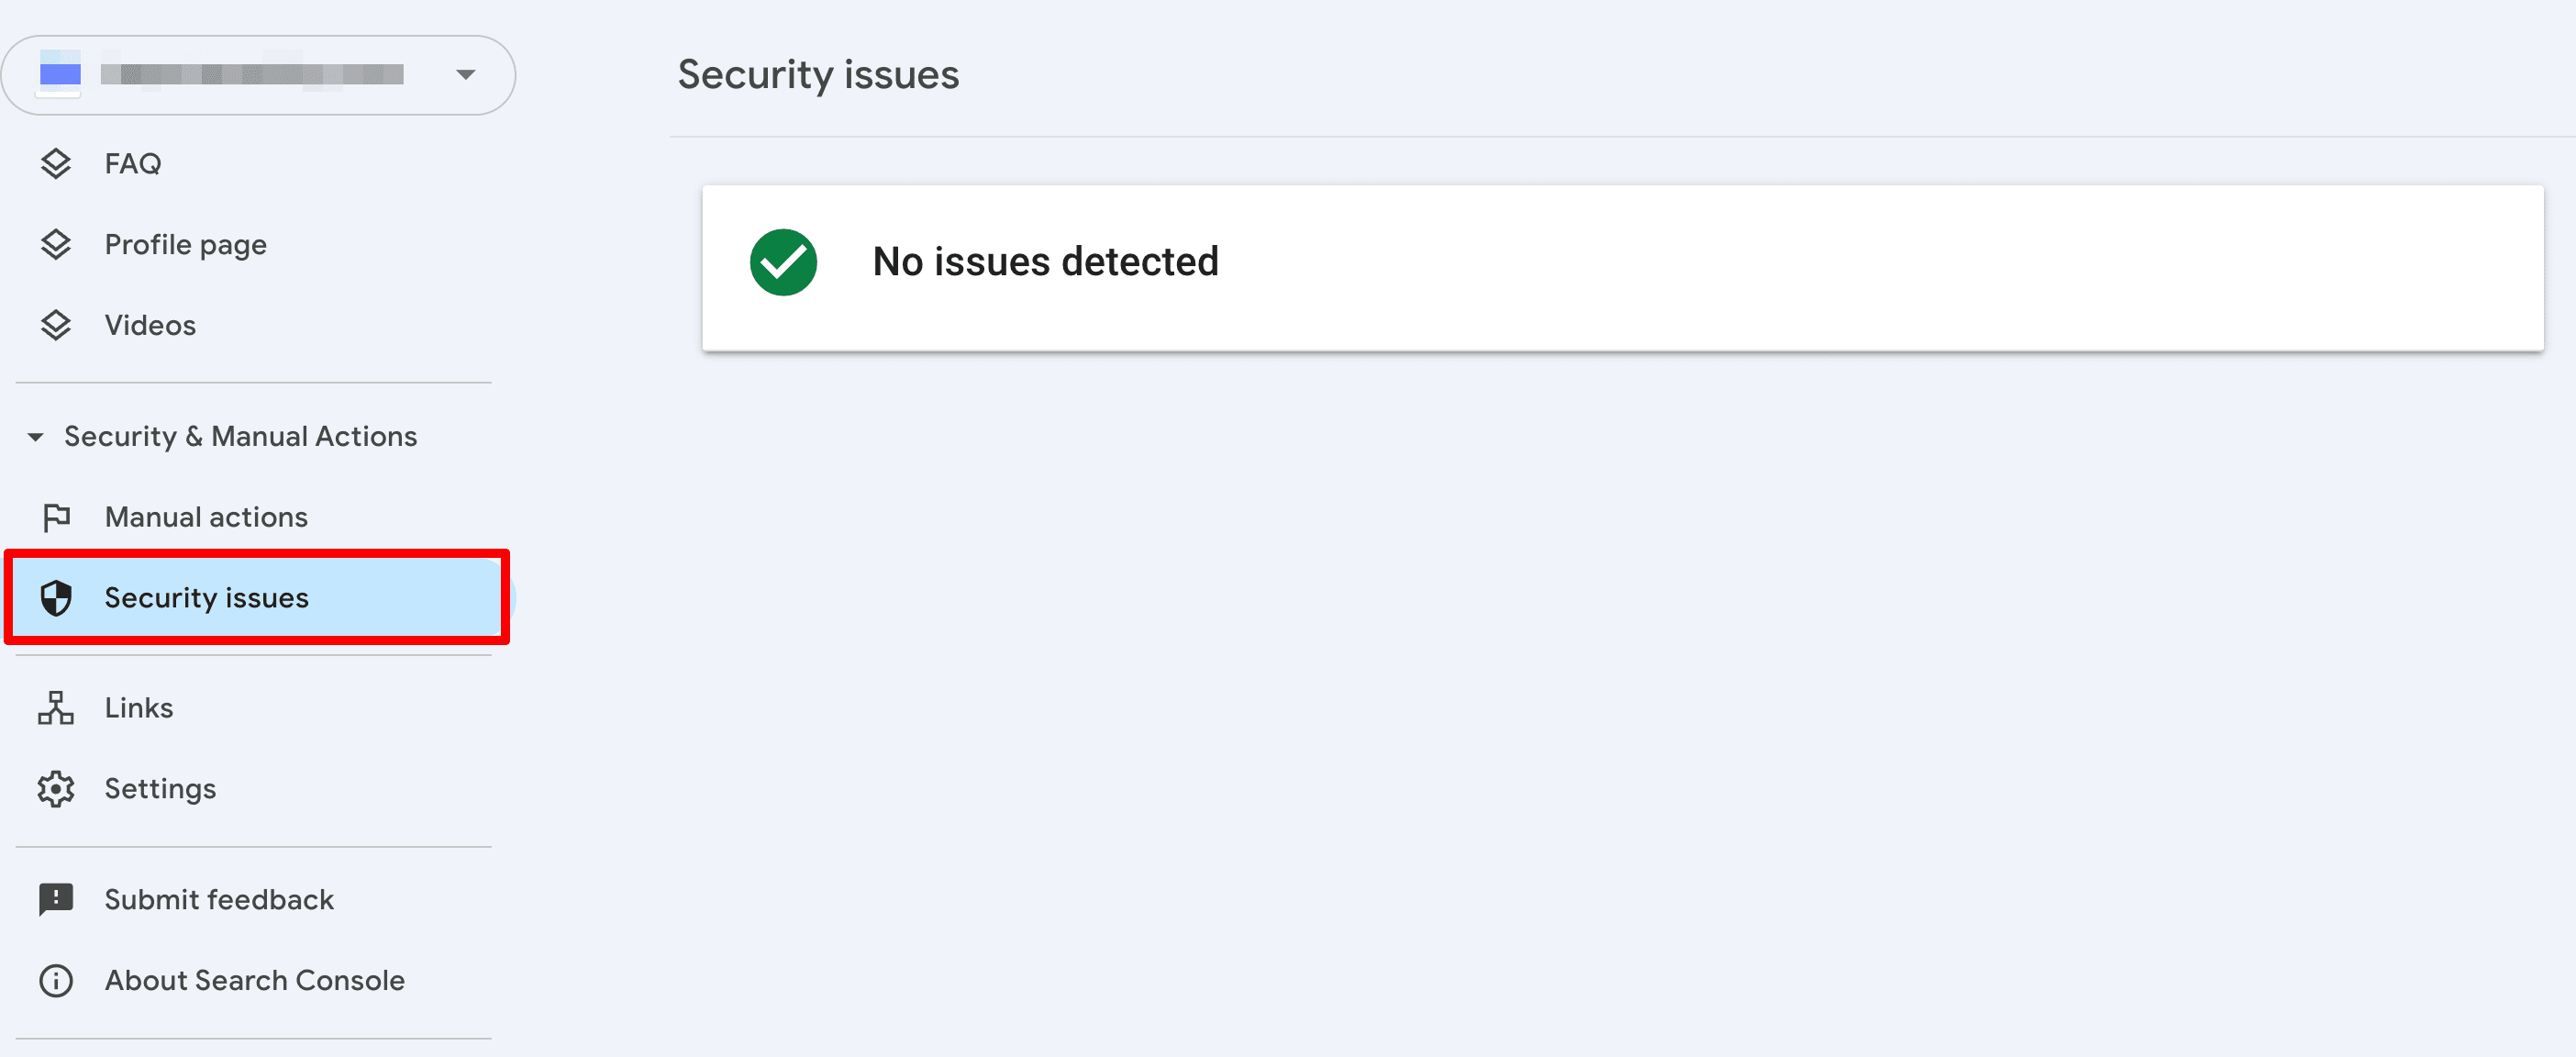
Links report
The Links report provides valuable information about your website’s backlink profile. It helps you assess the quantity of backlinks, identify which content attracts the most backlinks, and find top referring domains and anchor texts. This data can be used to refine your link building strategy and enhance your website’s overall organic visibility. Additionally, you can access information about internal links here to strengthen your internal linking analysis.
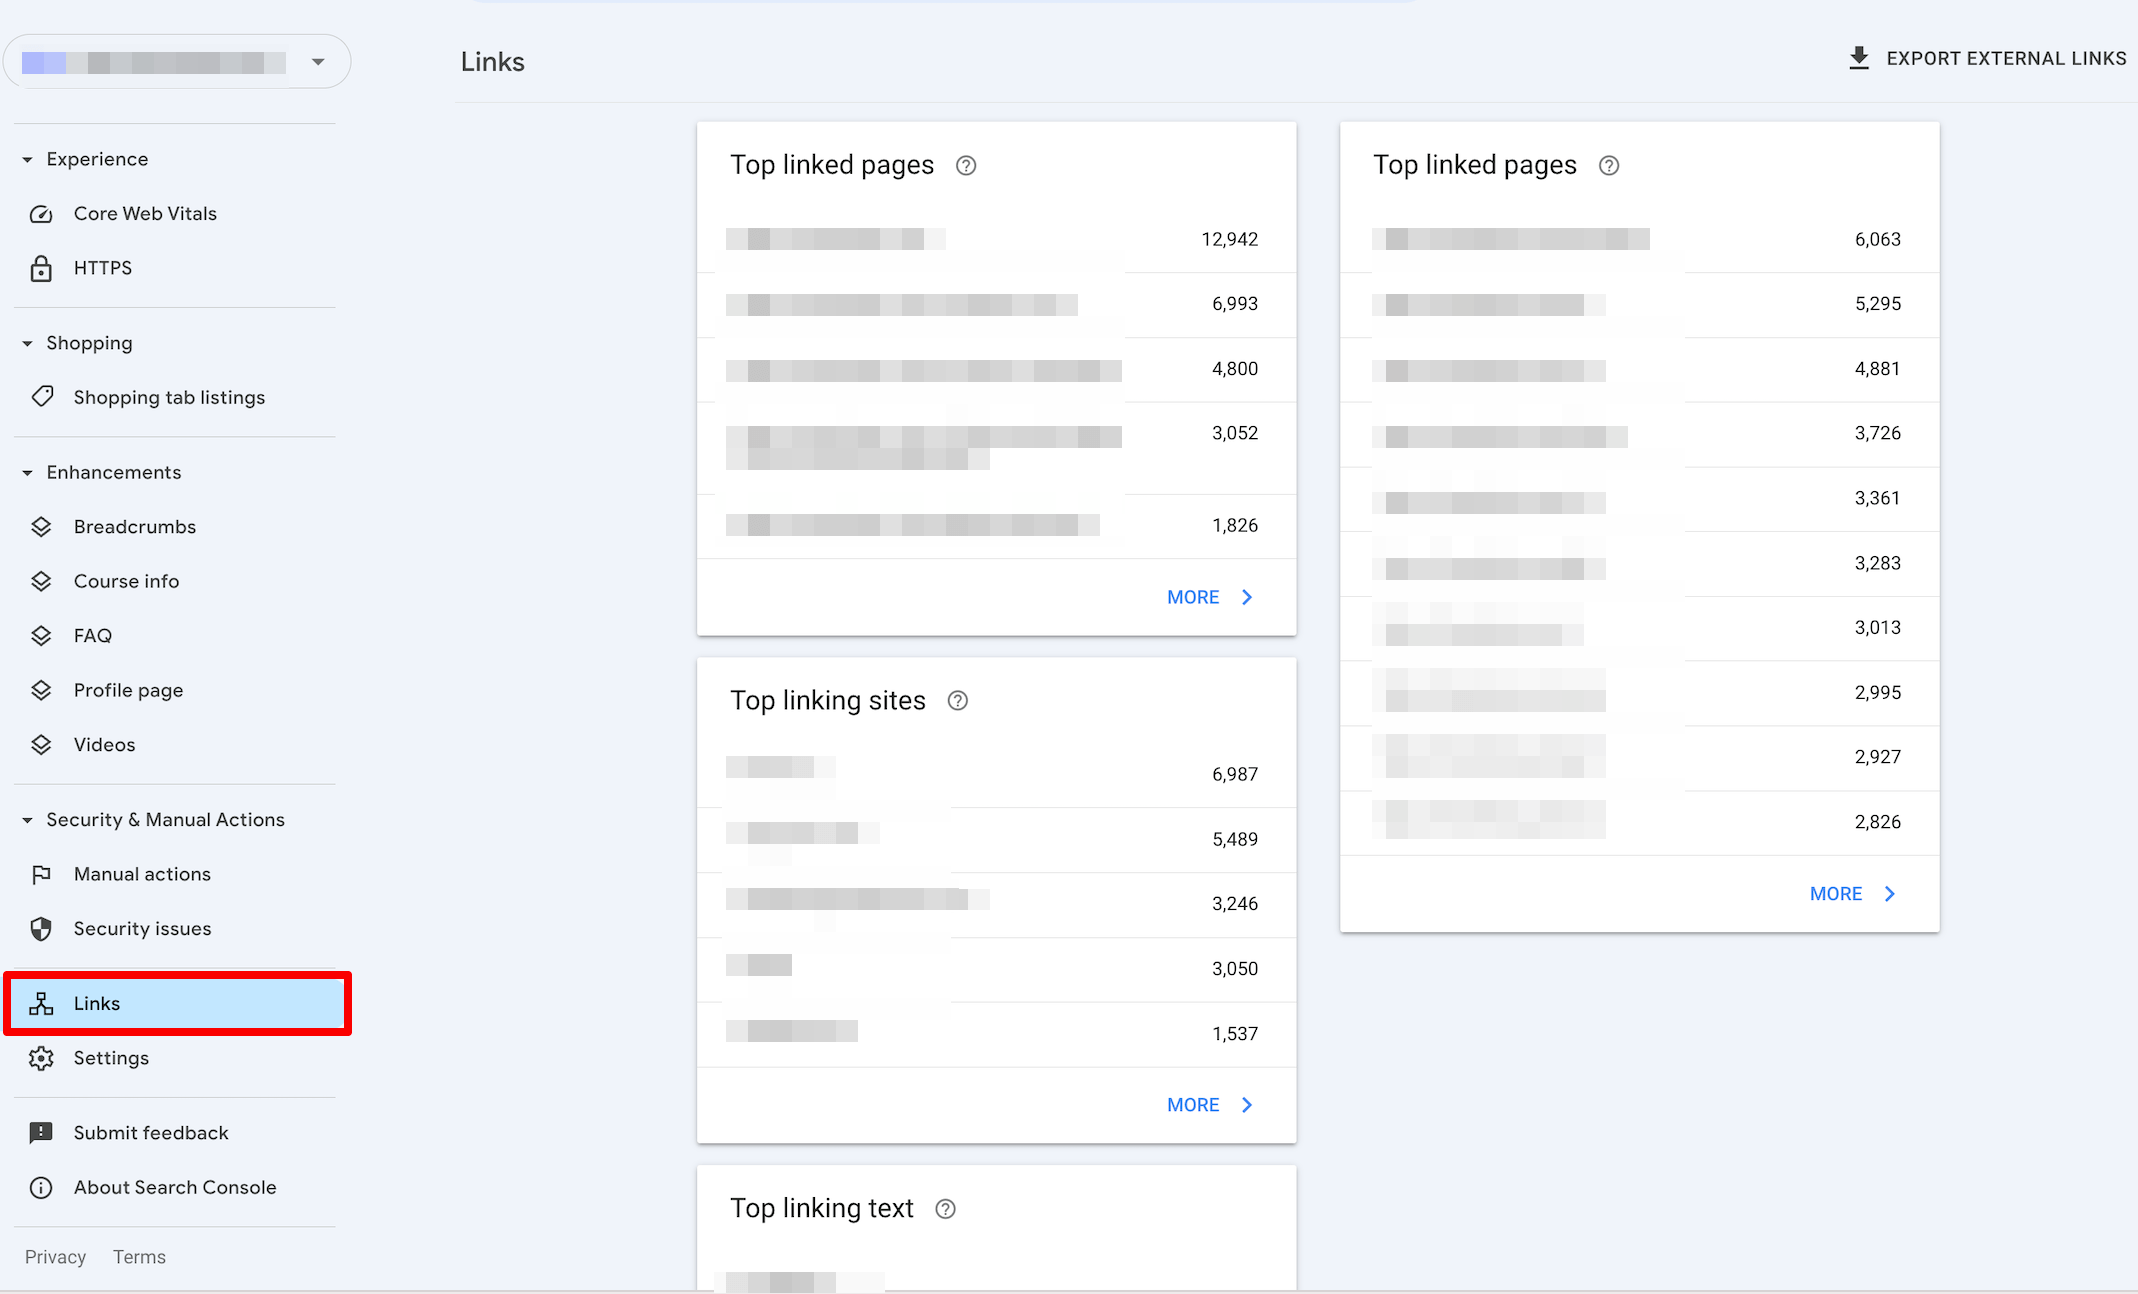
The Links report also lets you observe external links. You can find out which sites link to yours most often which of your pages are most commonly linked, and which anchor texts are the most popular for backlinks.
To access information on referring domains, navigate to the Links report ➡️ Top linking sites ➡️ More.
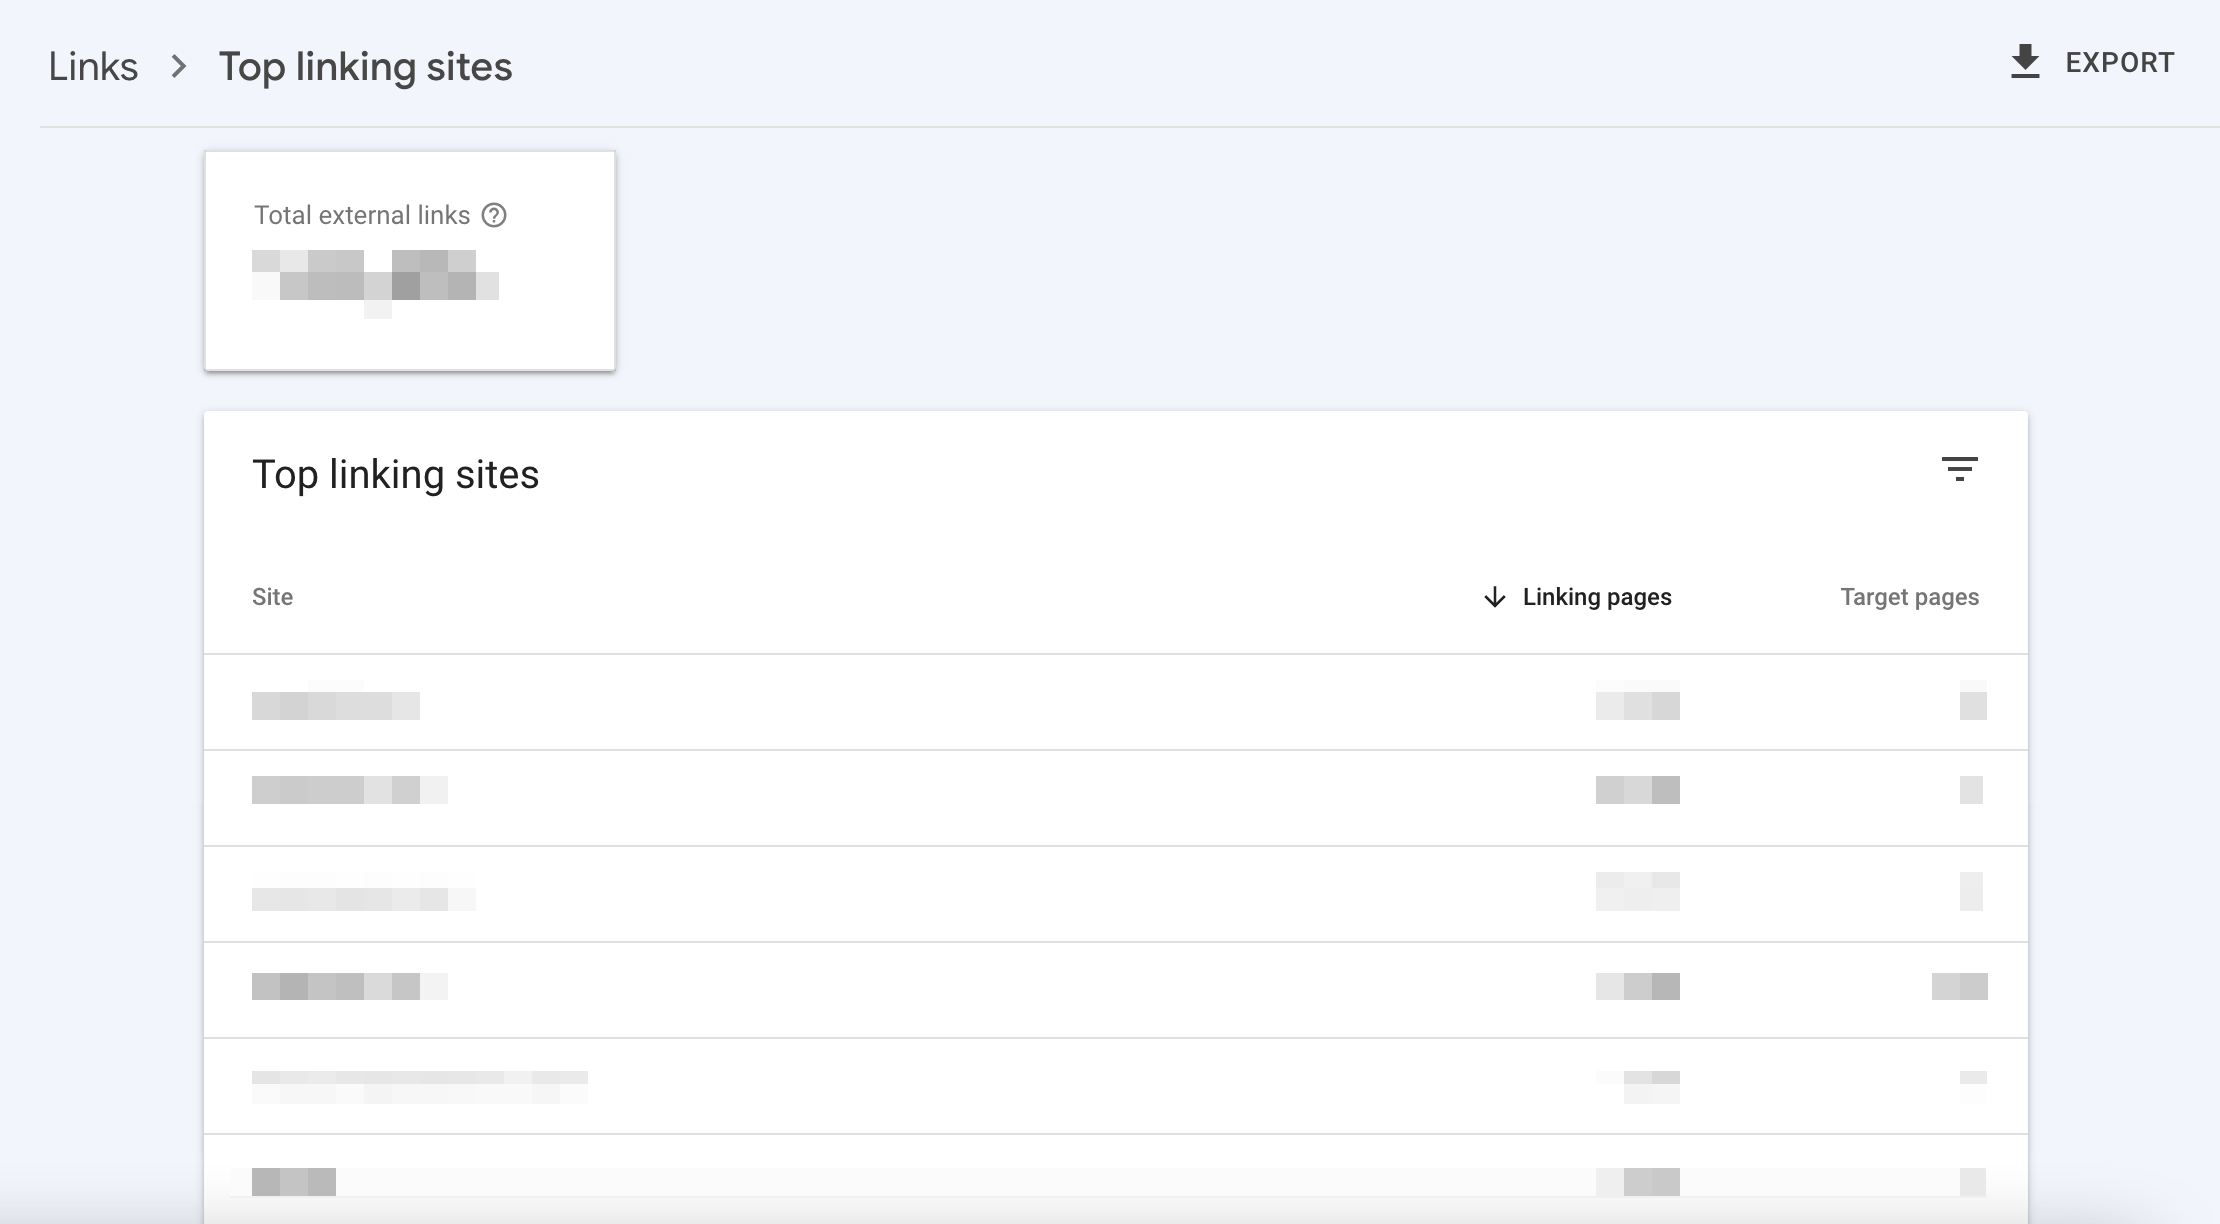
This information will help ensure that all sites linking back to you are relevant and reliable. You should also regularly check this report because links from unknown and possibly spammy platforms may negatively impact your appearance in search results. For more information on how to handle toxic backlinks, refer to this guide.
The Links report allows users to see in greater detail which pages link the most to specific pages in your property. For example, if you go to the Top linked pages – externally and then click on the data in the Linking sites column, you’ll see a list of the top sites linking to a page on your site. You can further click on the Links column to see a full list of Top linking pages, including the exact external URLs pointing to an individual page on your website.
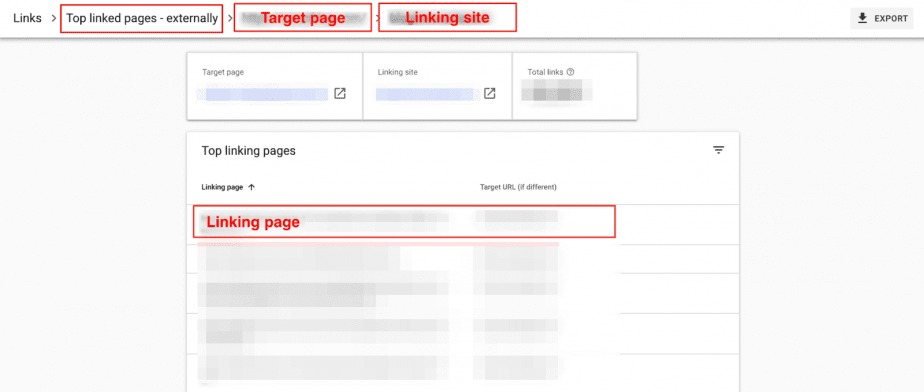
To find out which words other websites are using when linking to your site, go to Links report ➡️ Top linking text.

For the top sites pointing to different pages on your site, go to Top linking sites ➡️ [URL].
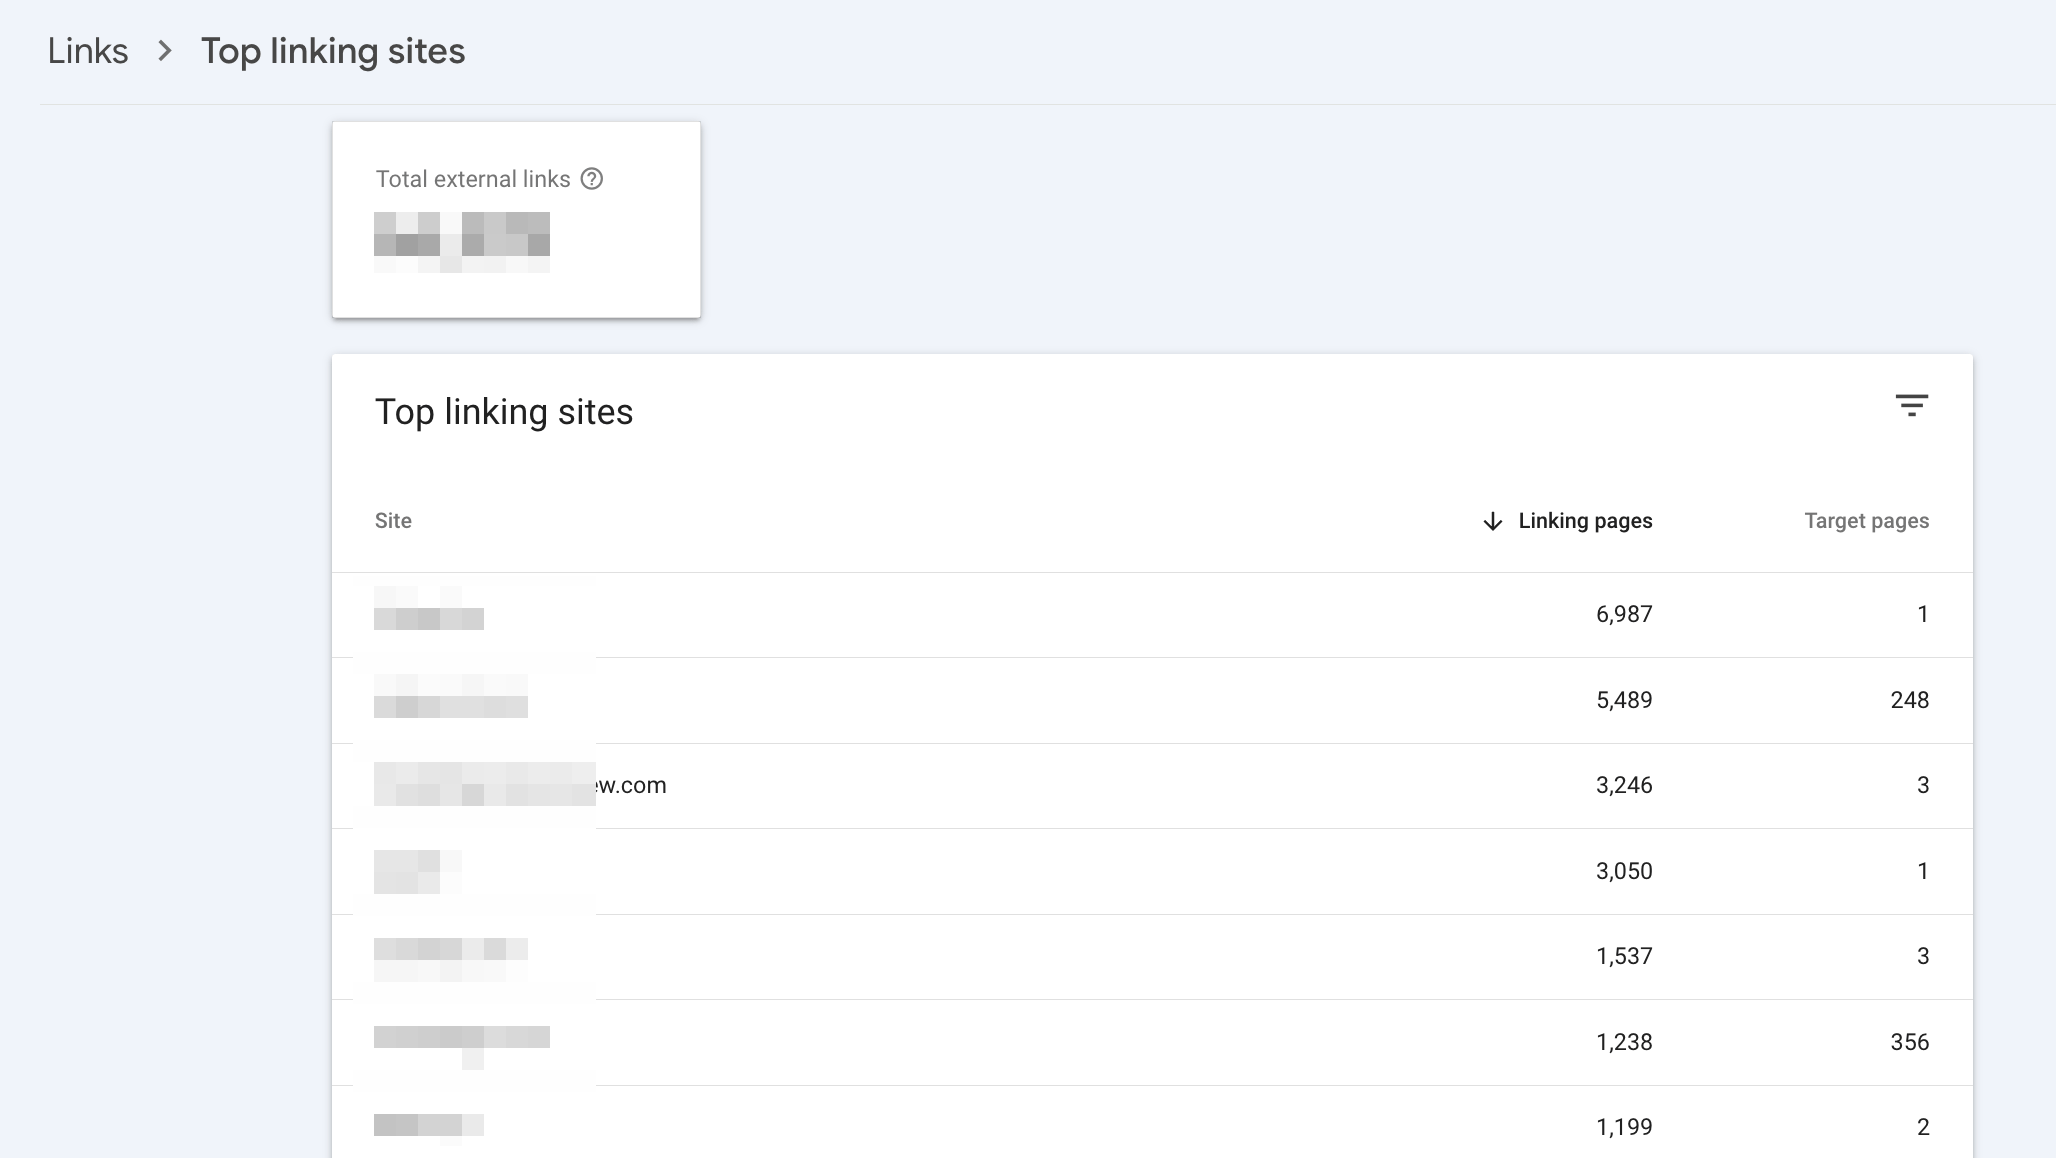
This tool also displays pages on your site with links originating from other pages within the same site. To get this info, go to Internal links ➡️ More, then choose a URL among the Top internally-linked pages.

Although the Google Search Console Links report provides comprehensive data, it may be challenging to figure out what type of information to focus on when evaluating changes in your link profile over time.
SE Ranking’s Backlink Monitor tool makes it easy to keep an eye on your backlinks, analyze the domains that point to the linking page, evaluate their quality, and regain control over spam backlinks that can harm your image. All these details are shown on a single screen.
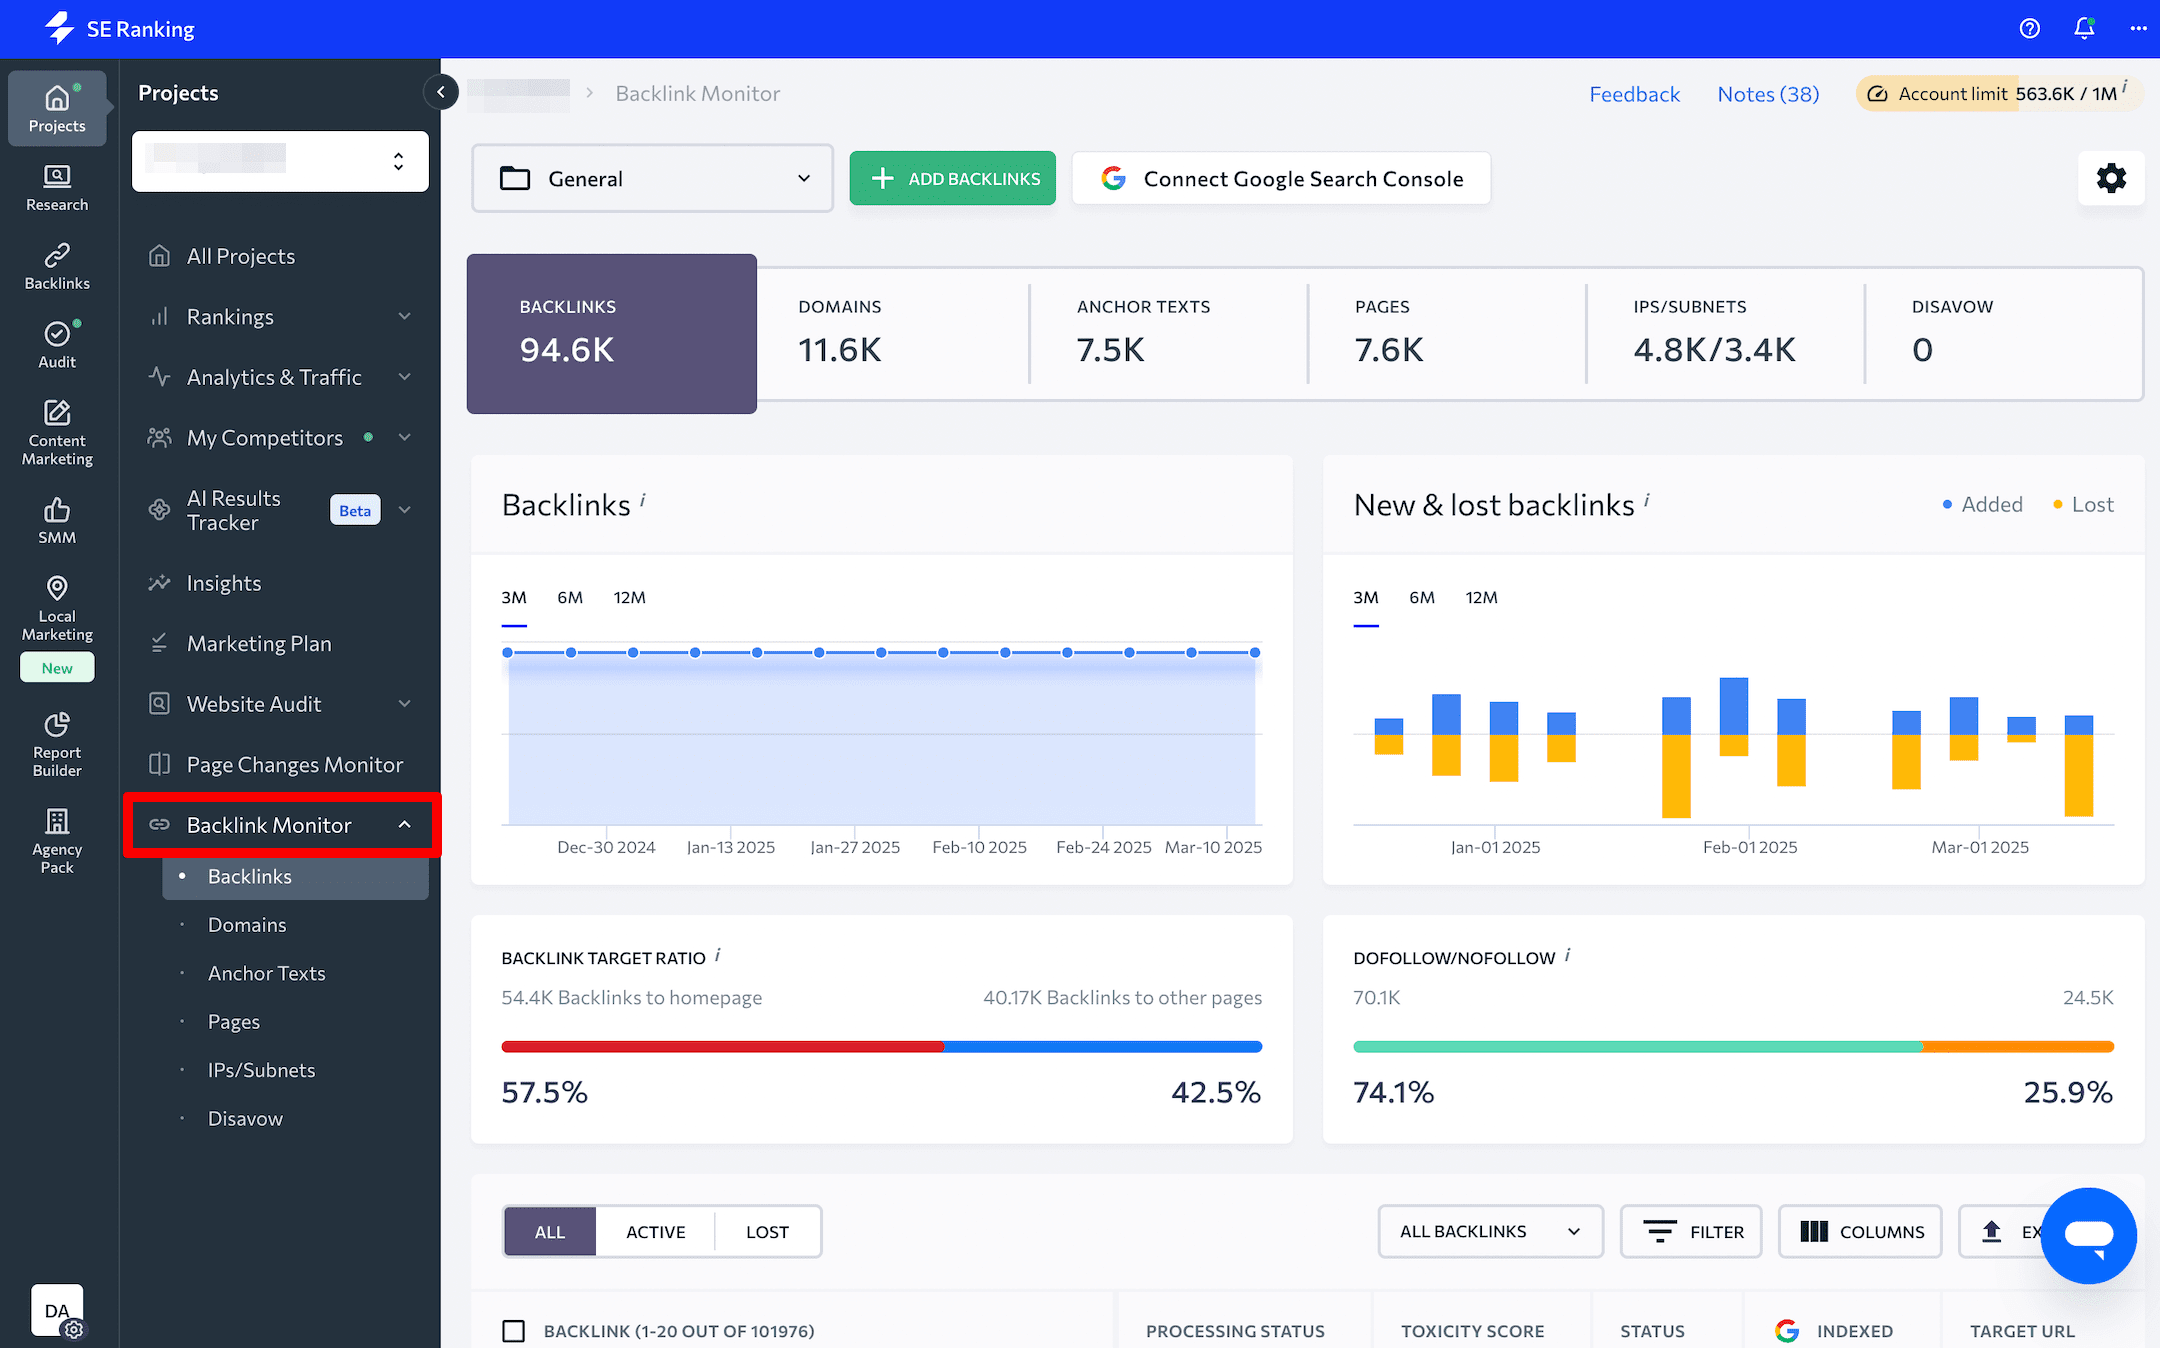
Start tracking your backlinks by creating a project and clicking the Backlink Monitor tab.
If you don’t have an SE Ranking subscription, no worries. The tool is available with a free 14-day trial period.
Settings
The Settings page allows you to view and manage different Search Console settings for your website. You can modify its verification method, manage the page roles, change the domain address, limit the crawling request rate, and make other necessary adjustments. Let’s examine each option in detail.
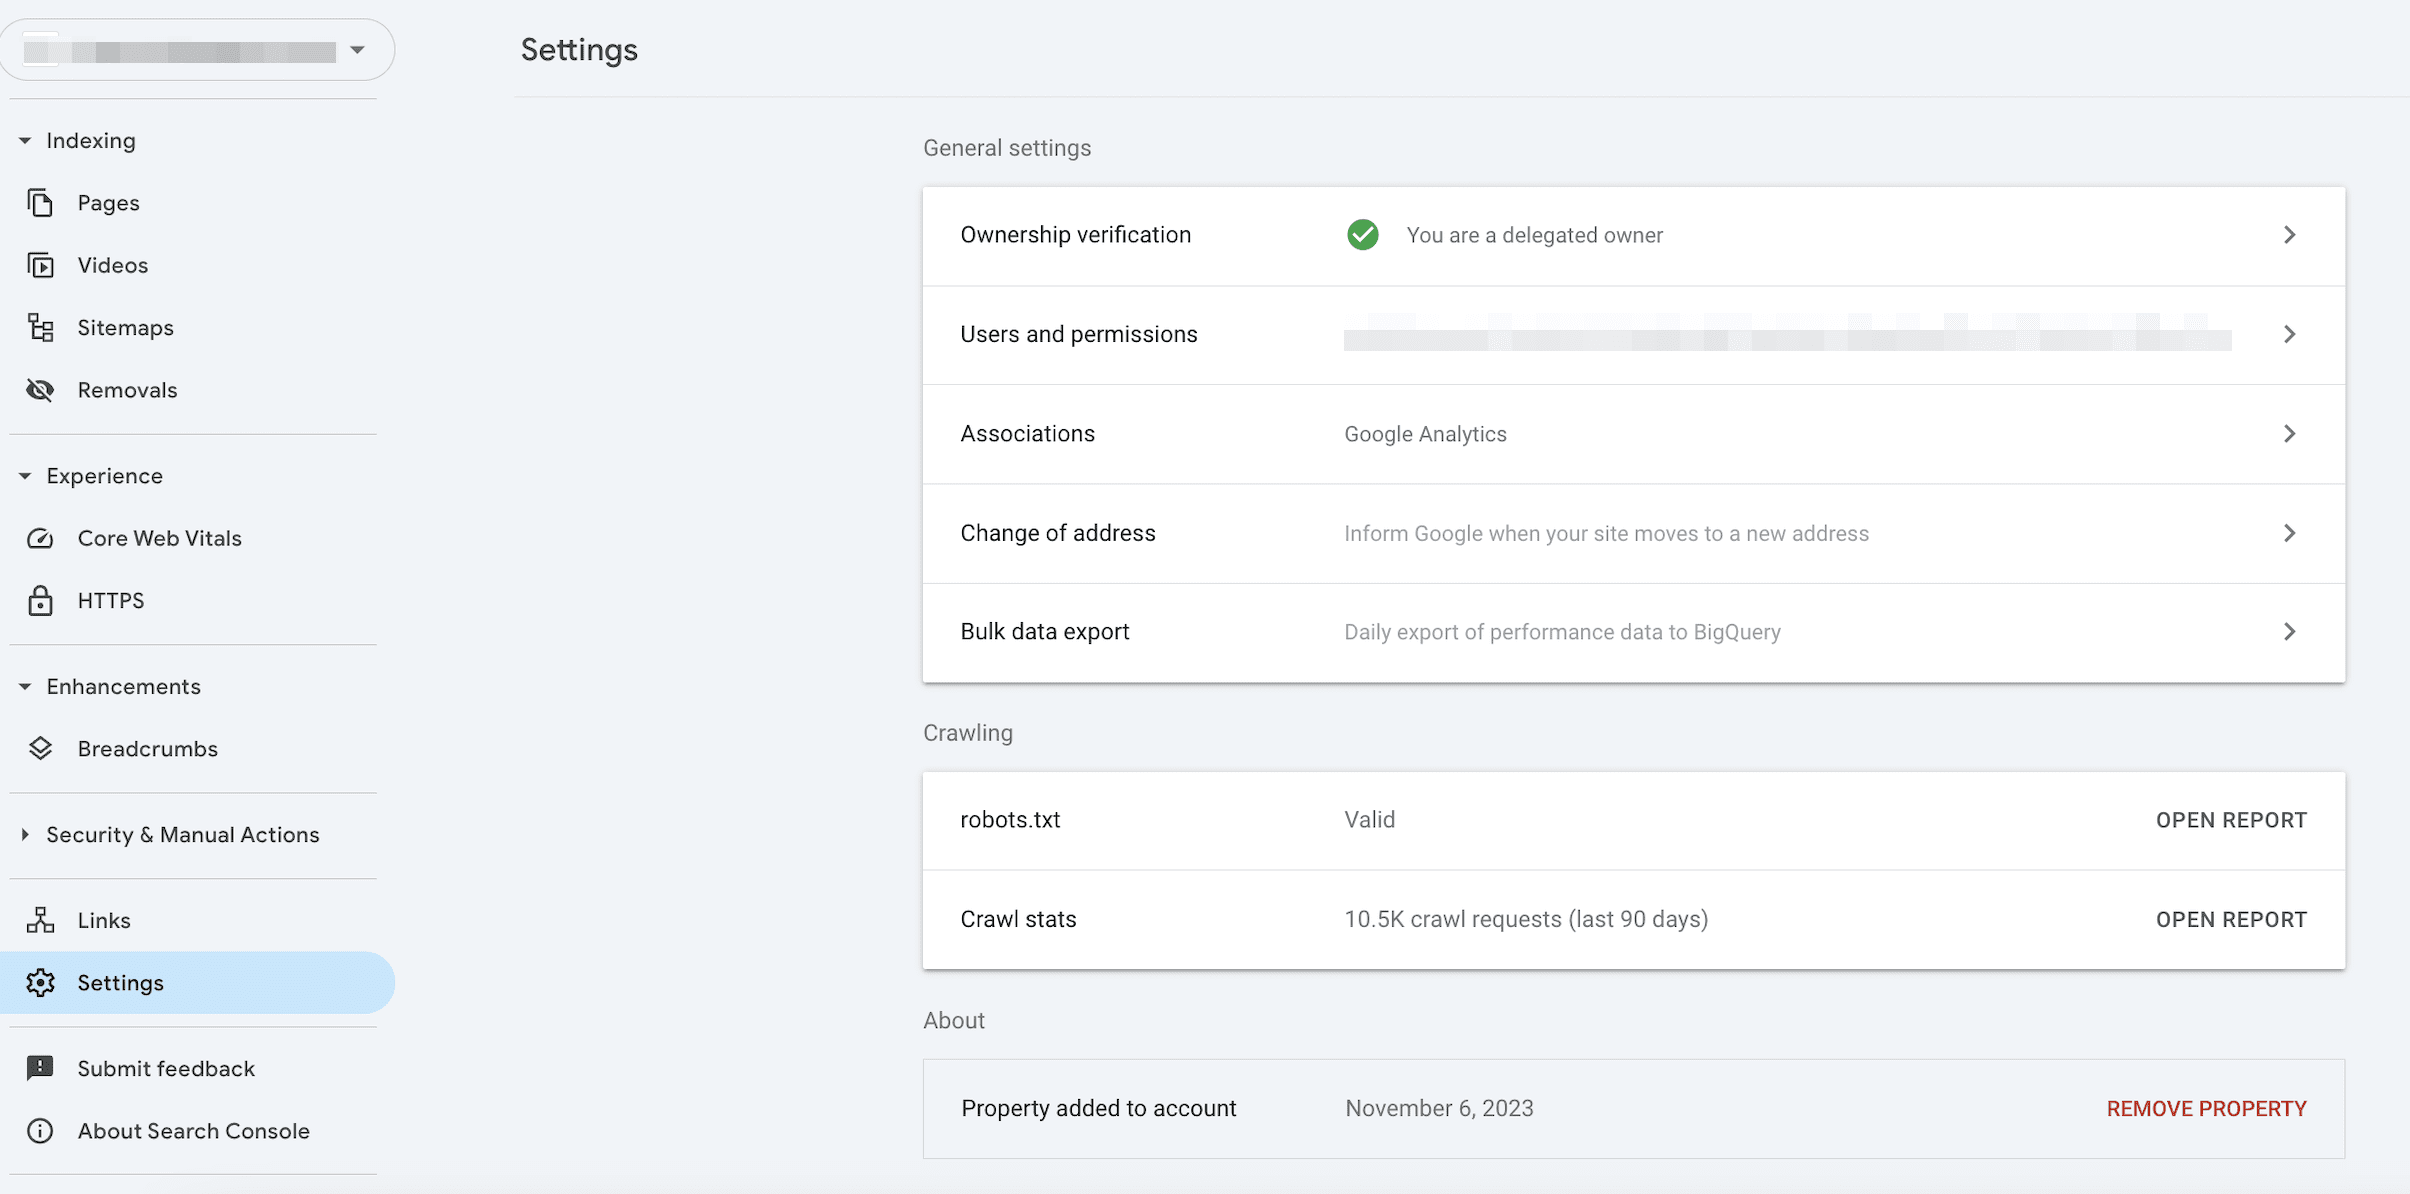
General settings
- Ownership verification. This option allows you to manage the verification method used for your property. You can upload an HTML file to your site, add a meta tag to the homepage, use your Google Analytics or Tag Manager account, or associate a DNS record with Google.
- Associations. You can see and manage associations between your property and other Google services. For instance, you can connect GSC with your Google Analytics account to merge data from both tools and display it in Search Console Insights. Note that these settings only allow you to confirm connection requests. To integrate data into Google Search Console, you need to use a different set of tools.
- Users and permissions. This lets you view and manage the list of users for the current property. GSC offers various access levels for users, including owner status with full control, full user access with viewing rights and limited actions, restricted user access, and associate status with limited access.
- Removing a property. This option lets you remove a property from your list, with the option to add it back later. After removal, you will no longer receive notifications, and all users will no longer have access to the property in GSC, especially if you are the last verified owner.
- Change of address. Use this tool to move your site to a new domain and migrate your search data. This tool is best used before moving your site. Remember that this feature cannot change the address from HTTP to HTTPS, move between www and non-www, shift some pages from one location to another within your site, or move a site without user-visible URL changes. To learn how to use this tool step by step, refer to Google’s documentation.
- Bulk data export. This feature enables you to continuously export data from Search Console to Google BigQuery, a tool for large websites with tens of thousands of pages. To learn how to set up a new bulk data export, read Google’s guide.
Crawling settings
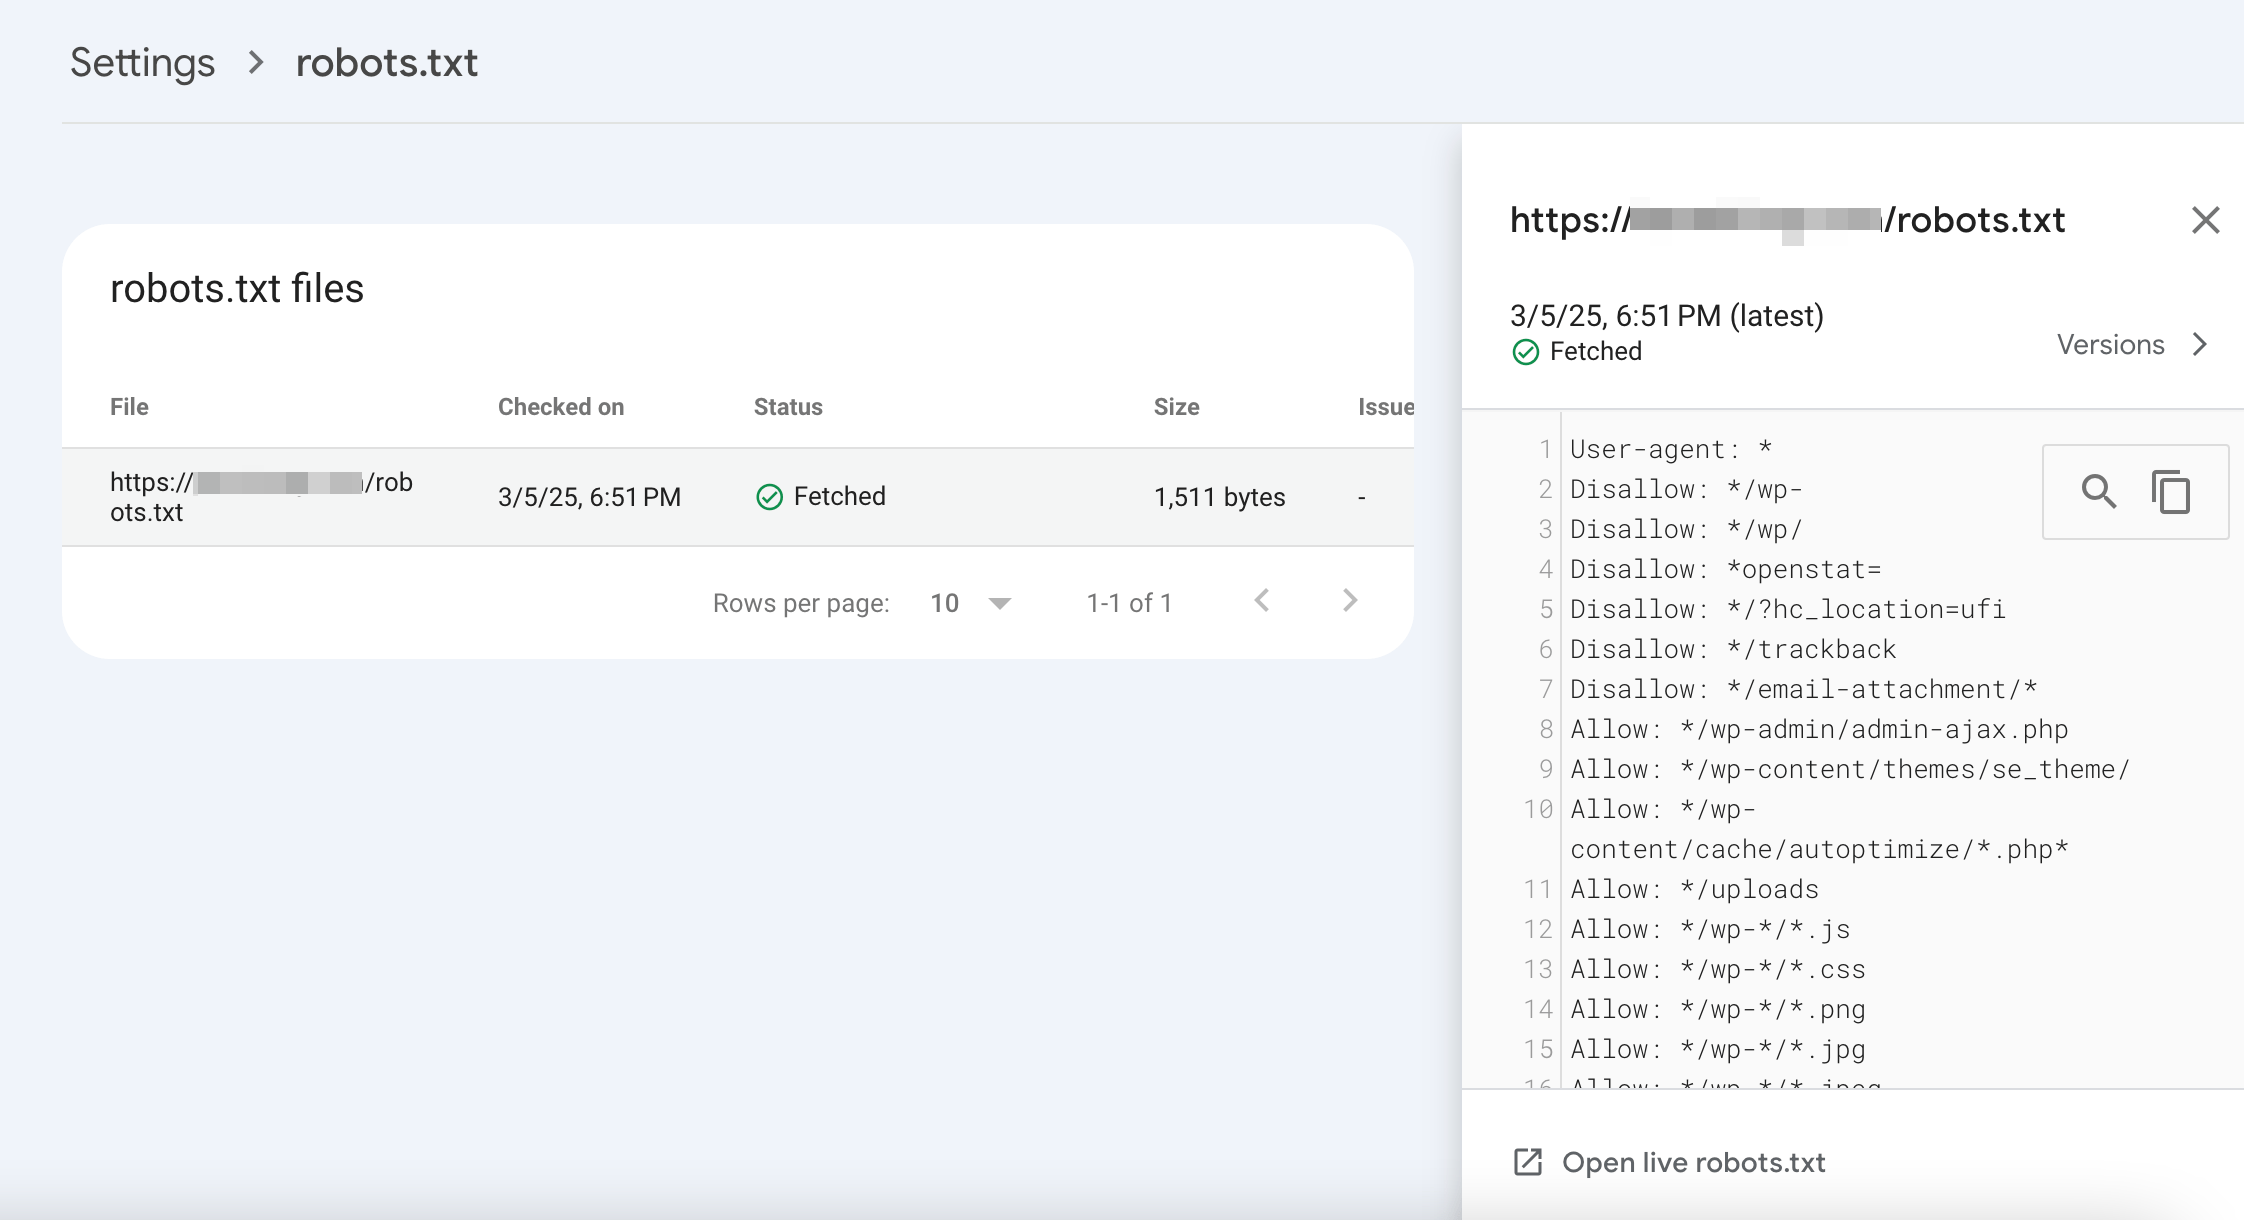
- Robots.txt. This section shows the robots.txt files that Google has detected by Google for the top 20 hosts on your site. It includes information such as the last crawl date for each file and any warnings or errors encountered during crawling. Additionally, the report allows you to request a recrawl of a robots.txt file. You can view the last fetched version of a robots.txt file by clicking on it in the files list within the report. Any errors or warnings associated with the robots.txt file will be highlighted in the displayed file contents.
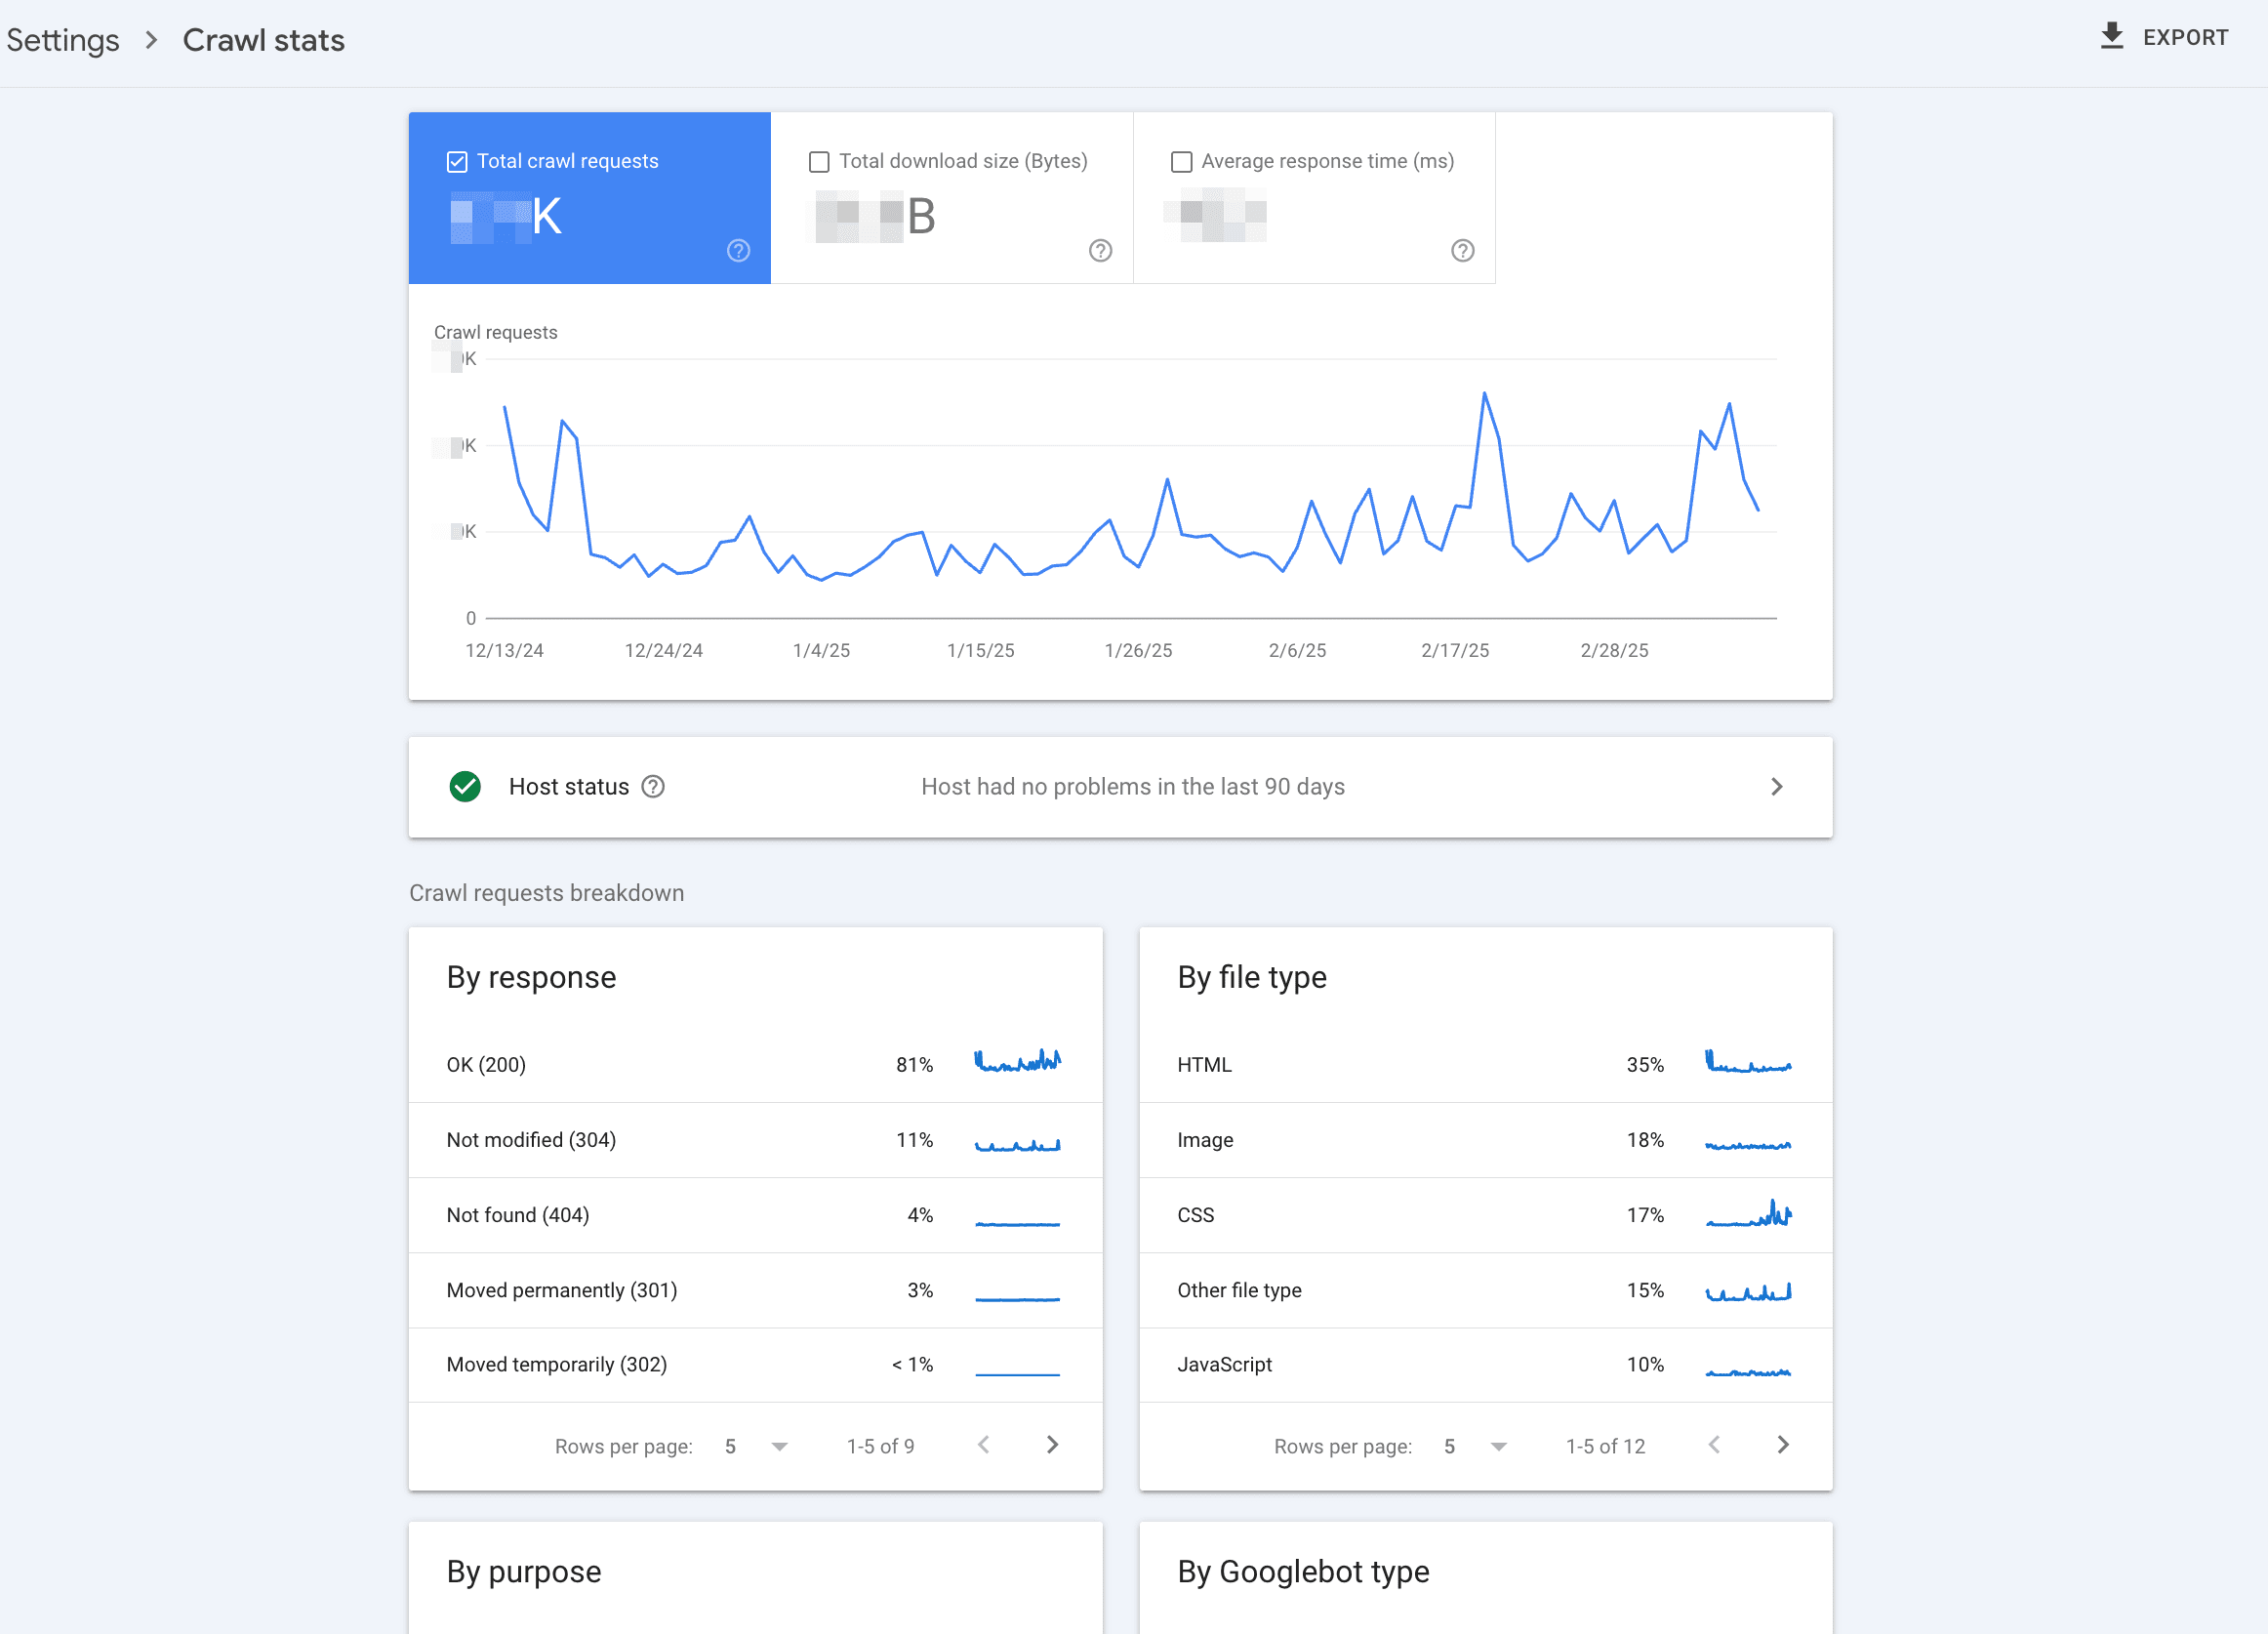
- Crawl stats. This report allows you to track how frequently Google has crawled your site over the past 90 days. The report provides information on the number of requests made, their timing, your server’s response, and any encountered availability issues.
How to connect Google Search Console to SE Ranking
Connecting GSC and Google Analytics (GA) to SE Ranking gives you access to more reports. The reports consolidate daily updates from SE Ranking’s Google ranking tool, website performance data from Search Console, and visitor details from GA—all within a single, unified interface.
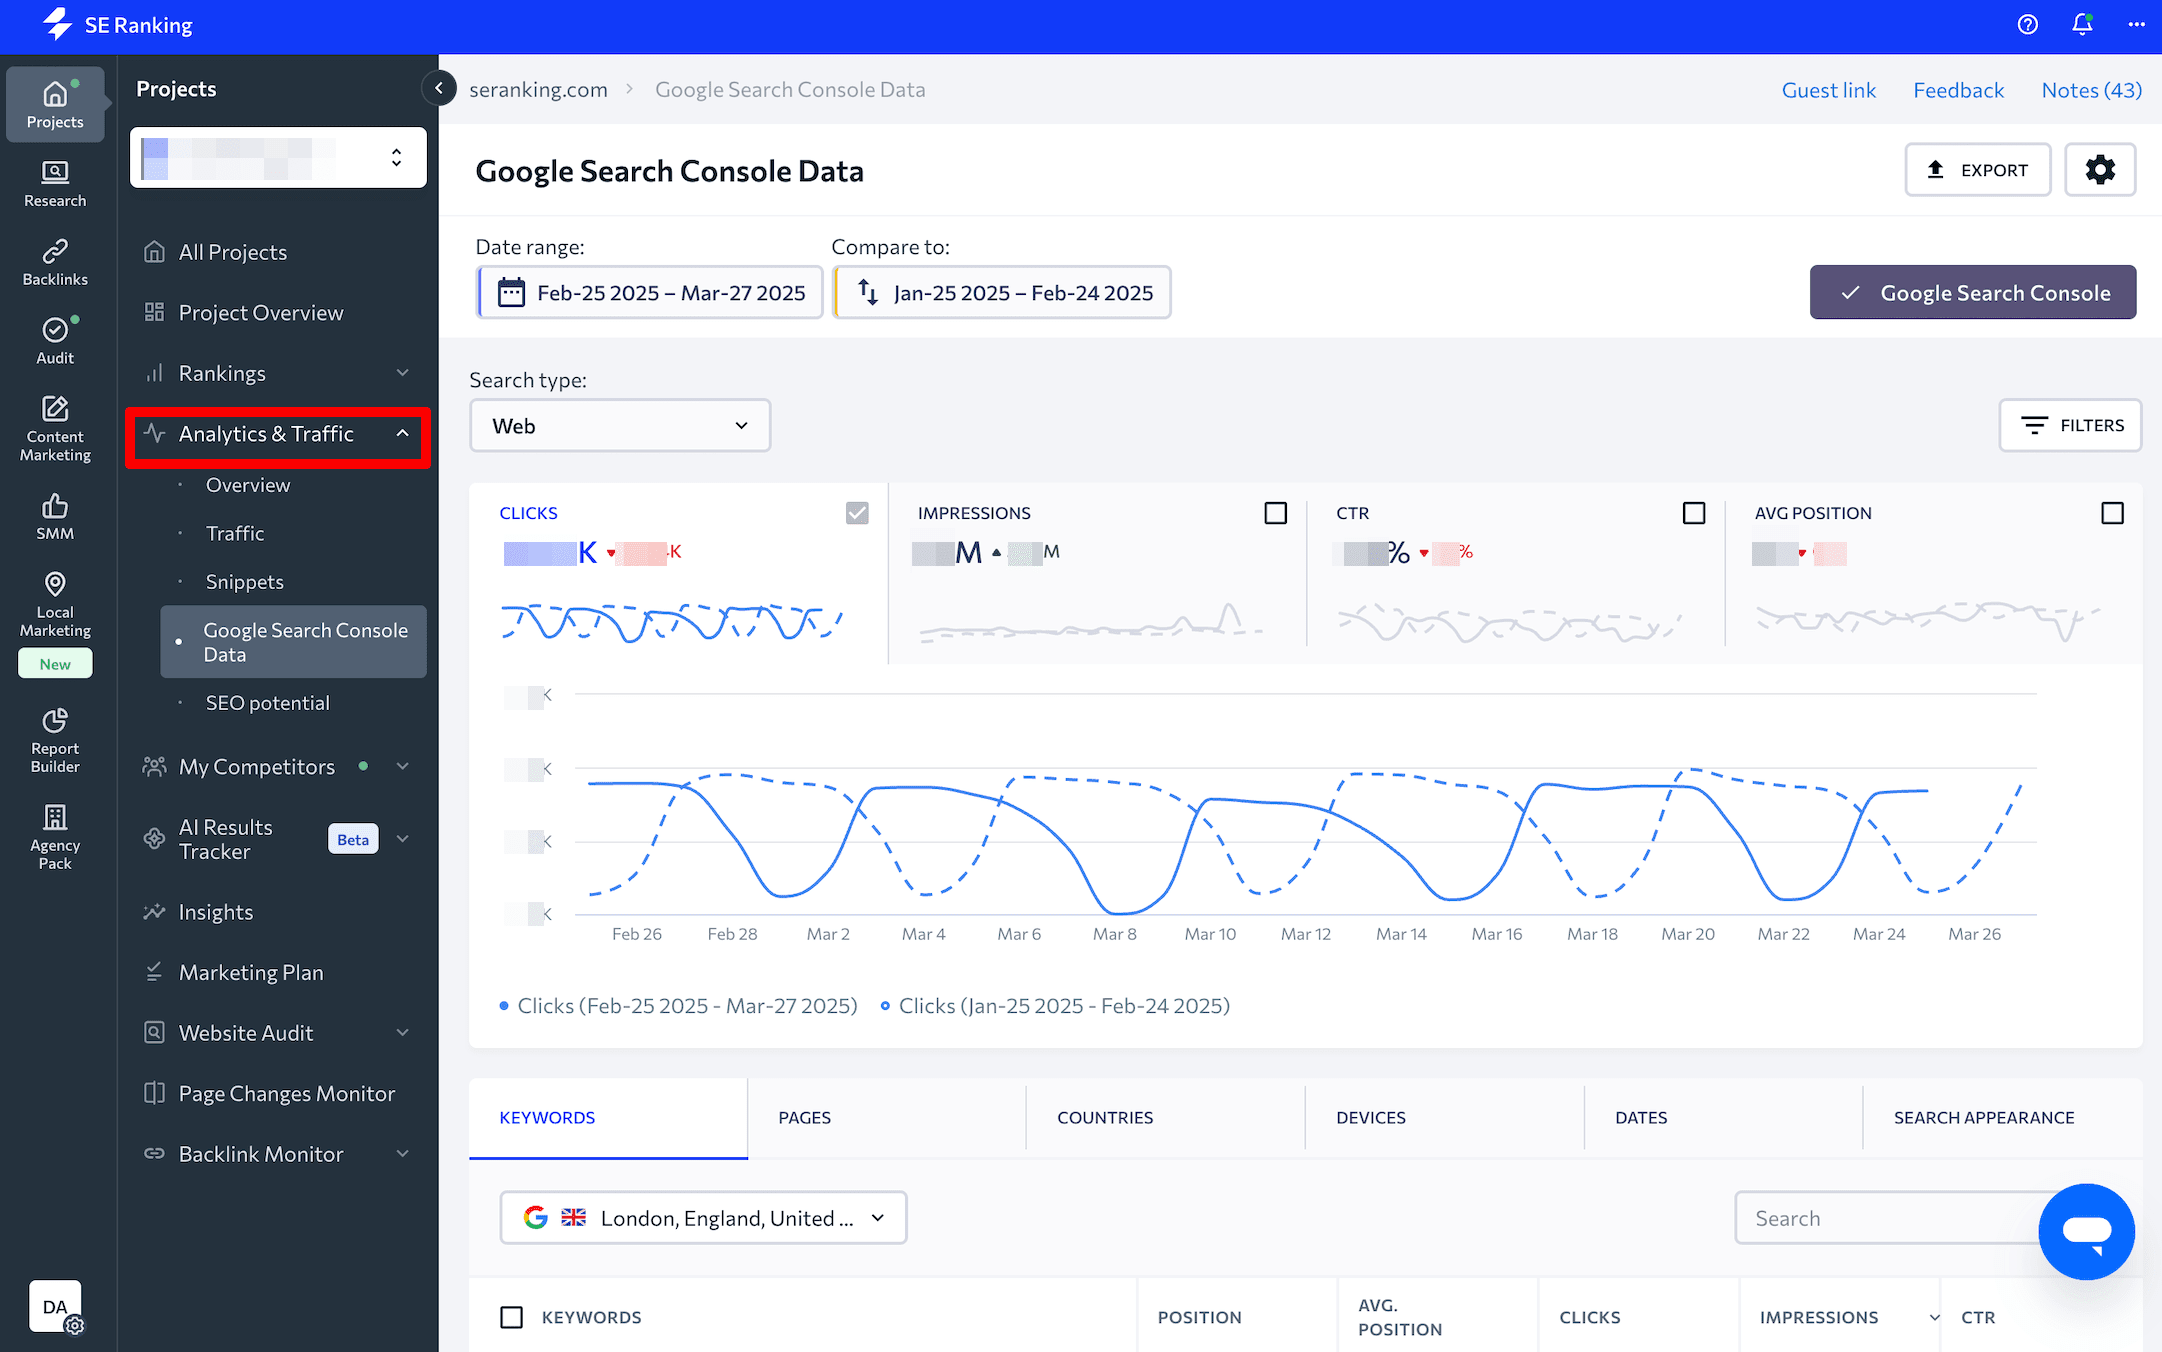
With all information neatly located in one place, it becomes much easier to analyze and filter keywords, pages, countries, and devices according to specific criteria. Additionally, you can access the accurate ranking information provided by SE Ranking, which updates your rankings more frequently than GSC. Unlike GSC, which only updates your data once every 2-3 days, SE Ranking provides you with brand new data.
Eventually, integrating these tools can help you expand your keyword database, improve your rankings for underperforming keywords, optimize URLs with a low CTR, and identify the content type that drives traffic.
Gain insights into monitoring and analyzing your ranking positions by referring to our guide on tracking search engine rankings.
To connect GSC to SE Ranking, select your project, choose the Analytics & Traffic section, click the Connect Google Search Console button, and Connect. Make sure that you’ve already logged in to your Google account, which is linked to Google Search Console.
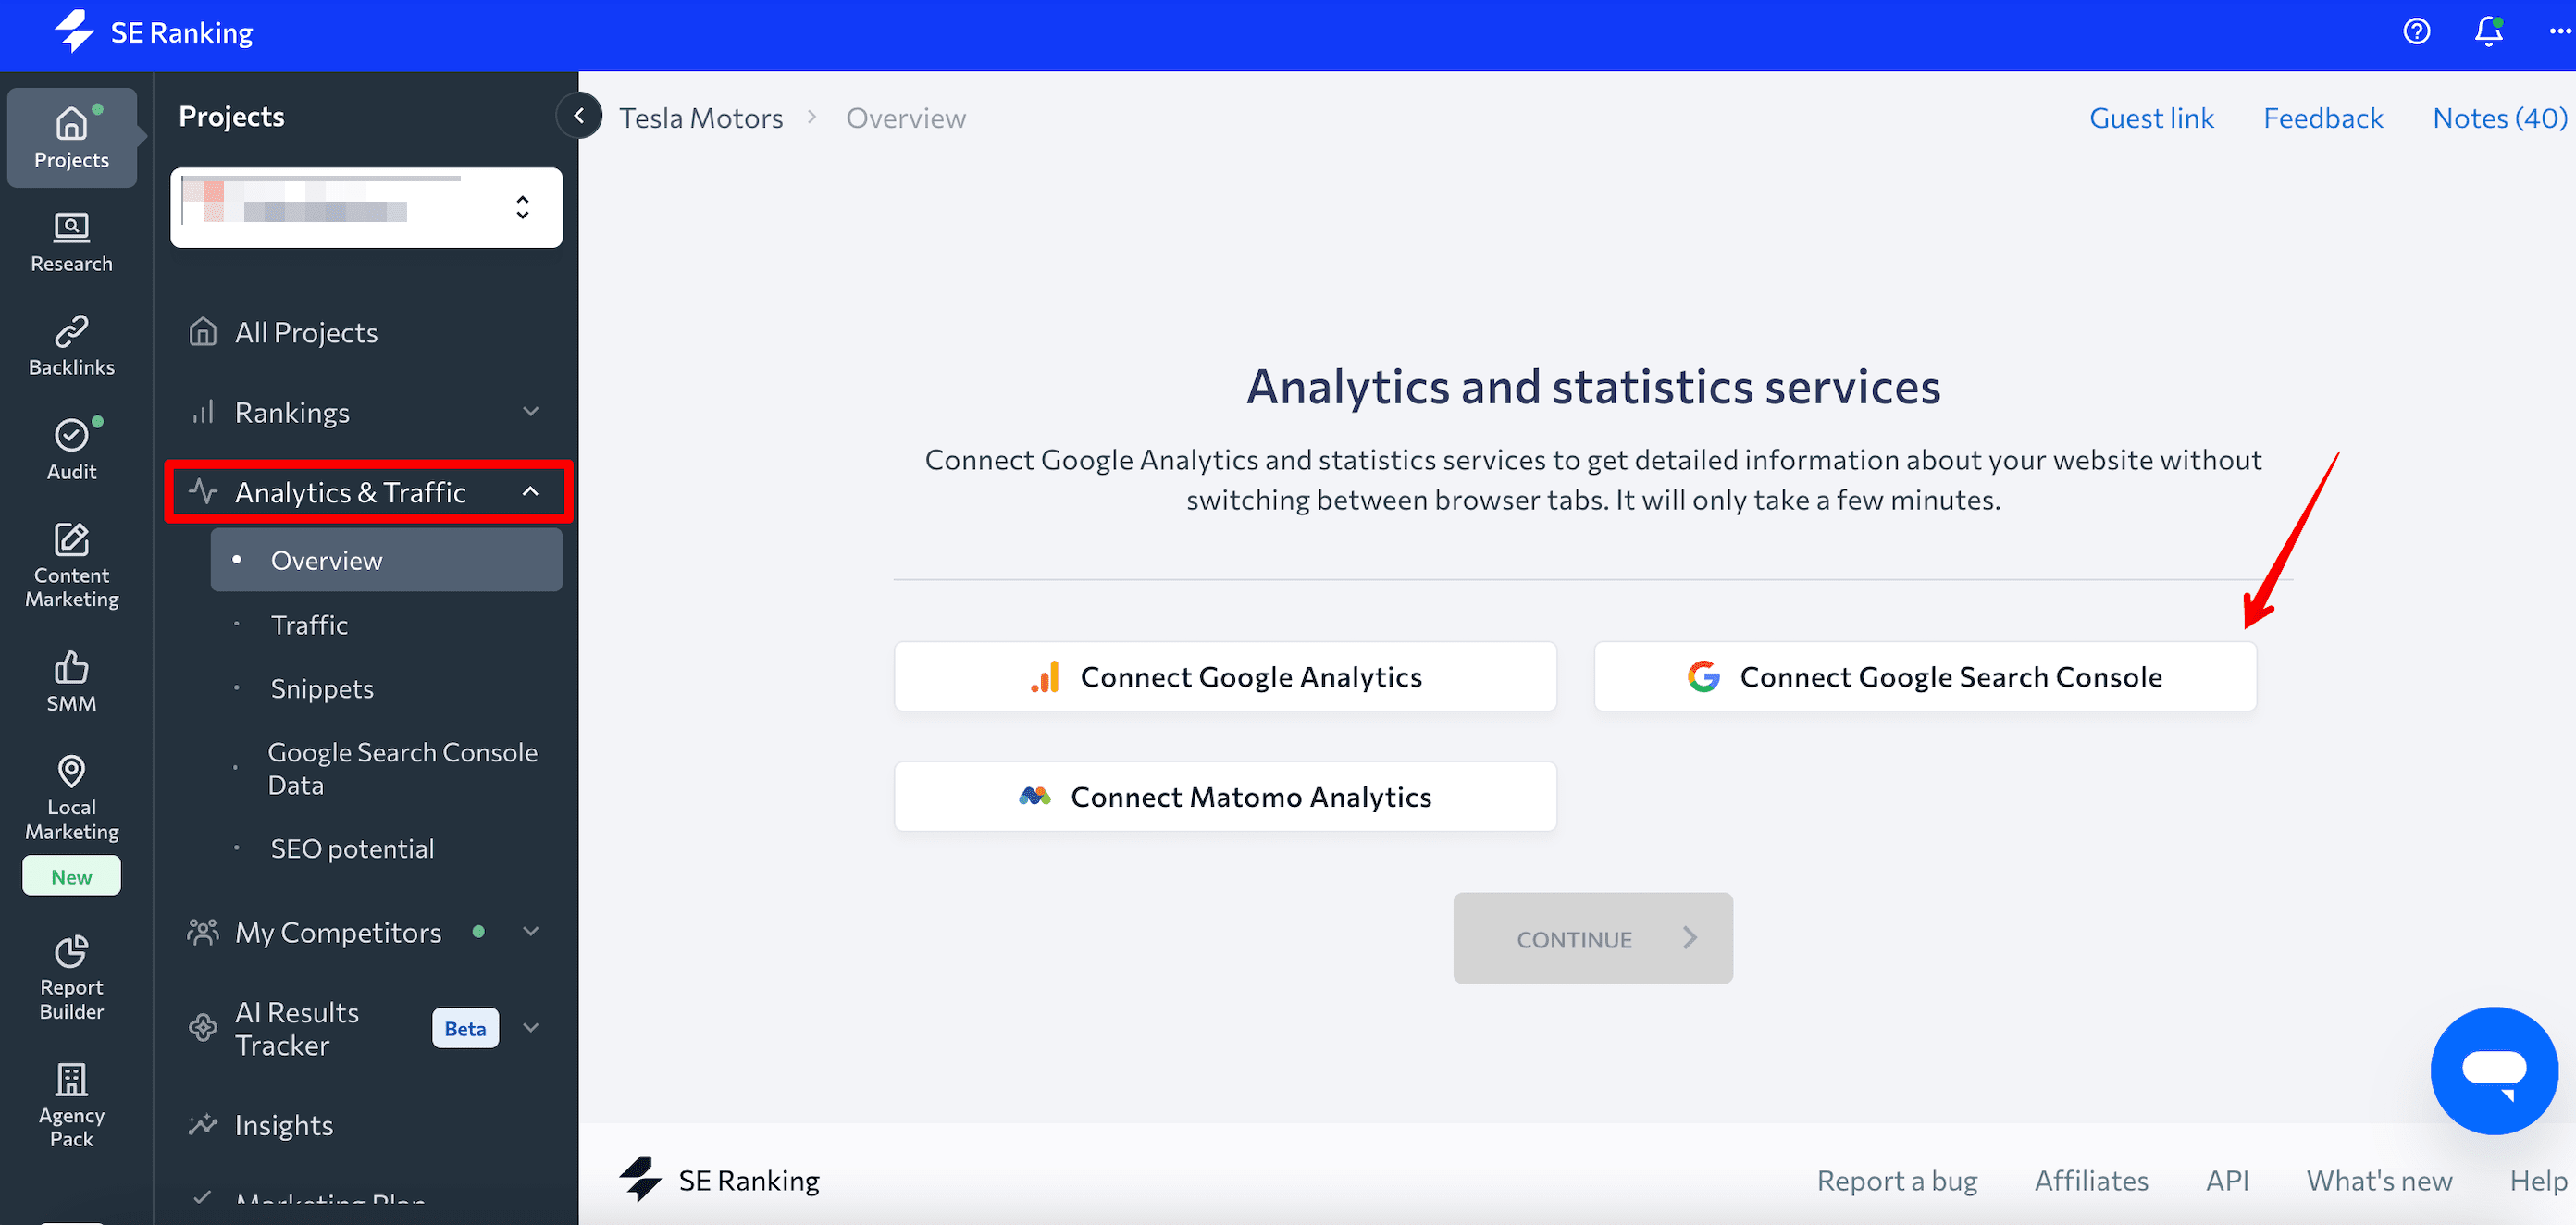
You can also connect to Google Analytics in the same window.
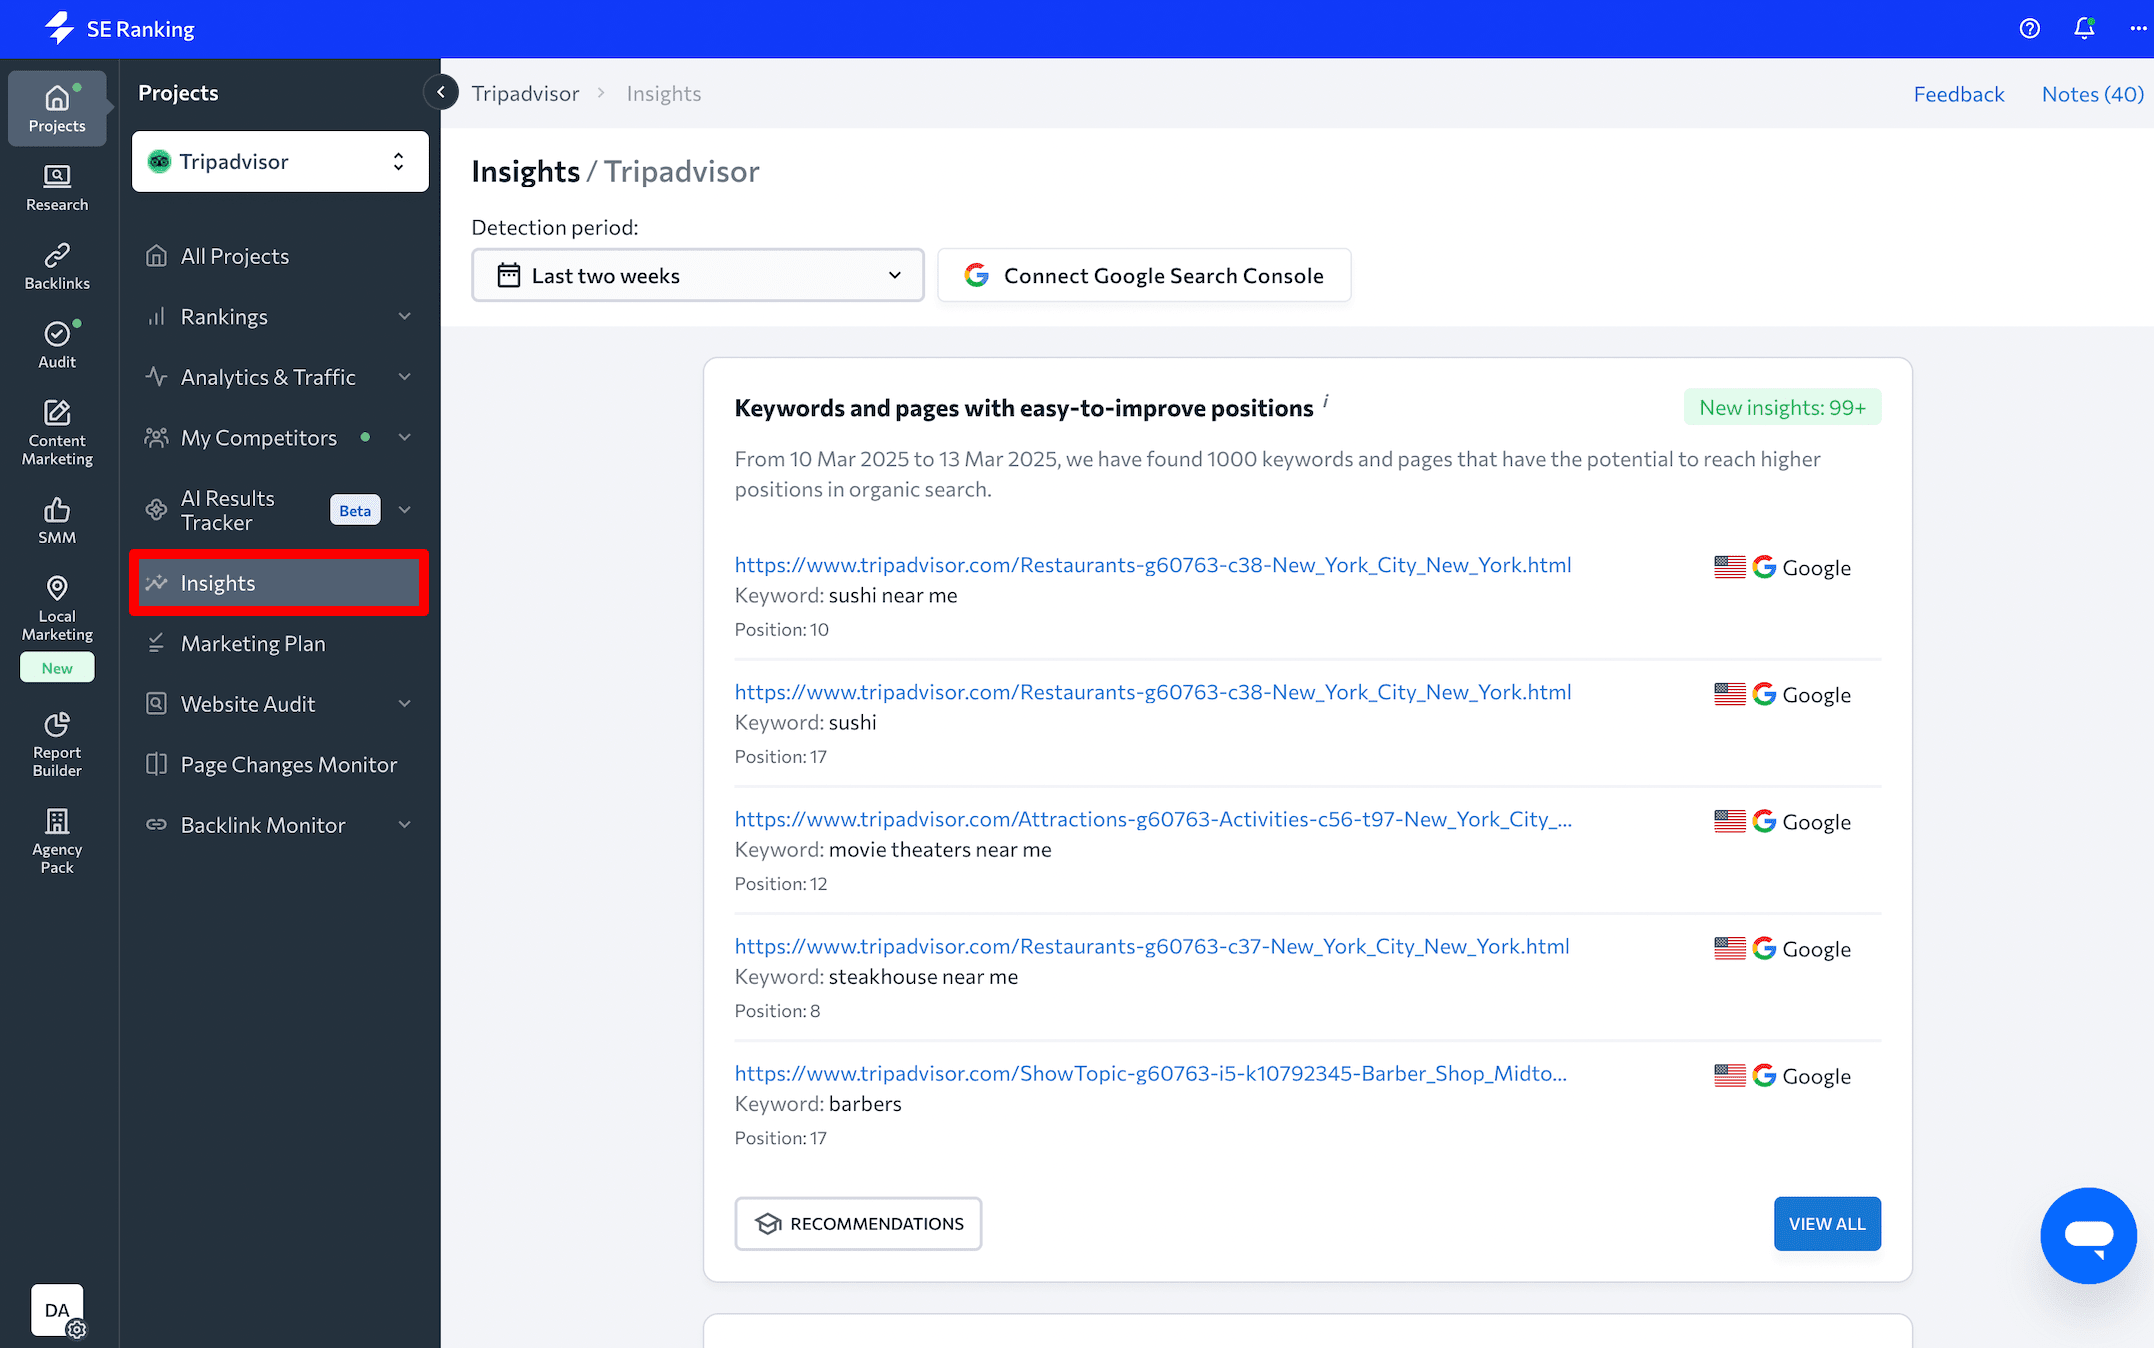
SE Ranking’s Insights feature is another valuable option. It gathers data from GSC and presents important insights and previously hidden details about your projects. For example, based on data from Google Search Console, the tool displays keywords that have experienced a significant increase or decrease in the number of impressions or clicks.
Conclusion
Google Search Console can provide a new perspective on your website’s performance. By using the Performance and Page Experience reports, you can evaluate how well your site is doing. With the wealth of data you get from it, you can easily assess which pages perform well and which ones need to be improved. This makes it possible to build a well-thought-out SEO strategy tailored to your website’s needs.
FAQ
Google Search Console is a tool offered by Google that helps website owners monitor, maintain, and troubleshoot their site’s presence in Google Search results. It provides insights into search performance, indexing status, and potential issues affecting your site.
Yes, Google Search Console is completely free to use.
GSC collects data from Google’s web crawlers about how they interact with your site. It provides reports on search traffic, indexing status, potential issues, and rankings, allowing you to monitor and improve your site’s visibility in search results.
Go to search.google.com/search-console/welcome. Sign in with your Google account and enter your website. Then verify your website property. Follow the verification options provided (domain ownership verification via DNS record, adding a tag, uploading an HTML file, using a Google Analytics tracking code, or incorporating a Google Tag Manager container snippet).
GSC helps you monitor your site’s search performance, identify and fix issues, submit sitemaps, and understand how Google crawls and indexes your site.
You can connect GSC with your Google Analytics account to merge data from both tools and display it in the Search Console tab (Queries and Google organic search traffic reports).
To link your Google Search Console account with Google Analytics, navigate to the Admin section in Google Analytics, then under Product Links, select Search Console Links. Click the Link button, choose your Search Console account, and select the corresponding web data stream.
Use GSC to identify high-performing keywords and optimize content for them, monitor click-through rates, fix crawl errors, and submit updated sitemaps. Regularly check the Performance and Indexing reports to stay informed.
Go to the Sitemaps report under the Indexing section, enter your sitemap URL (e.g., https://www.yoursite.com/sitemap.xml), and click Submit.
In GSC, go to the Pages report under the Indexing section. Scroll down to the list of issues and select Not found (404). You’ll then see a list of all pages returning a 404 error.
In GSC, navigate to the Links report. This section provides insights into both internal and external links to your site, including top linking sites, pages, and anchor text. You can also export backlink data for further analysis.
Core Web Vitals are metrics that measure user experience on your site, focusing on loading performance, interactivity, and visual stability. You can monitor them in GSC under the Core Web Vitals report in the Experience section.
In Google Search Console, open the URL Inspection tool and paste the full page URL into the search bar at the top. Press Enter to see its indexing status, potential issues, and the date it was last crawled. You can also run a live test to view how Googlebot sees the page in real time and, if needed, request indexing.
