Google Page Experience Factors: Mobile-Friendliness, Core Web Vitals, HTTPS
Google rewards websites that provide users with a good page experience. If you want your website to be successful, you should focus on optimizing it for as many page experience factors as possible. In this article, we’ll cover the key principles of page experience and provide actionable tips for page optimization. This will help maximize the likelihood that Google Page Experience ranking algorithms will reward your pages.
What is Google Page Experience
Google Page Experience is a set of signals that measure how users perceive their interaction with a given web page. This concept was introduced in May 2020 and has undergone several updates since then.
Google has always prioritized websites that provide seamless user experiences, showcasing them at the top of SERP results. In the past, Google’s algorithms focused primarily on website speed. But to provide a positive user experience, a website must not only load quickly but also be convenient to use and provide real value to visitors. Google’s Page Experience update places a higher emphasis on user experience than ever before.
Google uses several important signals to evaluate how users perceive and interact with a given web page, including:
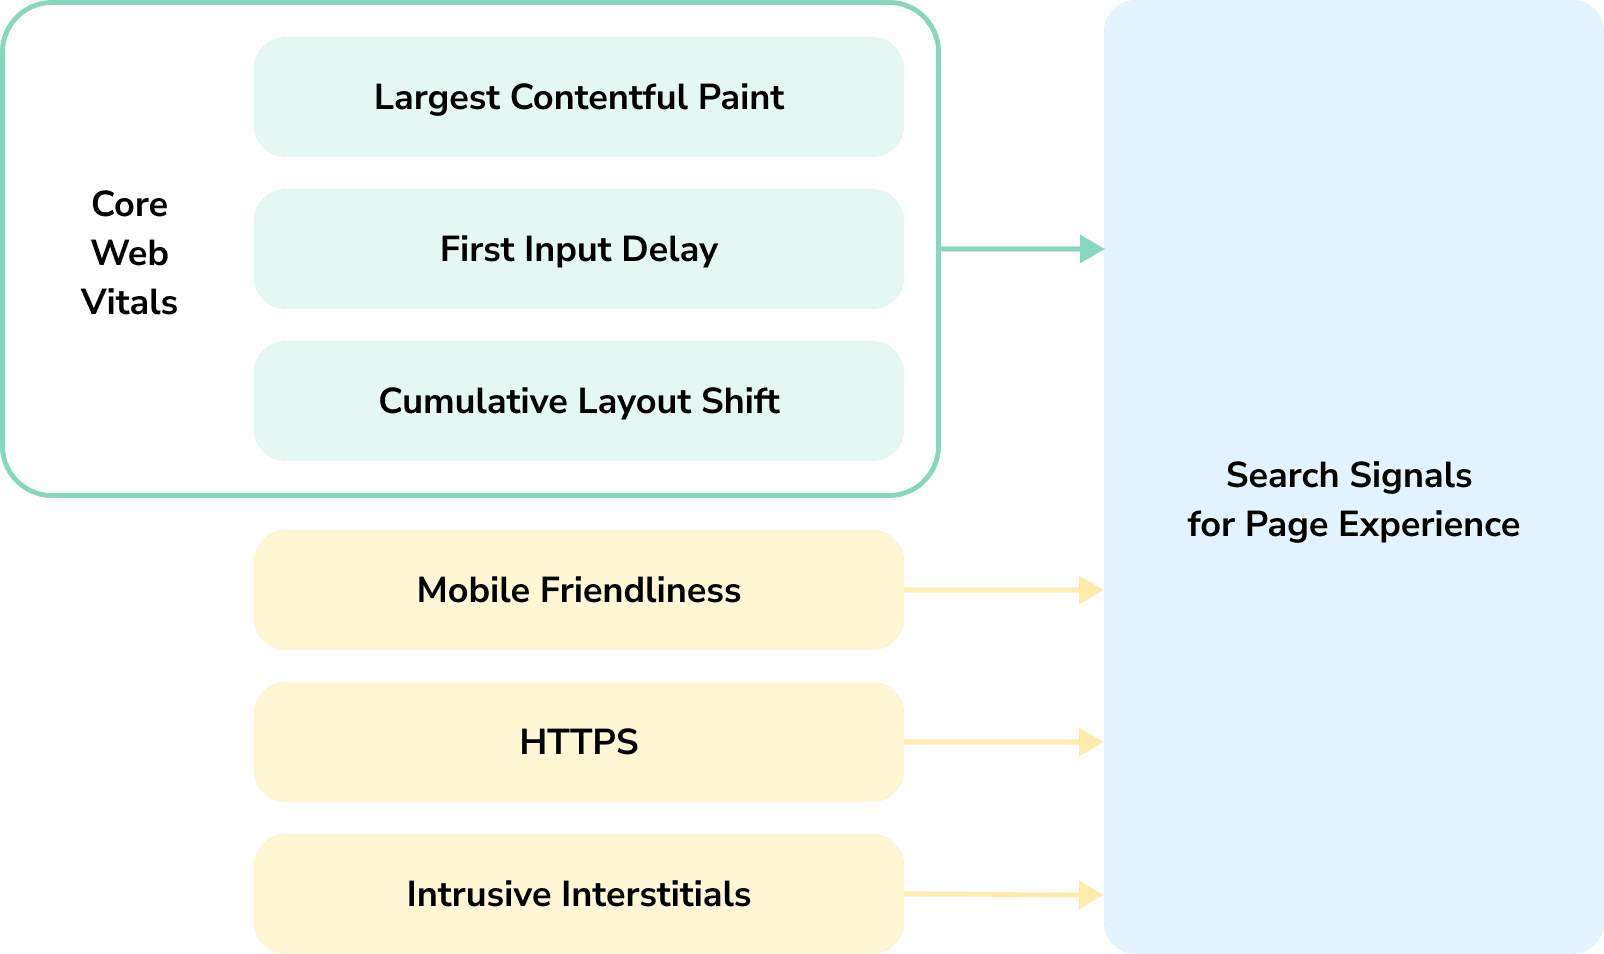
- Core Web Vitals: A subset of metrics that measure the loading performance of a web page for users, including speed, responsiveness, and visual stability.
- Mobile usability: The convenience of accessing and using a web page on a mobile device.
- HTTPS security: The number of indexed HTTPS vs HTTP URLs.
- Intrusive interstitials: The presence of any pop-ups or ads that interrupt the user experience and block content from view.
To receive a high page experience score, site owners must optimize their pages for every aspect possible. This includes adopting and implementing each core ranking signal to ensure that their websites provide the best value to users and get better rankings in search engine results pages.
How Page Experience works
Google has stated that page experience can impact how a site ranks in search results, but the exact mechanism is still not fully understood. However, we do know that Google’s core ranking systems look for content that provides a good experience for page users. It also rewards quality pages with higher rankings.
Google Page Experience algorithms rely on ranking signals to assess a page’s relevance to a user’s needs and overall user experience. While not all of these signals may not directly influence ranking, all aspects of page experience are worth your attention, as they contribute to success in search rankings.
Here are some key insights into how Google Page Experience signals work:
- Page Experience is not a standalone ranking factor. It’s part of a comprehensive ranking system that includes Core Web Vitals, Page Experience, and Helpful Content System. All these signals complement each other and are used together to rank websites. When multiple websites have very similar answers or content for a query, the ranking system tends to prioritize pages with a good user experience, presenting them higher in search results.
In addition to these factors, systems like Navboost analyze user behavior signals—such as clicks and dwell time—to help Google better understand and respond to search intent. Learn more in our Navboost guide.
- In some cases, Google may not factor in page experience for ranking, or it may assign it less importance than other ranking factors. For example, if Google understands that a user has a clear search intent and expects to see a specific search result, it may show that page at the top of the SERP, even if it has a poor page experience score.

- Page Experience factors are not the primary cause of drops in rankings. If your website experiences a sudden drop, it is important to examine multiple factors, including technical issues, page quality rating, content, and backlinks.
The importance of optimizing for Page Experience
Page experience is a critical factor for both SEO and business success. When a page provides value and a good user experience, it leads to:
- Improved SEO: Google values pages with good page experience and rewards them with higher positions in Search, which means more people are likely to see and visit them. Higher rankings lead to better visibility and more traffic to your website.
- Higher user engagement: A good page experience can positively impact behavioral factors, such as bounce rate and time spent on the page. This is because users are more likely to stay on a page longer and engage with the content if it offers a convenient and enjoyable user experience. Additionally, a good page experience can encourage visitors to explore more of your website or come back again in the future.
- Increased conversions: Users are more likely to convert into leads or customers if they have a good experience on your website. This is because a good page experience builds trust with users, increasing the likelihood that they will take the desired action, such as signing up for your newsletter or making a purchase.
Overall, optimizing for Google Page Experience is essential for any business that wants to succeed online. It can help you attract more visitors, increase engagement, and boost conversions.
Google Page Experience Factors and SEO
Let’s take a closer look at each signal.
Core Web Vitals
Core Web Vitals is a set of three metrics that measure the loading performance, interactivity, and visual stability of a web page. This concept was introduced in 2020 and remains a critical element of the Page Experience ecosystem. CWV includes the following metrics:
- Largest Contentful Paint (LCP): This metric shows how long it takes to load the largest content element in the viewport. A good LCP should be less than 2.5 seconds, while 4 seconds is considered a bad result.
- Interaction to Next Paint (INP): This metric measures how quickly a website responds to user interactions, considering all interactions rather than just the first one. To provide a good user experience, aim for an INP of less than 200 milliseconds. INP replaced FID as a Core Web Vital in March 2024.
- Cumulative Layout Shift (CLS): This metric is a measure of the largest burst of unexpected layout shifts that occur during a page’s lifespan. A burst of layout shifts occurs when one or more individual layout shifts occur in rapid succession. You should strive for a CLS of 0.1 or less to comply with Google’s latest standards.
To qualify for a “Good” page experience in Search Console, a page must have a Core Web Vitals rating of “Good” in CLS, LCP, INP. You can access these scores with the Core Web Vitals Report in Search Console. Pages are evaluated from both a mobile and desktop standpoint, so there is a separate page score for each platform.
Pages with good Core Web Vitals will load quickly, have good interactive elements, and have a stable layout. This makes the page more enjoyable to use and keeps users more engaged. This means that pages with good Core Web Vitals are more likely to rank high in search results.
Mobile-Friendliness
With the introduction of Google’s mobile-first indexing in July 2019, it has become essential to focus on mobile optimization and ensure that content is accessible for both desktop and mobile users.
Having a mobile-friendly website is vital for user-friendliness and improving page experience. Follow UX SEO best practices to ensure that users have a good user experience when browsing your site on mobile devices.
To qualify for “Good” status in the Page Experience report, your site must have no mobile usability errors, including:
- Site does not use incompatible plugins.
- Viewport is set to “device-width”.
- Content is not wider than the screen.
- Text is large enough to read.
- Clickable elements are far enough apart.
Websites that are optimized for mobile devices are more likely to achieve higher search rankings and attract organic traffic from mobile users.
HTTPS
Google has deemed all HTTP websites to be obsolete and not secure since September 2016. Websites that do not use HTTPS are labeled “Not Secure” in the browser. This notifies users that the data on the site is not encrypted or protected from possible attacks during data transmission.
HTTPS security is now a page experience signal, meaning that it has a substantial impact on the Google algorithm and a website’s performance in SERPs. To be eligible for a “Good” result in the Page Experience report, a page must be served over HTTPS.
The Page Experience report displays the number of indexed URLs on a site that are HTTP vs HTTPS. If your website has too high a ratio of HTTP URLs, you will receive a warning. Switching from HTTP to HTTPS on your website is imperative and can even give you an SEO boost.
Intrusive Interstitials
Popups (features that block part of a page) and intrusive ads can all have a negative impact on website rankings and user experience. Interstitials are important for page experience because they can greatly impact how users interact with a website. Intrusive interstitials can be annoying and disruptive, and they can make it difficult for users to find the information they’re looking for. This can lead to users abandoning a website altogether.
Google assesses interstitials for page experience by looking at whether they block or interfere with the main content of a page, or make it difficult for users to access. Google considers intrusive interstitials to be a negative user experience, and may penalize websites that use them. To qualify for a “Good” result in the Page Experience report, a page must not have any intrusive interstitials.
Google has also made several exceptions to the general penalization rule for intrusive interstitials, including non-publicly indexable login dialogs and pop-ups that comply with the law. More examples of these exceptions include login dialogs on e-commerce websites, pop-ups that inform users about their privacy rights, and pop-ups that display age verification warnings.
Non-intrusive interstitials can still be beneficial for online businesses. They can help you gather qualified leads and increase conversion rates. When used correctly, non-intrusive interstitials make for valuable tools for online businesses.
However, it is important to use them sparingly and to make sure that they do not disrupt the user experience. If you are using interstitials on your website, it is important to make sure that they do not disrupt the user experience, hence non-intrusive. You can do this by following these tips:
- Avoid pop-up banners that cover most or all of the page.
- Provide an easy way to dismiss the pop-up.
- Avoid pop-ups that slow your page load time.
- Ensure that a pop-up doesn’t follow a user once they close them.
By following these tips, you can avoid the negative impacts of intrusive interstitials on your website rankings and user experience.
Until 2021, Google Page Experience also included the Safe Browsing algorithm, which protected users from harm by analyzing websites for dangerous or deceptive content. Although Safe Browsing is no longer part of Page Experience, Google still expects websites to provide a safe browsing experience for visitors. To ensure the best possible user experience, ensure the website is served over a secure HTTPS connection and is free of malicious or deceptive content, such as malware or phishing.
Google’s Page Experience signals emphasize mobile usability and clear navigation. These can be more challenging for single-page websites, which often rely heavily on JavaScript and dynamic loading. Learn how to make them SEO-friendly in our single-page website guide.
How to Optimize Websites for User Experience
Now that we’ve discussed the main aspects of the Google Page Experience, you should know which parameters to focus on so you can identify areas for improvement regarding user experience. Here is a short rundown of what you can do to actually improve page experience signals and boost your SEO:
- Improve website loading speed. A slow-loading website is a major UX turn-off. Use Google PageSpeed Insights to test your website’s loading speed and identify areas for improvement. Some common ways to improve loading speed include code minification, content optimization, and hosting upgrades.
- Make your website responsive by using viewport. Set the “width” attribute to a specific number of pixels, or use the “device-width” value, which will tell the browser to render your website at the width of the device’s screen.
- Ensure the site’s mobile-friendliness. Use a responsive layout, relative font sizes and other dimensions, fluid images and videos, and a clear and consistent navigation menu. Opt for small messages, elements, banners, and slide-ins to avoid cluttering your pages with large messages. Optimizing images also improves UX and boosts visibility in Google Images. For tips on image formats, alt text, and SEO, check out our Google Image SEO guide.
- Check for security vulnerabilities. Use a dedicated website audit tool to identify any security issues. If you find any security issues on your website, fix them immediately.
- Update all plugins, themes, PHP version, and WordPress version. Keep all of your software up to date, as outdated software is more likely to contain security vulnerabilities and performance issues.
Monitor Website Performance
Google offers several tools for testing website usability and identifying areas for improvement. These include Search Console, PageSpeed Insights, and Chrome Lighthouse. You can also use professional site audit tools, like SE Ranking or other specific plugins, to get more specific data.
Google Search Console
Google Search Console for SEO is your primary source of data for page experience. It provides a variety of tools that can help you identify performance issues on your website, including Core Web Vitals, mobile usability, and HTTPS. The Page Experience report in Google Search Console provides a summary of the user experience visitors have on your site. Google assesses page experience separately for both mobile and desktop versions of each URL.
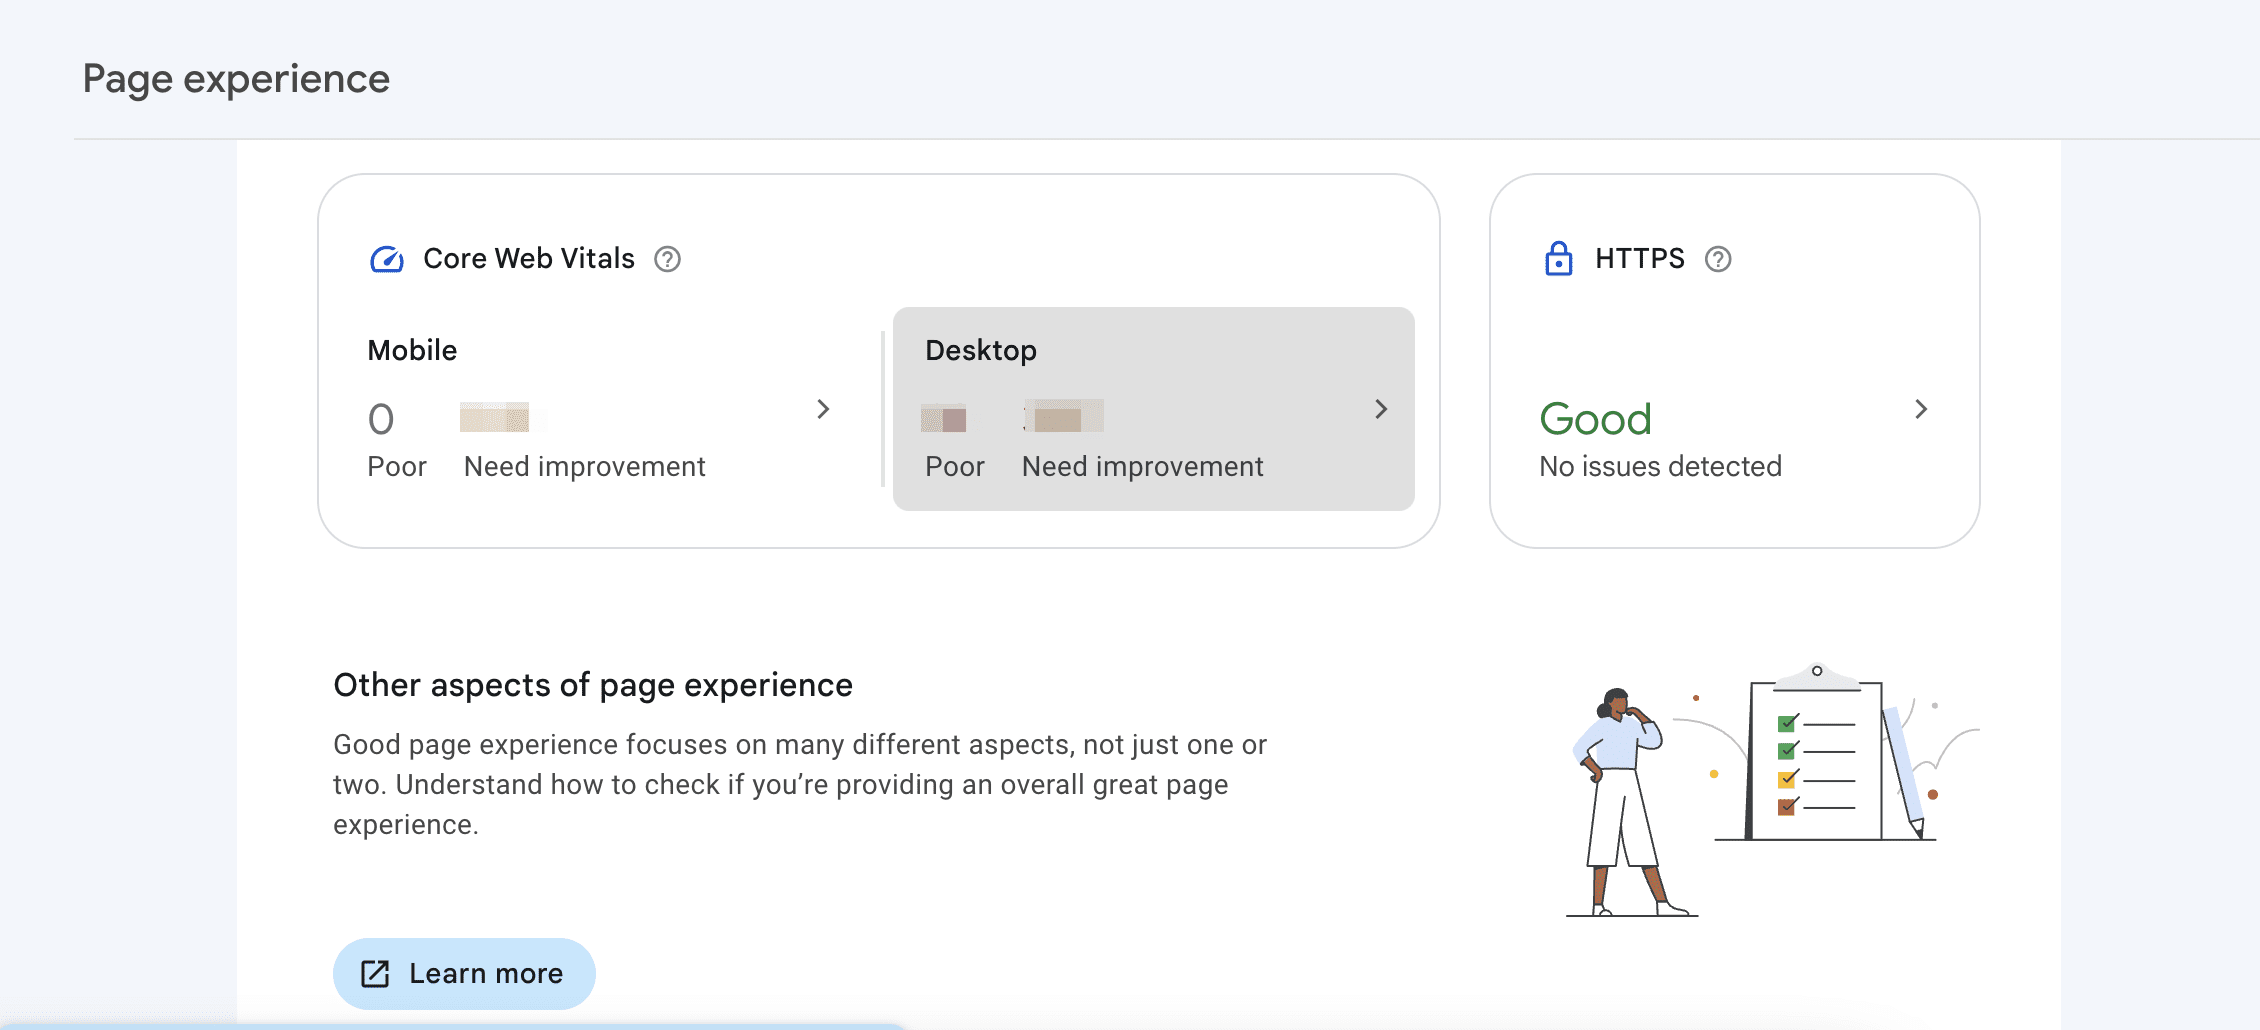
The Overview dashboard only features insights on the website’s Core Web Vitals scores for mobile and desktop and HTTPS usage. There’s a disclaimer stating that page experience involves other aspects not presented in the report.
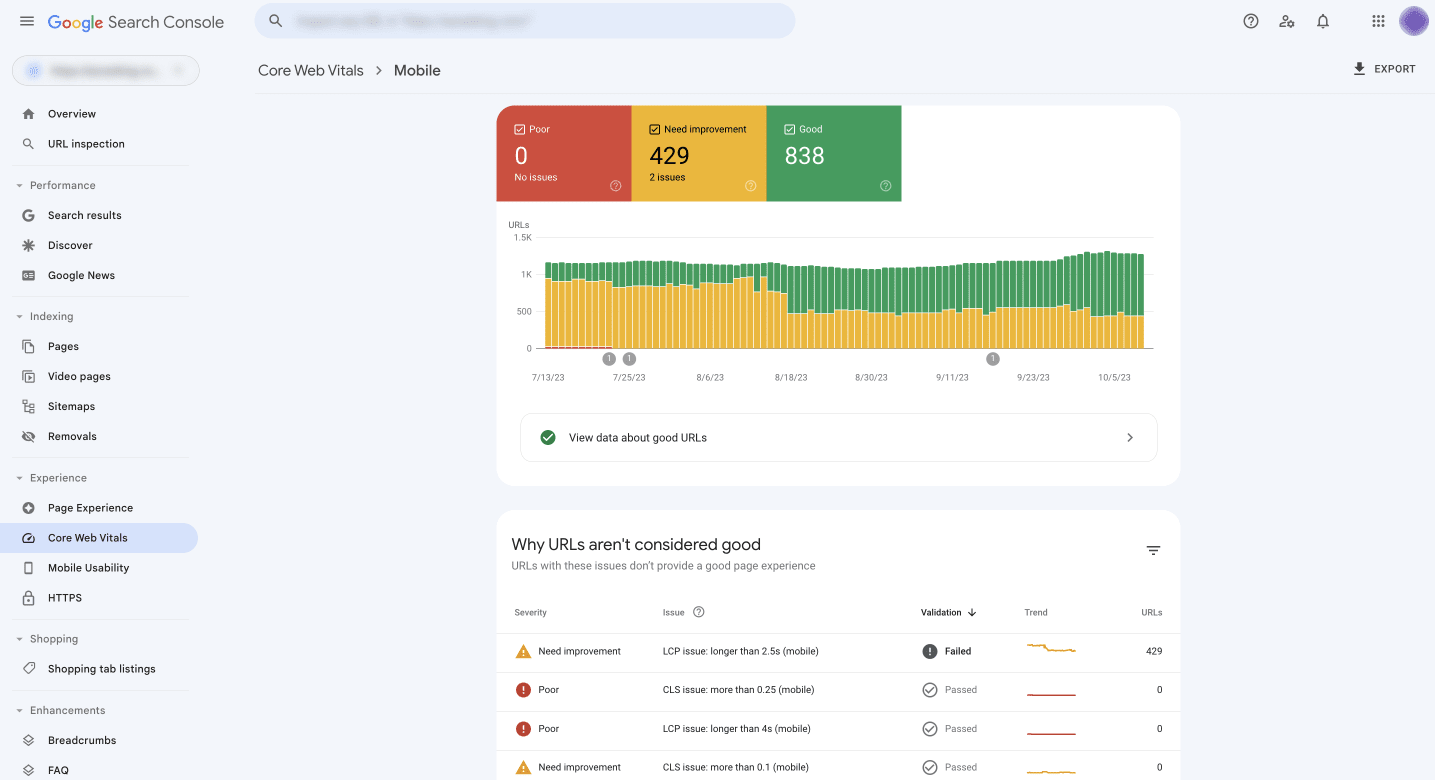
Clicking on a specific section of the Page Experience report provides more information about each issue, including insights into how to fix them. For example, if you click on Core Web Vitals, you will see a dashboard that shows the number of URLs that passed the CWV checks alongside the number of URLs that need improvement. Below the dashboard, you will see a list of the most common issues.
The Page Experience report serves as a helpful resource, but it is intended as a general guidepost of key metrics associated with good page experience. It is not a comprehensive assessment of all factors. To ensure a good page experience, you should take a holistic approach and use a professional tool.
SE Ranking Website Audit
SE Ranking features a powerful website technical audit tool that can crawl any website in minutes to assess its overall health score. It can also identify issues that can hinder its performance, explain them, and then provide actionable tips on how to fix them.
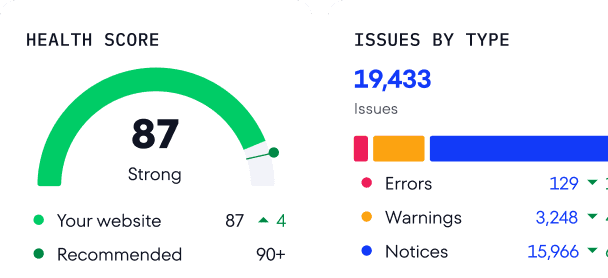
SE Ranking allows you to access a complete list of all crawled URLs and analyze them individually. On the other hand, Search Console only shows the number of URLs that have issues associated with them. You can then use the on-page SEO checker to analyze these URLs one by one, specifically for page-level technical and SEO issues. With data from SE Ranking, you can gain a deeper understanding of your site’s optimization level for Page Experience and develop a plan to address any issues.
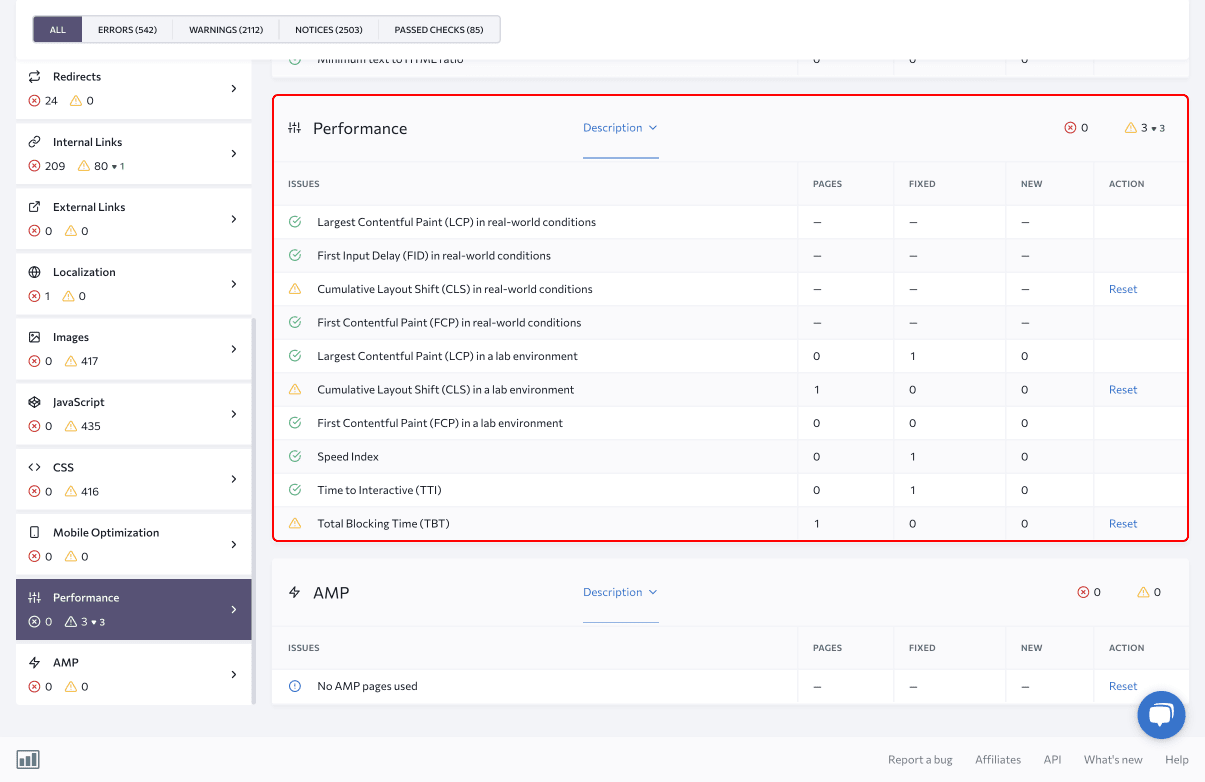
The Issue Report section in Website Audit is a useful tool for analyzing Page Experience performance. Start by checking the Performance tab, which shows website quality metrics related to user experience, such as Core Web Vitals results.
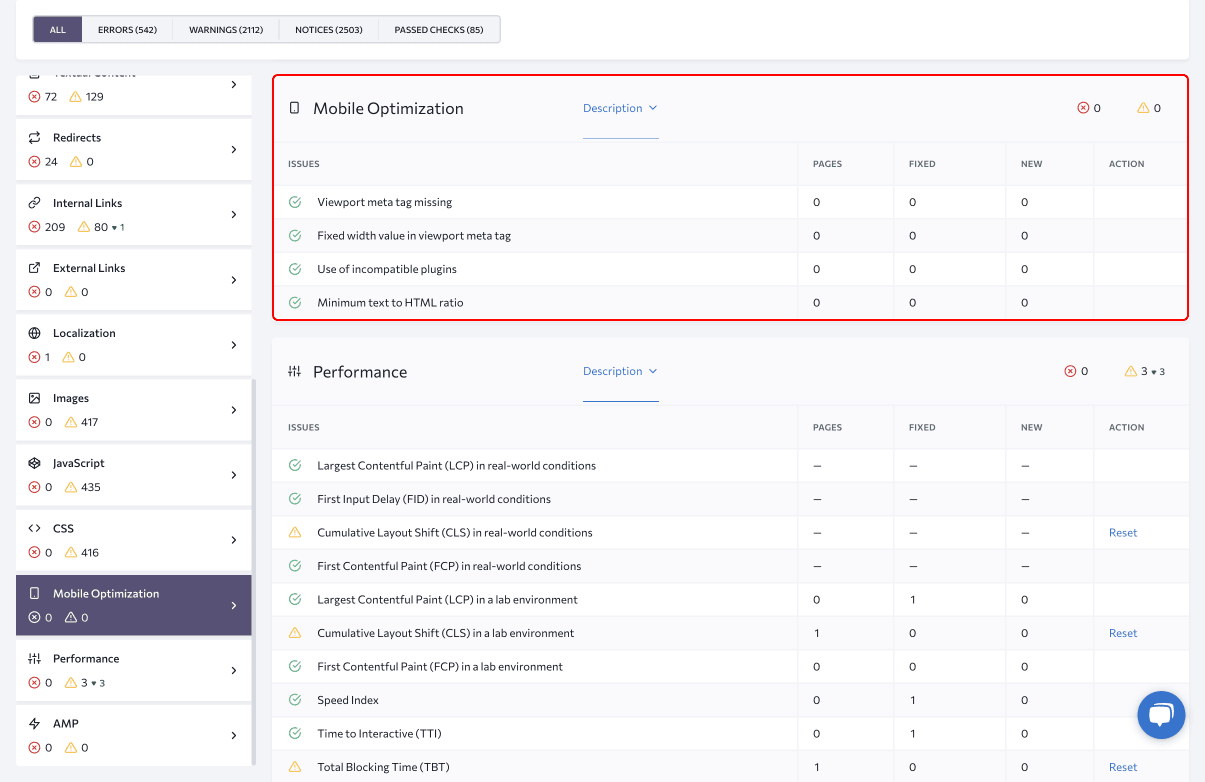
The Mobile Optimization section contains issues and recommendations for making your site mobile-friendly. Having a website that works well on smartphones and tablets can boost search engine rankings, improve user experience, and increase conversions.
Finally, check the Website Security section, which contains errors associated with HTTPS and HTTP links.
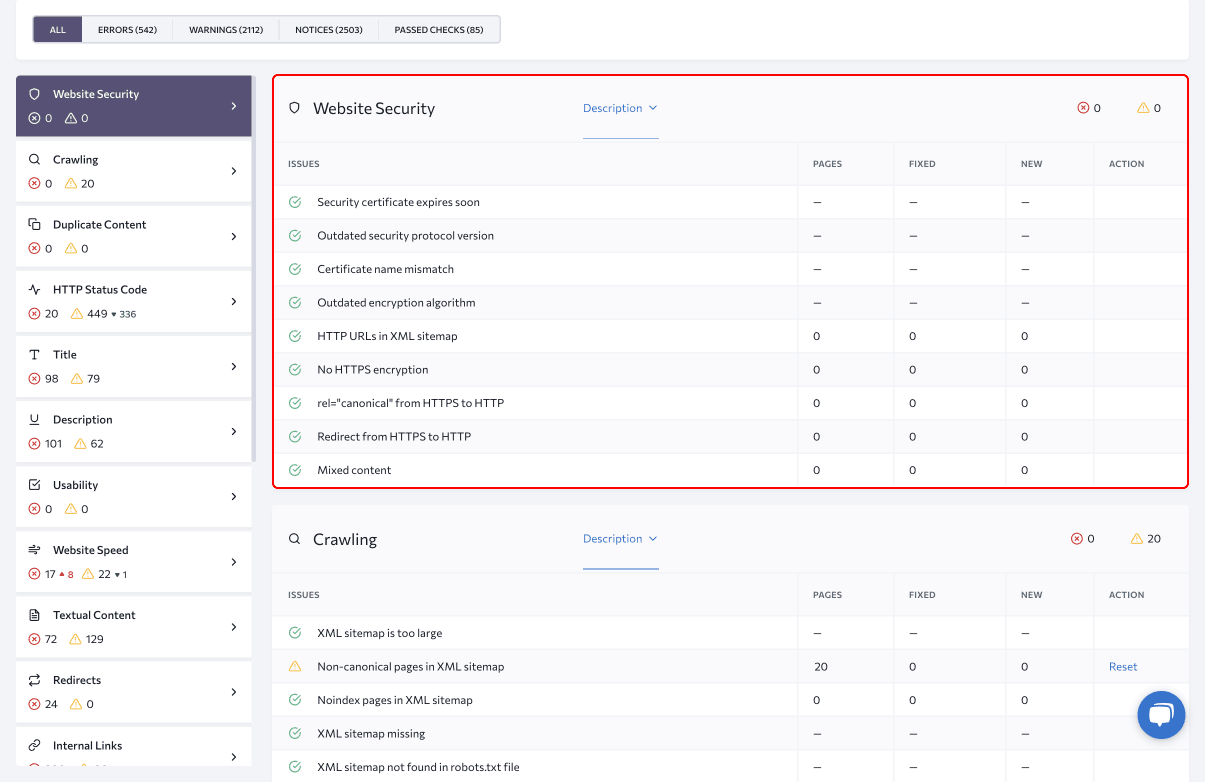
The tool categorizes issues as errors and warnings. Focus on fixing errors first, as they can have a significant impact on site performance and rankings. Don’t forget to review the other tabs and sections, as they may contain additional helpful information for your project.
Conclusion
Page experience is an increasingly important factor in SEO, as Google continues to prioritize user-friendly websites. Here are a few key takeaways from this article:
- Page experience is a measure of how users perceive your website when they visit it.
- Google considers a variety of factors when evaluating page experience, including loading speed, visual stability, mobile usability, and security.
- Optimizing your website for page experience can improve your search engine rankings, attract more visitors, and increase your chances of converting them into customers.
To get started, use Google Search Console to pinpoint areas where your website can be improved. Also, consider using specialized tools like SE Ranking to improve your website’s performance and usability. By investing in page experience, you can create a website that is both user-friendly and successful in organic search.