AI Mode now shows ads on nearly 1 in 3 commercial queries
AI Mode went from an answer engine to an ad surface in under a year. Ads started showing up inside AI Mode responses in late 2025, and by mid-2026 Google was building formats specifically to sell them.
That raised a practical question: what does the ad situation in AI Mode actually look like?
To find out, we analyzed 50K commercial keywords across 20 niches, all chosen to trigger text ads rather than product carousels.
Here’s what we found.
-
Ads now appear on nearly 1 in 3 commercial AI Mode queries. In 71.1% of cases, an AI Mode answer contained two ad items.
-
CPC predicts placement better than anything else. Ad presence climbed from 24.33% on sub-$2 keywords to 53.56% at $10 and above
-
Buying an ad won’t get your site cited. In 88% of ad keywords, the advertiser’s domain wasn’t among the sources AI Mode cited.
-
Ad presence swings wildly by niche, from 72% to under 3%. Lead-generation verticals surface ads heavily; informational and YMYL verticals rarely do.
-
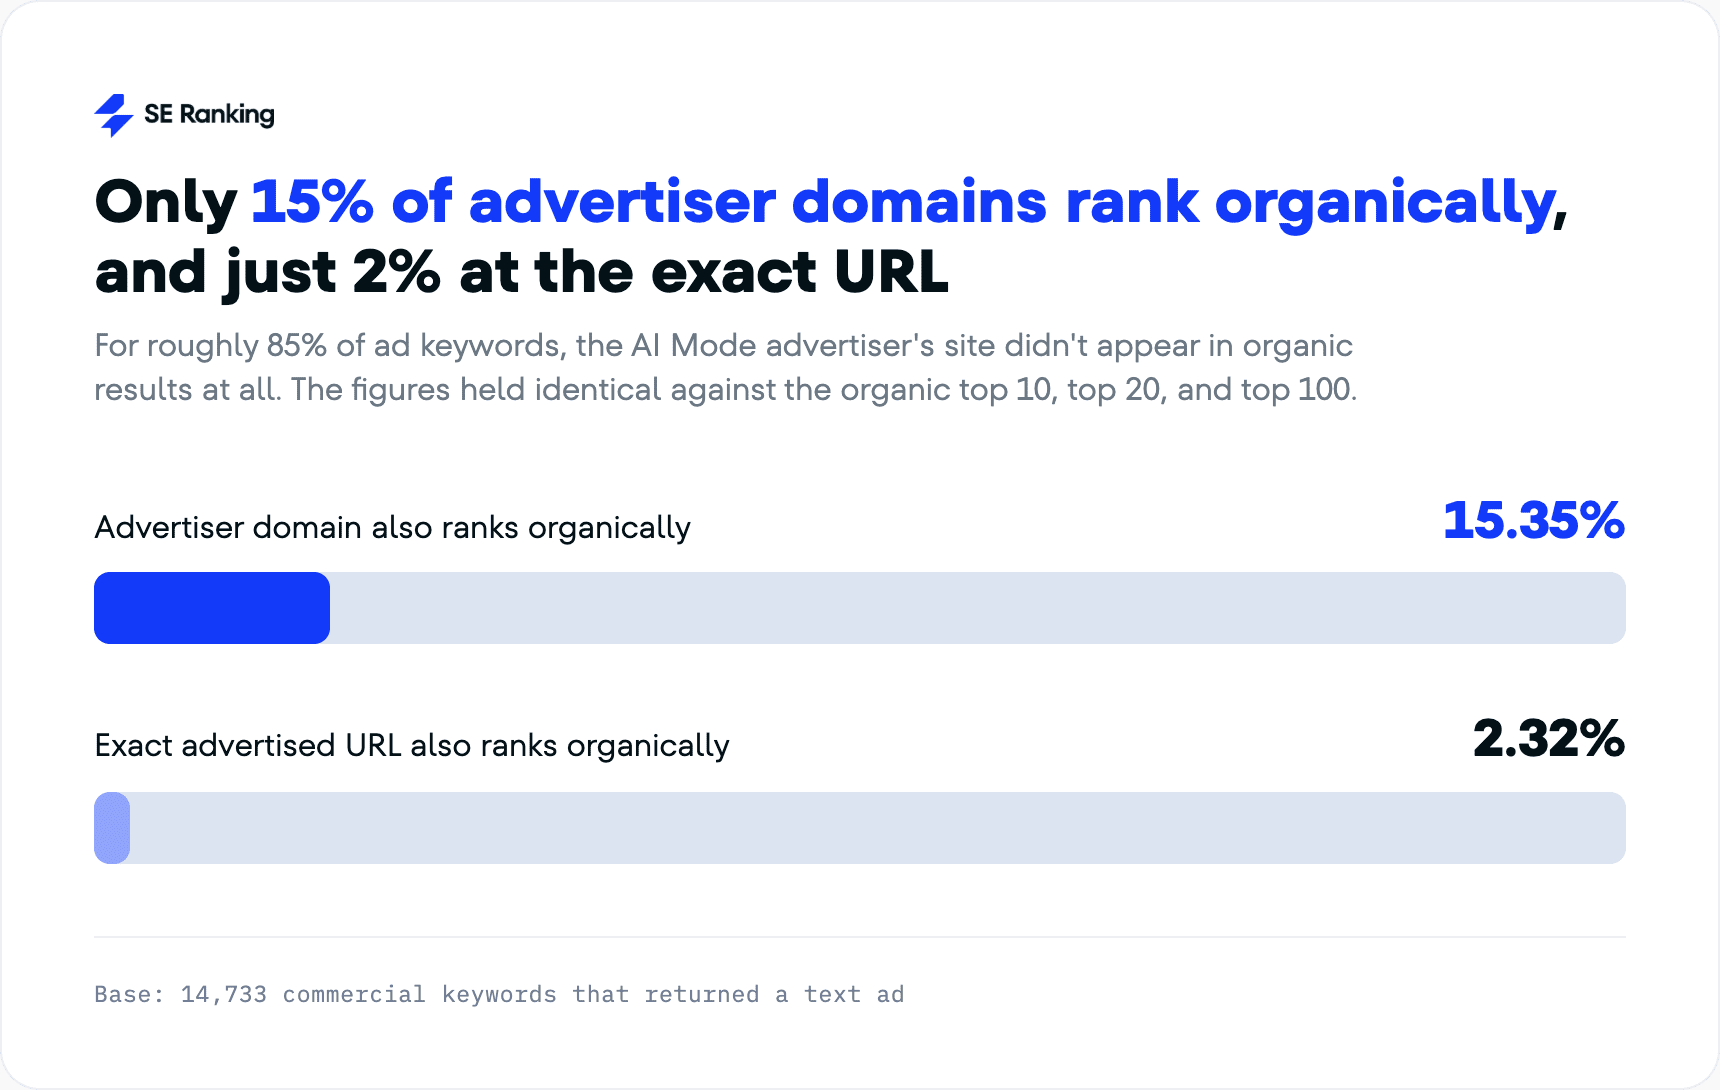
Most advertisers don’t rank organically for the keywords they bid on. For about 85% of ad keywords, the advertiser’s site wasn’t in organic results at all.
AI Mode returns a text ad on nearly 1 in 3 commercial queries
Out of the 50,032 commercial keywords we analyzed, 14,733 returned a text ad in AI Mode. That is 29.45%, or close to one in every three queries.
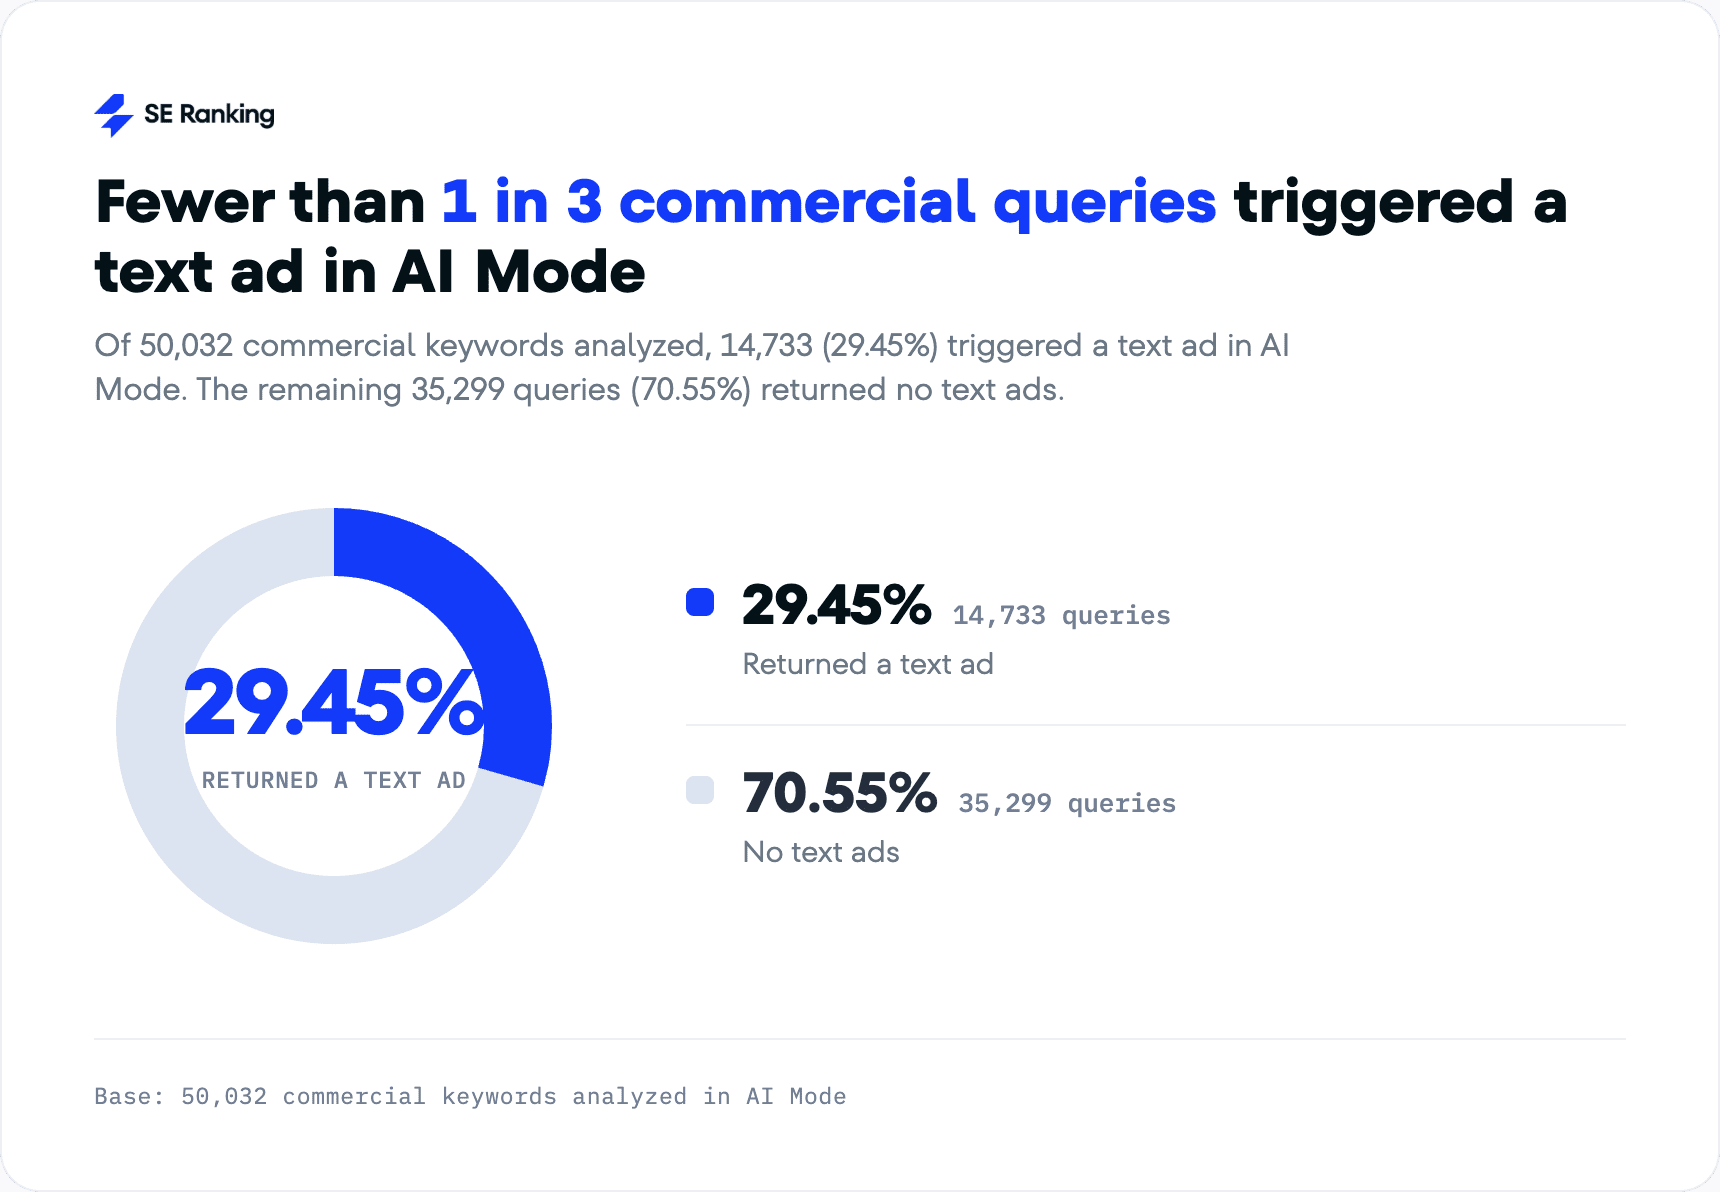
Treat 29.45% as a floor, not a ceiling. AI Mode is volatile, and the same query can return an ad in one session and nothing in the next. This is a single large snapshot, so the true frequency is more likely above 29.45% than below it.
The read on this: The speed is the story. This went from zero ads to a third of commercial queries in well under a year, so whatever ad exposure you’re seeing today is more likely a starting point.

7 in 10 ad results put you next to a competitor
71.1% (10,475) of keywords returned two ad items shown together, and only 28.9% (4,258) returned a single one.
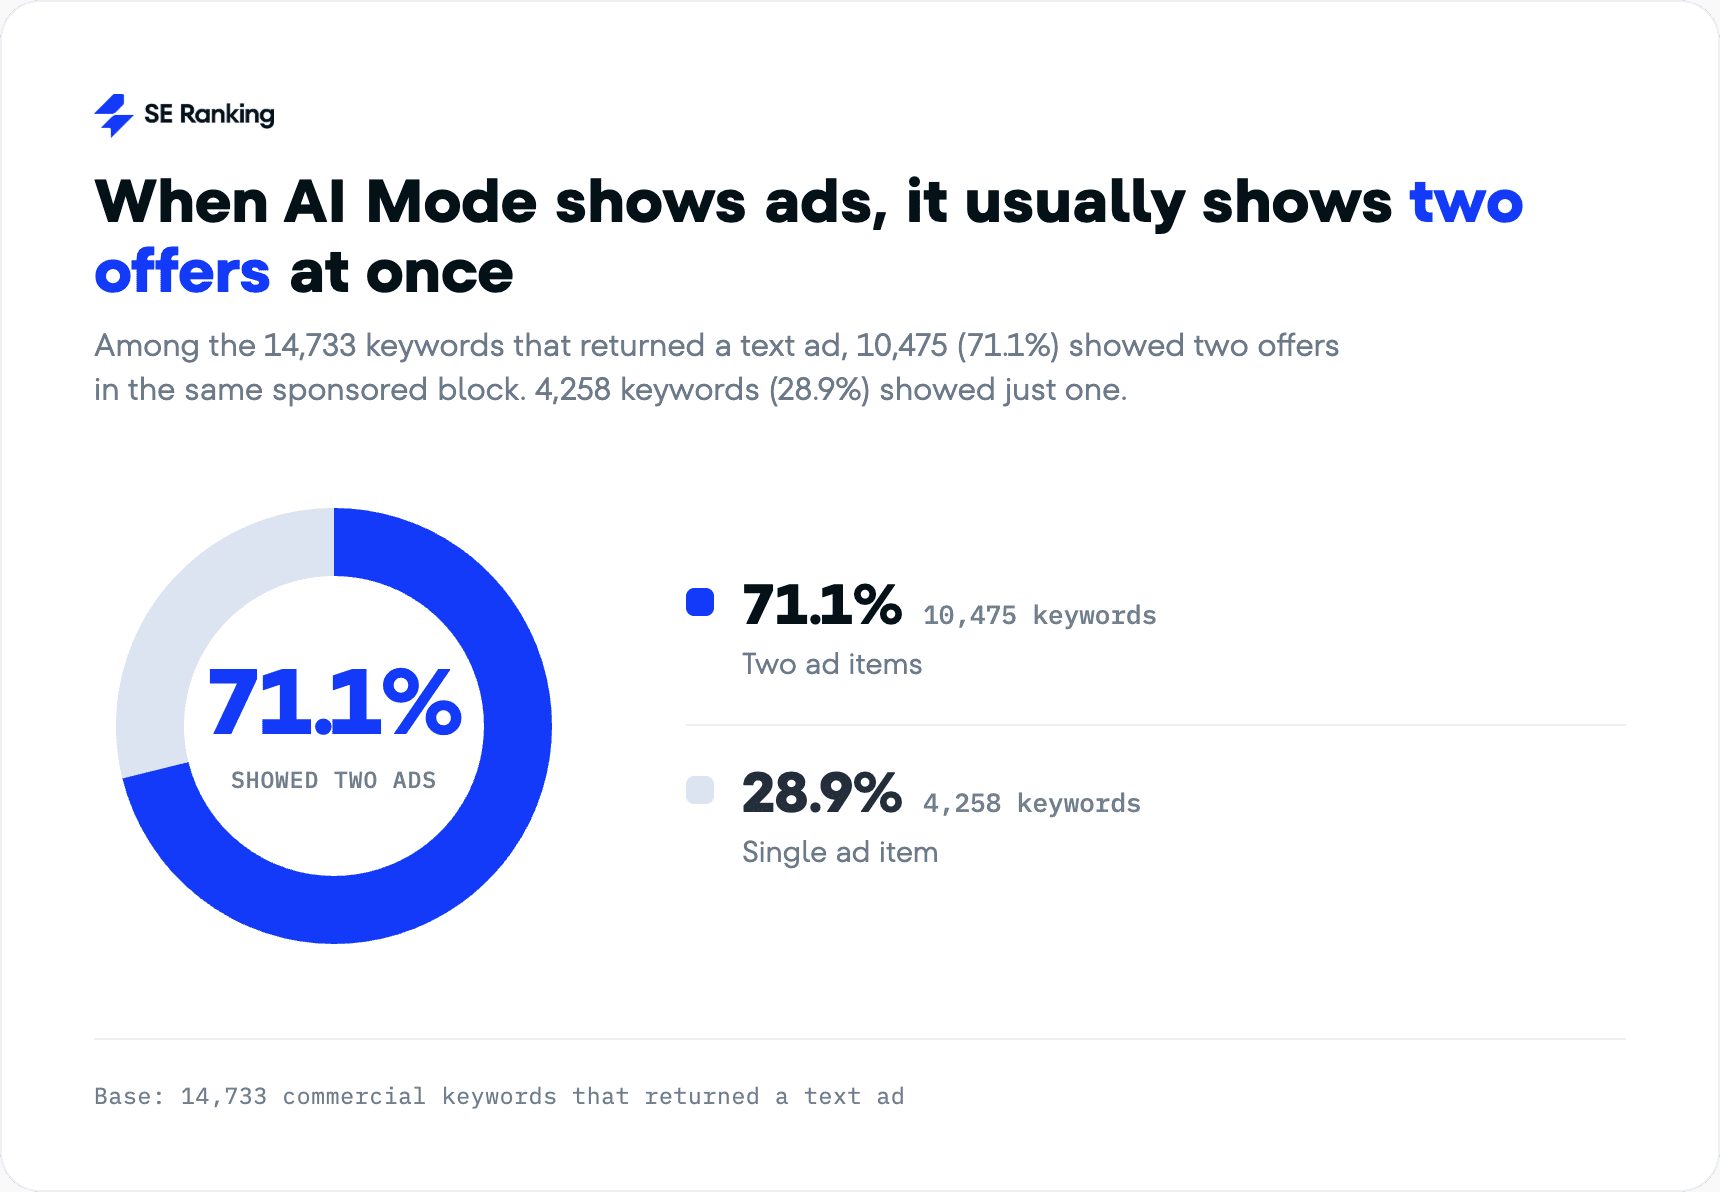
AI Mode’s default sponsored block is built to hold a pair of competing offers. The pattern is easy to spot in a live result.
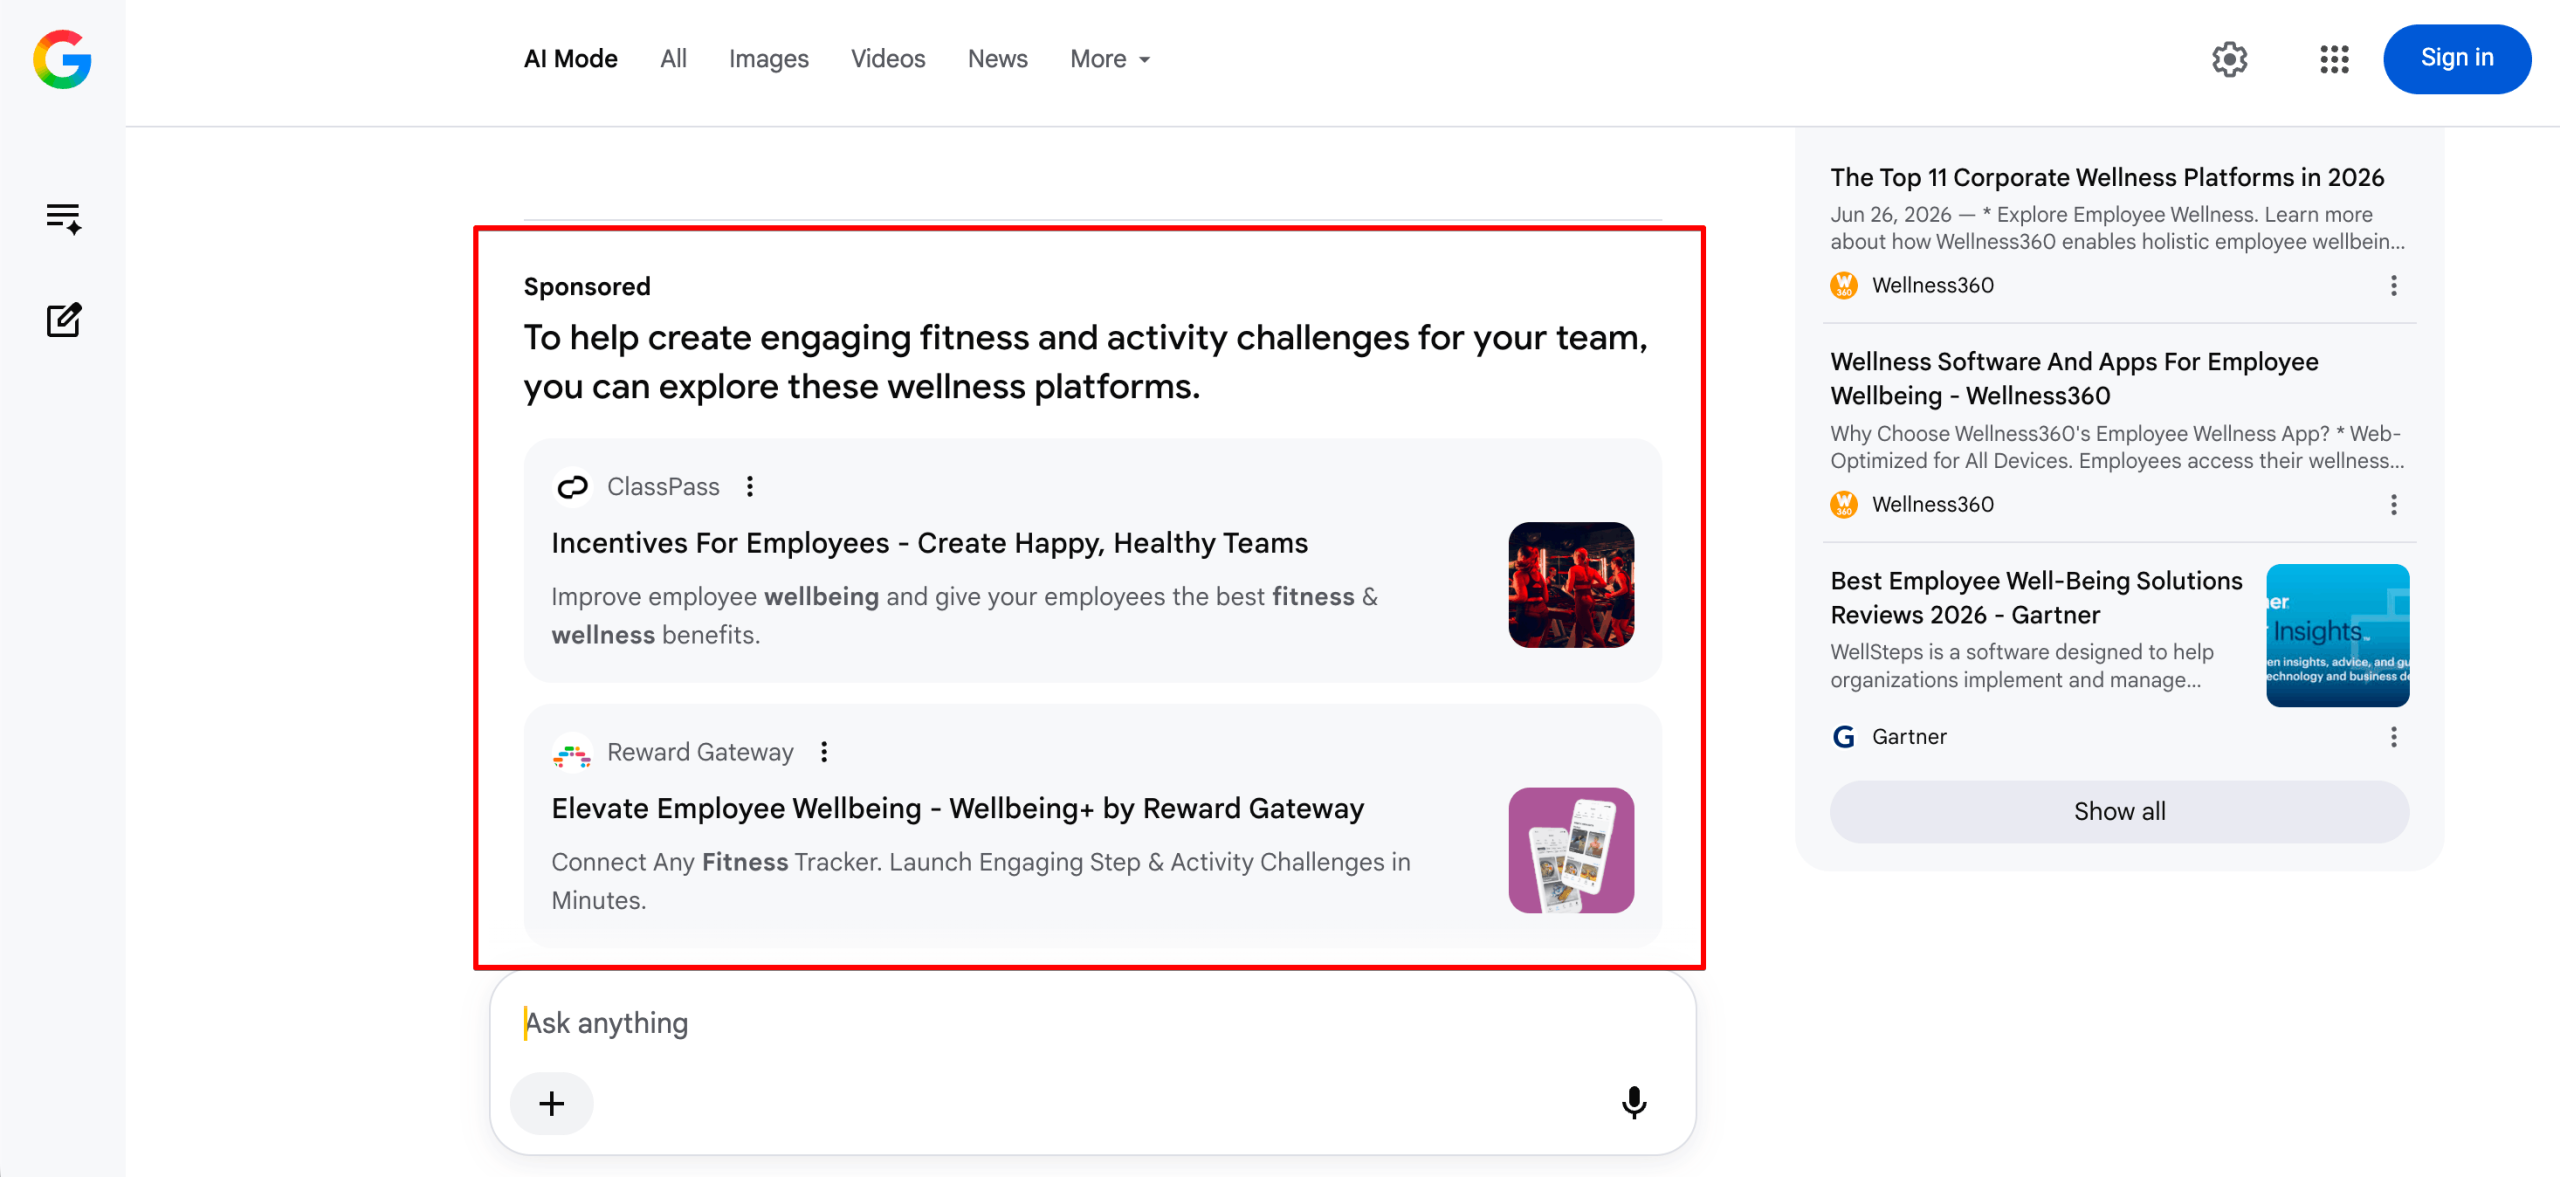
What this means for advertisers: You’re rarely the only advertiser in the answer. So, entry into the block is the first contest; standing out within it is the second.
High-CPC keywords are 2x more likely to trigger an ad
We split keywords into three CPC buckets using SE Ranking’s Keyword Research tool data: under $2, $2 to $10, and $10 and above. Ad presence rises in a straight line with each step:
- Low CPC: 24.33%
- Mid CPC: 32.45%
- High CPC: 53.56%
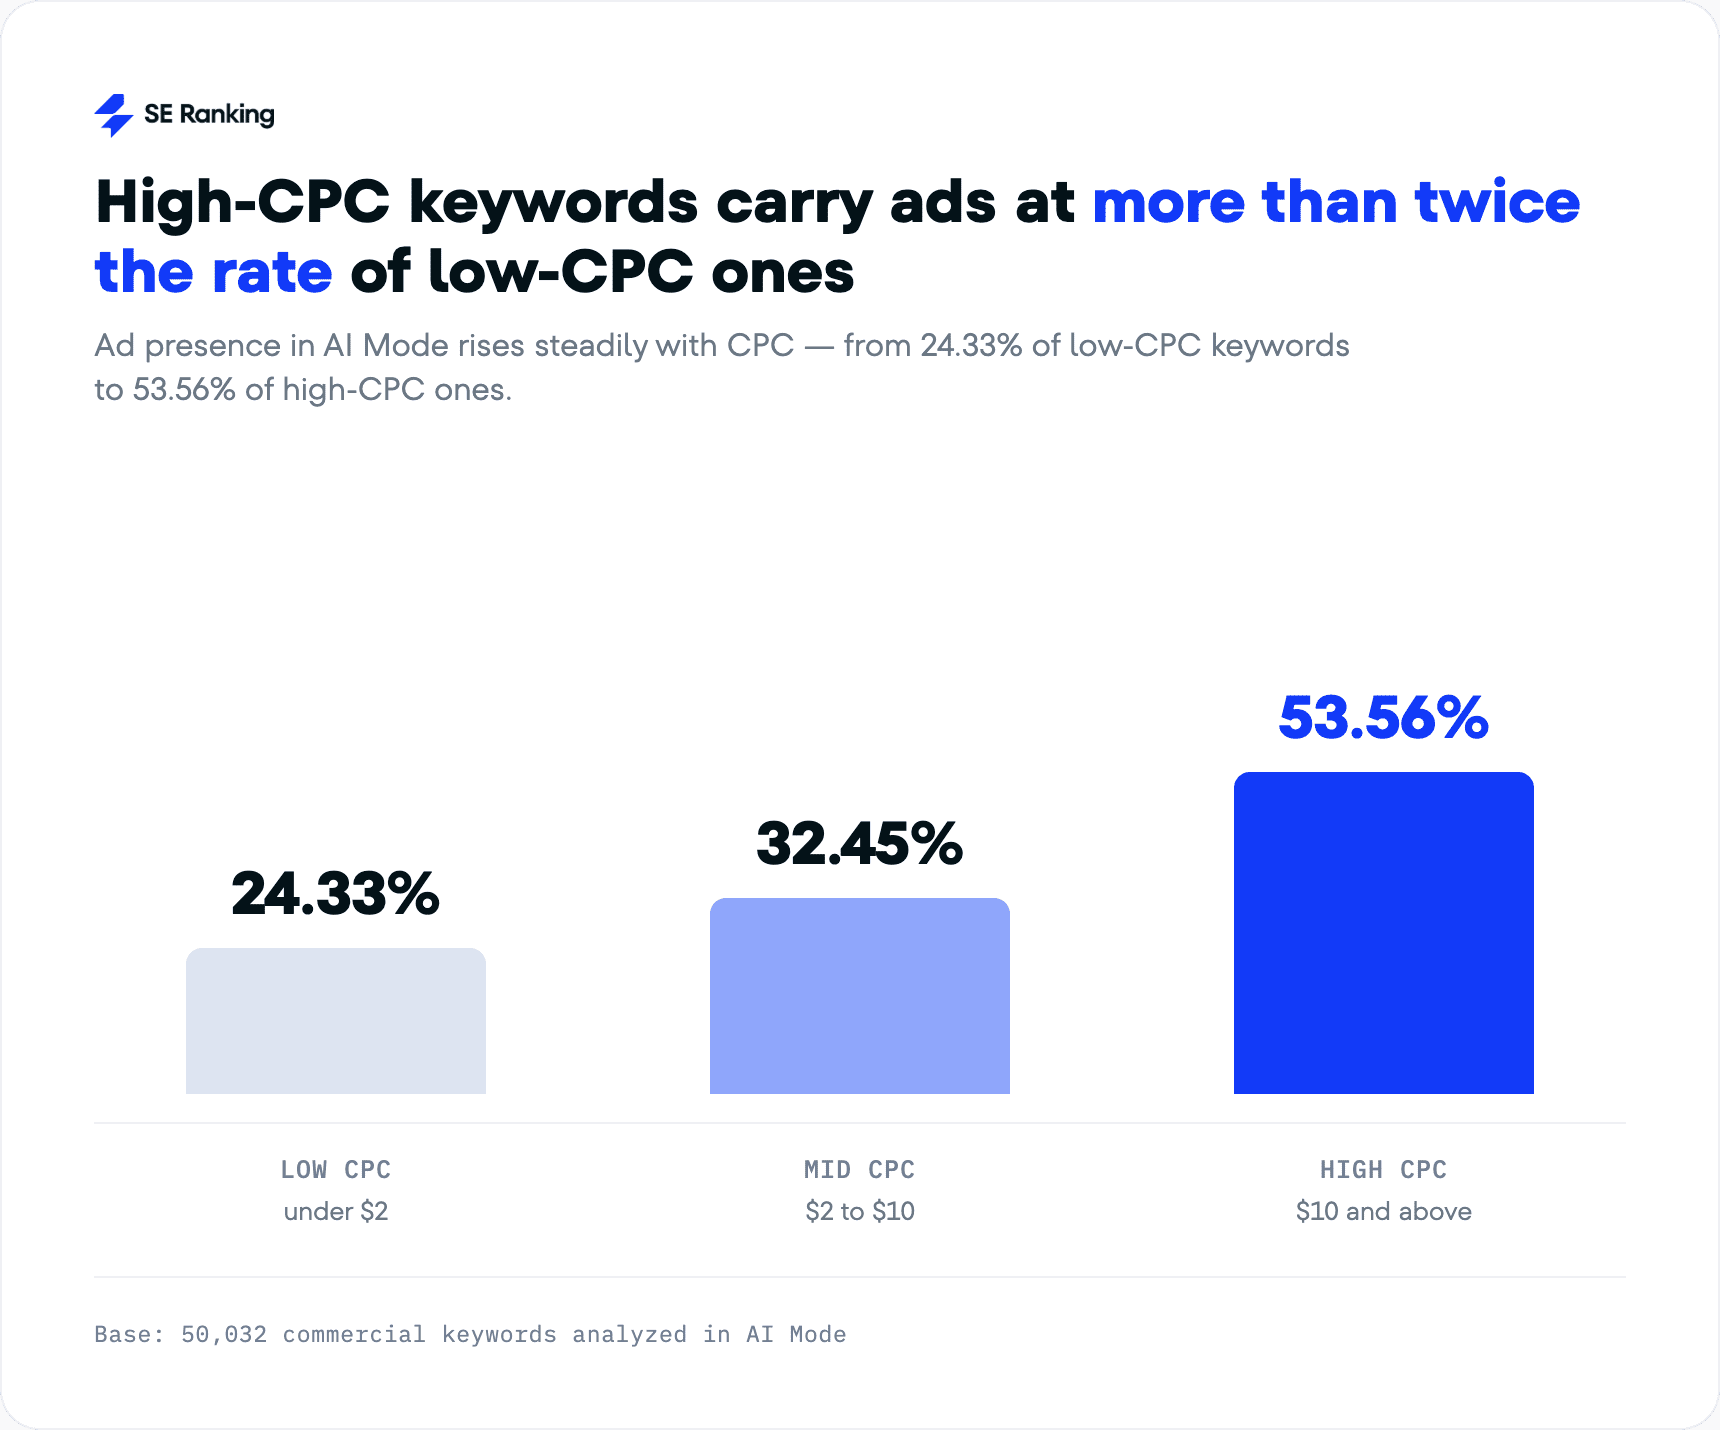
We checked search volume and keyword difficulty against ad frequency too, and neither showed a direct correlation.
What to do with this: Sort your commercial keywords by CPC to see where ads will land. AI Mode isn’t spreading ads evenly across commercial intent, it’s placing them where the keyword already carries commercial weight. A high CPC is the market signaling that advertisers will pay to win that click, and AI Mode is following that signal rather than setting its own. The same pattern holds for transactional queries: ad presence and the CPC gradation look the same there as across the full set.
Ad presence swings from 72% in Pets to under 3% in Healthcare
Niche decides how likely any keyword in a category is to get an ad, and the range is wide. Pets returned an ad on 72.38% of its keywords; Healthcare, on just 2.64%. That’s a gap of about 70 percentage points between the top and bottom niche.
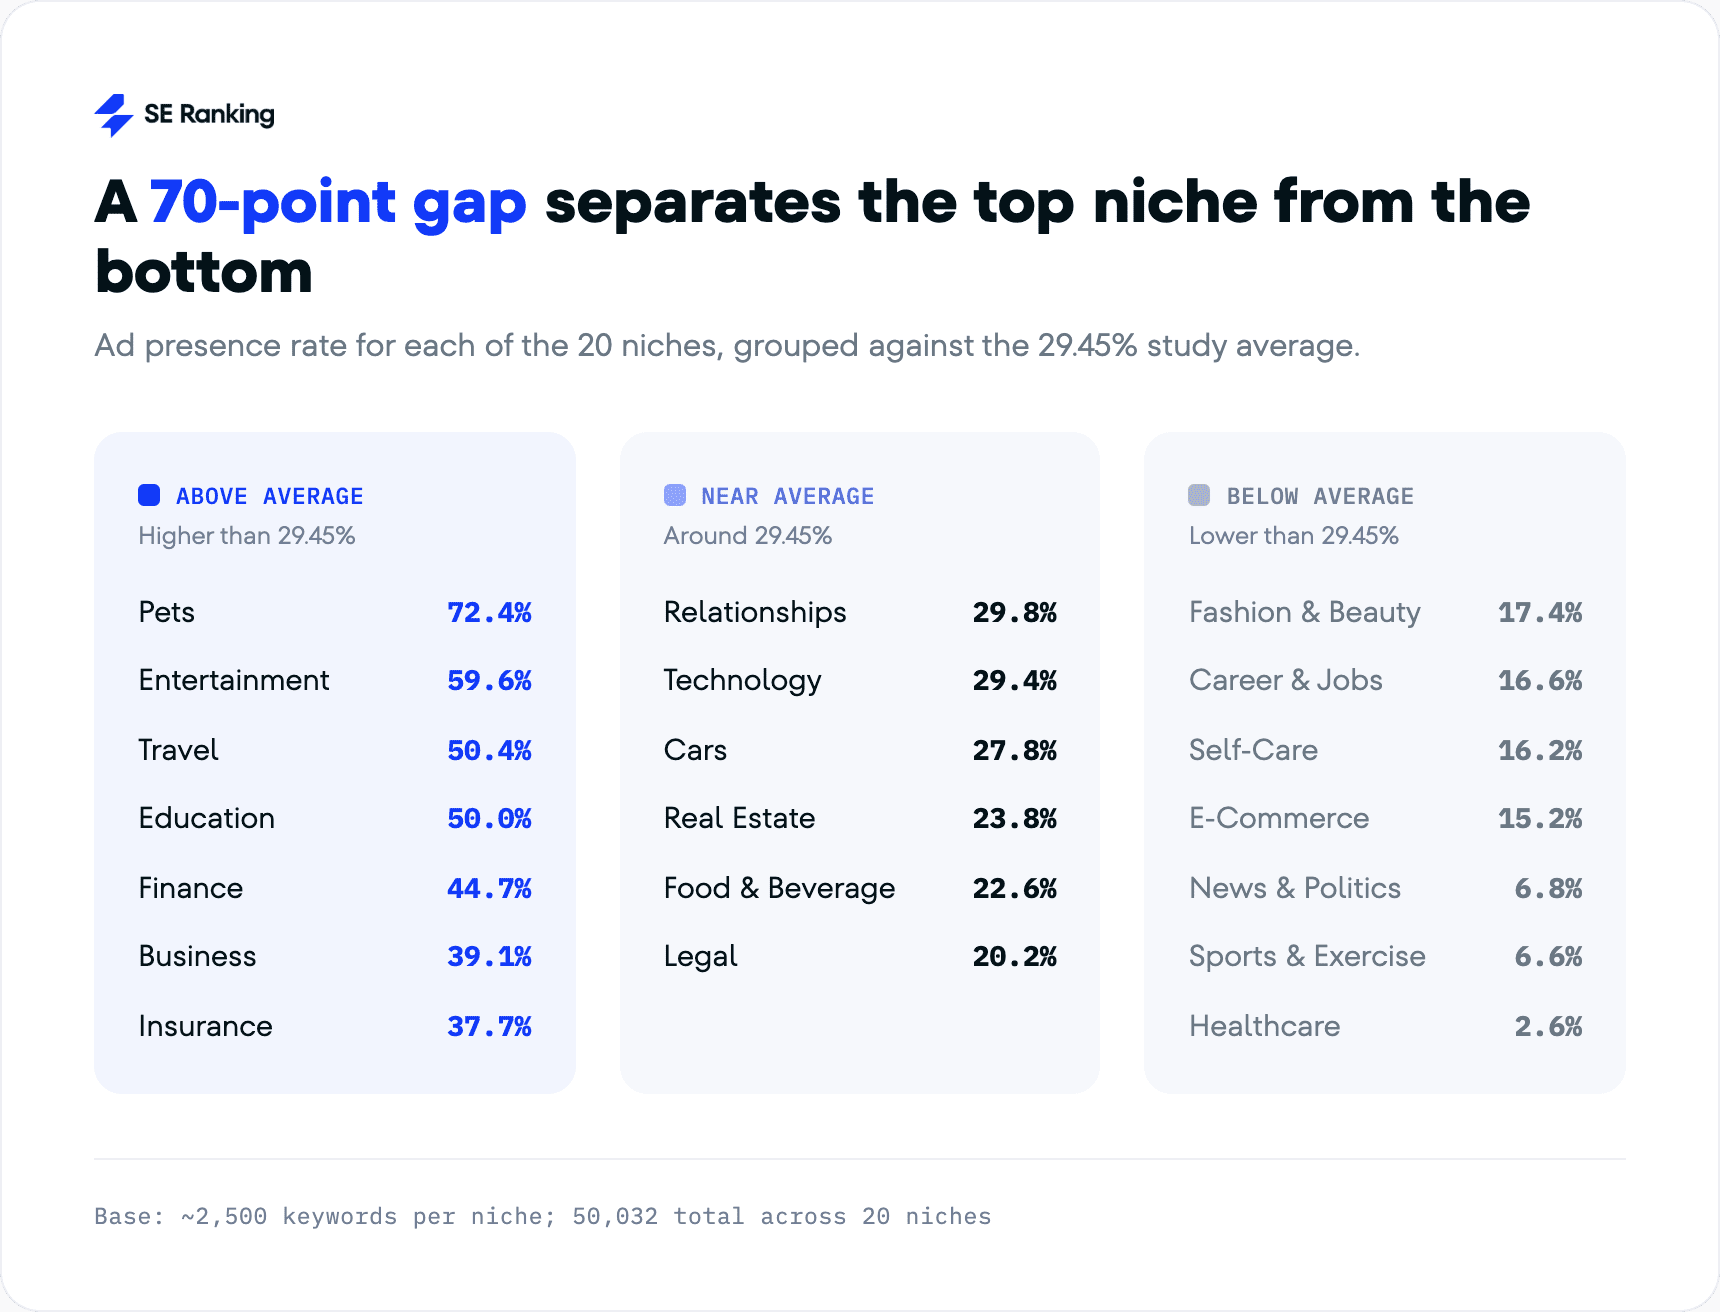
Where the opportunity is: The high-ad niches are lead-generation territory with advertiser demand and a clear paid path to a customer, while the low-ad niches cluster around informational and YMYL intent where commercial demand is thinner or where advertisers and Google both act more cautiously. So, scope AI Mode ad opportunity for a client at the niche level. In a low-ad vertical, lean on per-keyword CPC checks, since even strong commercial terms may rarely trigger an ad there.
A few advertisers win most ad slots, some averaging 50+ appearances each
Across keywords with text ads, 25,243 total ad appearances came from 2,930 unique advertisers. Spread evenly, that’s about 8.6 appearances each. They’re not spread evenly.
Unique advertisers
403
Total ad appearances
1253
Average ad appearances per advertiser
3.11
Unique advertisers
320
Total ad appearances
1208
Average ad appearances per advertiser
3.78
Unique advertisers
309
Total ad appearances
2341
Average ad appearances per advertiser
7.58
Unique advertisers
253
Total ad appearances
795
Average ad appearances per advertiser
3.14
Unique advertisers
243
Total ad appearances
2217
Average ad appearances per advertiser
9.12
Unique advertisers
231
Total ad appearances
1952
Average ad appearances per advertiser
8.45
Unique advertisers
223
Total ad appearances
1767
Average ad appearances per advertiser
7.92
Unique advertisers
175
Total ad appearances
606
Average ad appearances per advertiser
3.46
Unique advertisers
164
Total ad appearances
650
Average ad appearances per advertiser
3.96
Unique advertisers
145
Total ad appearances
534
Average ad appearances per advertiser
3.68
Unique advertisers
136
Total ad appearances
856
Average ad appearances per advertiser
6.29
Unique advertisers
122
Total ad appearances
1141
Average ad appearances per advertiser
9.35
Unique advertisers
105
Total ad appearances
1607
Average ad appearances per advertiser
15.3
Unique advertisers
86
Total ad appearances
621
Average ad appearances per advertiser
7.22
Unique advertisers
81
Total ad appearances
211
Average ad appearances per advertiser
2.6
Unique advertisers
76
Total ad appearances
239
Average ad appearances per advertiser
3.14
Unique advertisers
68
Total ad appearances
3514
Average ad appearances per advertiser
51.68
Unique advertisers
49
Total ad appearances
2622
Average ad appearances per advertiser
53.51
Unique advertisers
43
Total ad appearances
1018
Average ad appearances per advertiser
23.67
Unique advertisers
36
Total ad appearances
91
Average ad appearances per advertiser
2.53
403
1253
3.11
320
1208
3.78
309
2341
7.58
253
795
3.14
243
2217
9.12
231
1952
8.45
223
1767
7.92
175
606
3.46
164
650
3.96
145
534
3.68
136
856
6.29
122
1141
9.35
105
1607
15.3
86
621
7.22
81
211
2.6
76
239
3.14
68
3514
51.68
49
2622
53.51
43
1018
23.67
36
91
2.53
At one end:
- Entertainment and Hobbies: 49 advertisers split 2,622 appearances (53.51 each)
- Pets: 68 advertisers split 3,514 (51.68 each)
At the other:
- News and Politics: 211 appearances spread across 81 advertisers (2.6 each)
- Healthcare: 91 appearances across 36 advertisers (2.53 each)
What this tells you: Single advertisers can own a niche outright, and two different ad markets are running inside AI Mode. In some niches, a small club of advertisers wins the same slots repeatedly; in others, a wide field each surfaces once or twice. Which one you’re in changes how you compete: in a concentrated niche you’re up against entrenched repeat winners, in a fragmented one the slot is far more open.
A note on this section. These advertiser-level numbers are more sensitive to keyword choice than anything else in the study. We built the sample to be as diverse as possible so it would surface an overall trend, but a different set of keywords could shift which brands lead a niche and by how much. Read these figures as the shape of the market, not as fixed rankings.
88% of brands aren’t cited for the keyword they advertise on
For every keyword with a text ad, we checked whether the advertised page (URL level) or its site (domain level) appeared in the source list AI Mode generated for that same query.
They almost never did.
Only 11.53% of advertiser domains showed up among the cited sources, and just 1.95% at the exact URL.
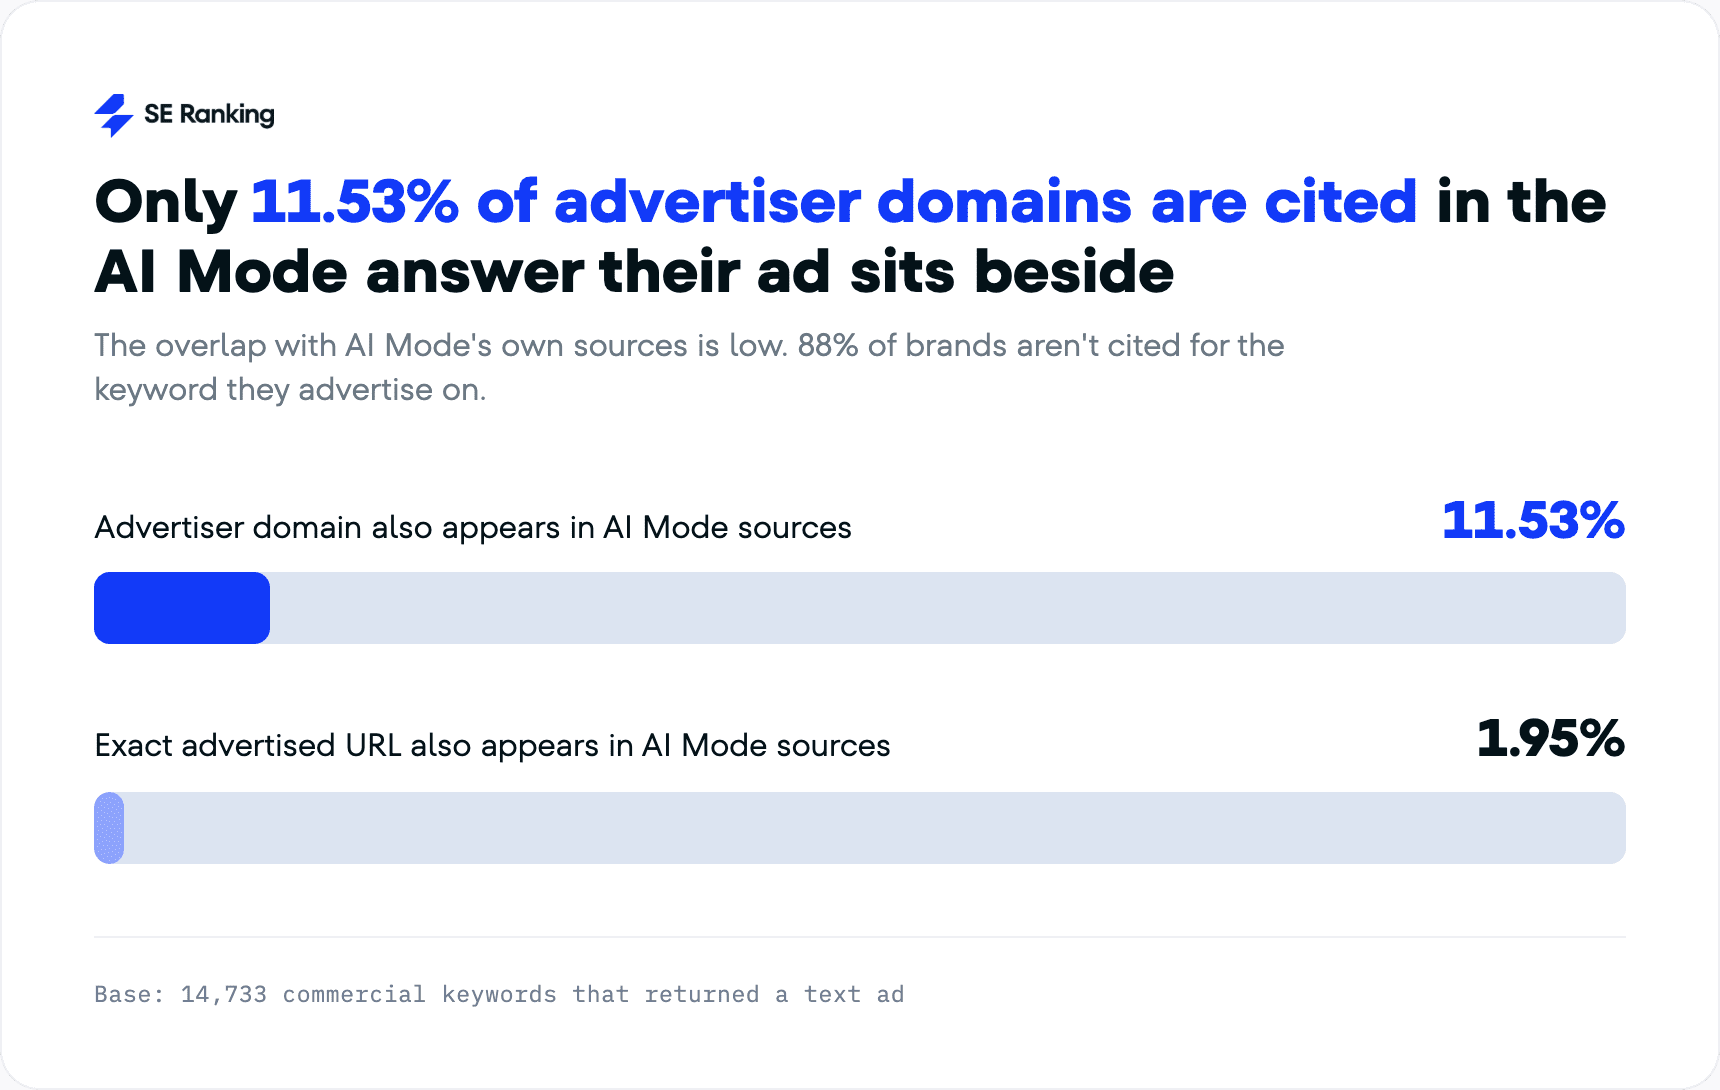
Why paying doesn’t help: Paying for the slot buys the slot, nothing more. We compared advertisers against non-advertising domains of the same strength for the same query, matched on Domain Trust, backlinks, referring domains, and organic standing. Even then, advertisers were cited no more often. The ad is a paid-media play; being cited is an authority-and-content play, and neither moves the other.
85% of AI Mode advertisers are invisible in organic search
One thing to keep in mind before the numbers. Advertisers often build dedicated landing pages for their campaigns, and those pages are usually never meant to rank organically. That alone pushes URL-level overlap down, which is why we also checked the domain level, to catch cases where a different page on the same site ranks.
Only 2.32% of advertised URLs also ranked organically for the same keyword. At the domain level it rose to 15.35%. So for about 85% of ad keywords, the advertiser’s site didn’t appear in organic results at all, on any page. The figure held identical against the top 10, top 20, and top 100.
What this means for advertisers and SEO teams
AI Mode ads run on their own logic. Here is how to act on that.
- Treat AI Mode ads as a distinct channel
For about 85% of ad keywords the advertiser doesn’t rank organically, and for about 88% they aren’t cited in the answer. When we controlled for brand strength, buying an ad gave no citation advantage.
So run AI Mode ads on their own terms and don’t expect ad spend to lift you into the sources. The ad slot is a paid-media decision; being cited is an authority-and-content decision, and neither one moves the other.

- Use CPC as your first filter
Within a niche, CPC is the clearest predictor of ad presence: it climbed from 24.33% on sub-$2 keywords to 53.56% at $10 and above, while search volume and keyword difficulty showed no correlation.
So when you’re gauging which of your commercial keywords are likely to show ads, yours or a competitor’s, sort by CPC. A high-CPC term is the one to watch even if its volume is modest.
- Expect to share the block
71.1% of ad keywords showed two competing offers in the same block, so you’re almost always displayed beside a rival answering the same prompt. This means you have two contests to win: entering the block and differentiating within it.
- Track who’s advertising against you in AI Mode
Once you know a niche shows ads, the next question is whether you and your competitors are winning those slots for your commercial queries. You can check that directly.
SE Ranking’s Competitive Research includes an AI search section that lets you analyze a domain (your own site, a client, or a competitor) alongside a set of competitors (five suggested, or your own). For the prompts you’re interested in, you can see which of those domains appear in ads. This works for AI Mode and ChatGPT.
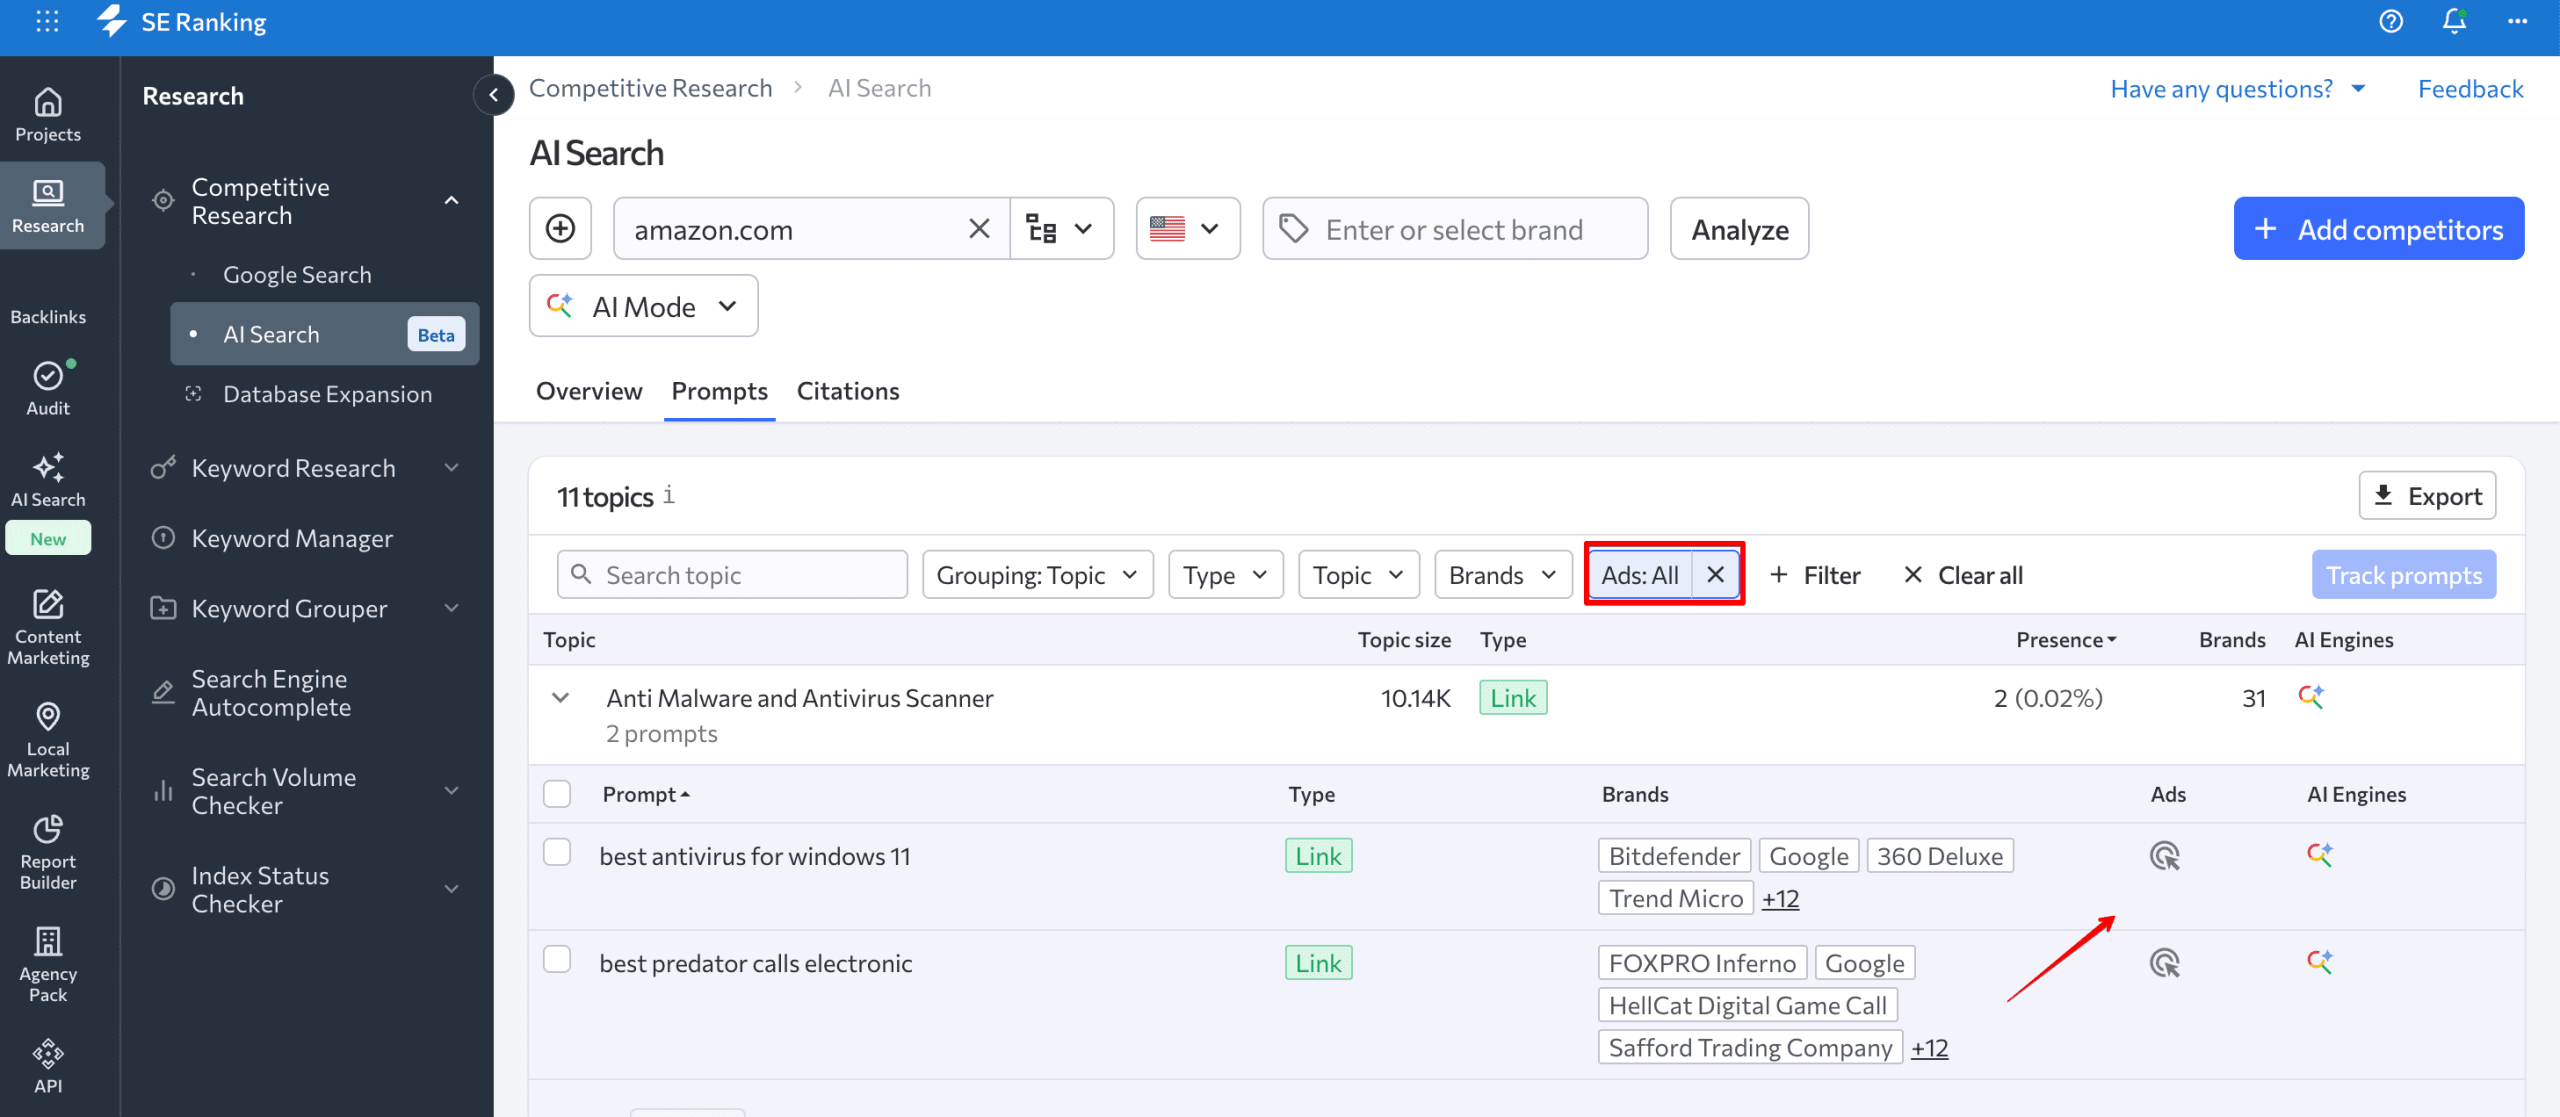
You can also filter by all ads, those linking to your domain, or the ones that don’t link to the analyzed website. So you can see where you’re winning or losing against your competitor set and spot openings they’re not covering yet.
Because this sits inside Competitive Research, you’re not looking at AI ads in isolation. The same tool analyzes a domain’s overall performance in AI answers as well as organic results and Google paid ads in search. This gives you a fuller read on how a competitor shows up across surfaces.
Research methodology
We analyzed 50,032 commercial keywords across 20 niches (roughly 2,500 each), all selected to trigger a website (text) ad. Of those, 14,733 (29.45%) returned a text ad, and those keywords form the base for every advertiser, overlap, and citation figure in the study.
Data was collected on June 30, 2026, and reflects AI Mode in the US.
Disclaimer: These results describe patterns in this specific dataset and may not hold for every keyword, niche, region, or point in time. AI Mode is changing quickly, and its ad behavior may look different as Google expands its AI Mode ad formats.
Conclusion
AI Mode went from an answer engine to a paid one in under a year, and it now shows a text ad on nearly one in three commercial queries.
That will not stay static. As Google rolls out newer AI-Mode-specific formats, the ad layer may start to interact in ways this snapshot doesn’t capture.