GA4 ecommerce: A step-by-step guide with examples
If you work in ecommerce, valuable data insights are your ticket to sustainable business growth.
Only by understanding product performance in terms of views, cart additions, and sales, can you optimize your online store. With this data, you can, for example, introduce more variations to your top-performing products and remove (or improve) product pages with unsatisfactory performance.
In this guide, we’ll take a good look at the following: why it’s important to use Google Analytics 4 for ecommerce purposes, how to configure event tracking via GTM and gtag.js, and which reports provide the most valuable ecommerce insights.
By the end of this article, you should be able to identify your customers’ purchasing habits and opportunities for enhacing the customer experience while boosting sales.
Essential GA4 Features for Ecommerce Businesses
Ecommerce businesses hold GA4’s advanced features in high esteem, which range from its data tracking capabilities to its reporting interface.
Expect the following when using GA4 for ecommerce:
- New Predictive Insights for Ecommerce
GA4 offers the opportunity to predict purchase, churn, and revenue probability. Using machine learning algorithms, this version of the platform can, for example, predict which products a particular user is more likely to purchase based on their past purchases and site interactions. These insights are extremely useful for allocating your budget wisely and customizing marketing campaigns for maximum profitability.
- Custom Funnels for Ecommerce Journeys
GA4 allows you to build a series of events into a funnel. By understanding how many users drop off between each step in your purchase funnel, you can take targeted measures to improve your website/app. For instance, if a significant number of users abandon their carts during the checkout process, you might have to optimize the checkout flow, which involves simplifying steps, reducing form fields, or offering guest checkout options.
- Merchant Center Integration
With GA4, you can link your Merchant Center account with your Google Analytics property. This allows you to send conversion details straight to the Merchant Center and access added reporting benefits. In particular, you can compare your organic shopping traffic and conversions with other sources, such as paid shopping traffic, organic search traffic, and social traffic. This will give you a better understanding of where your best customers are coming from.
- Revenue App Blended with Website Revenue
Within the Monetization block of your GA4 property, you can find and track in-app purchase data mixed with your website sales. This provides you with information on conversions that are specific to your mobile app.
- More Custom Dimensions and Metrics
In addition to built-in dimensions and ecommerce metrics, GA4 offers a variety of custom options for accessing data that is unique to your business. This data could be related to anything from clients and industry to your product, service, or platform.
For example, this list of metrics includes the number of logins from iPhone users, total discounted amount of purchases, scroll depth of product pages, number of users who read product reviews, number of times a product has been added to “Favorites,” and more.
- Consent Mode Upscales Revenue for Opted-out Users
To stay compliant with legislation, such as GDPR, you cannot collect in-depth data on users who declined consent for you to do so. But GA4 still allows you to gain limited information on users’ IP addresses, device types, and operating systems. With these insights, you can use machine learning to predict how these individuals would have behaved if they had consented to tracking.
Keep in mind that you can only build your ecommerce business by carefully combining the insights of GA4 with data collected from a website technical audit and ecommerce SEO analysis.
Setting Up GA4 Ecommerce Tracking
When set up accurately, GA4 can provide valuable insights not only on purchases but also on ecommerce site searches, user behavior, website traffic sources, conversion paths, audience demographics, overall engagement and bounce rate. Plus, by combining GA4 and SEO insights, you can optimize your SEO strategy for specific product categories or user segments. Doing this will have a direct impact on your SEO ROI.
There are two main ways to set up GA4 for ecommerce purposes: via gtag.js and Google Tag Manager. Let’s review each of them in detail.
Gtag Method
According to Google, gtag.js is a JavaScript framework used to add Google tags directly to web pages. It’s essentially a simplified version of Google Tag Manager that allows you to send event data to Google services.
If you’ve used this tracking method to send ecommerce data to UA and now want to link it with GA4, follow these steps:
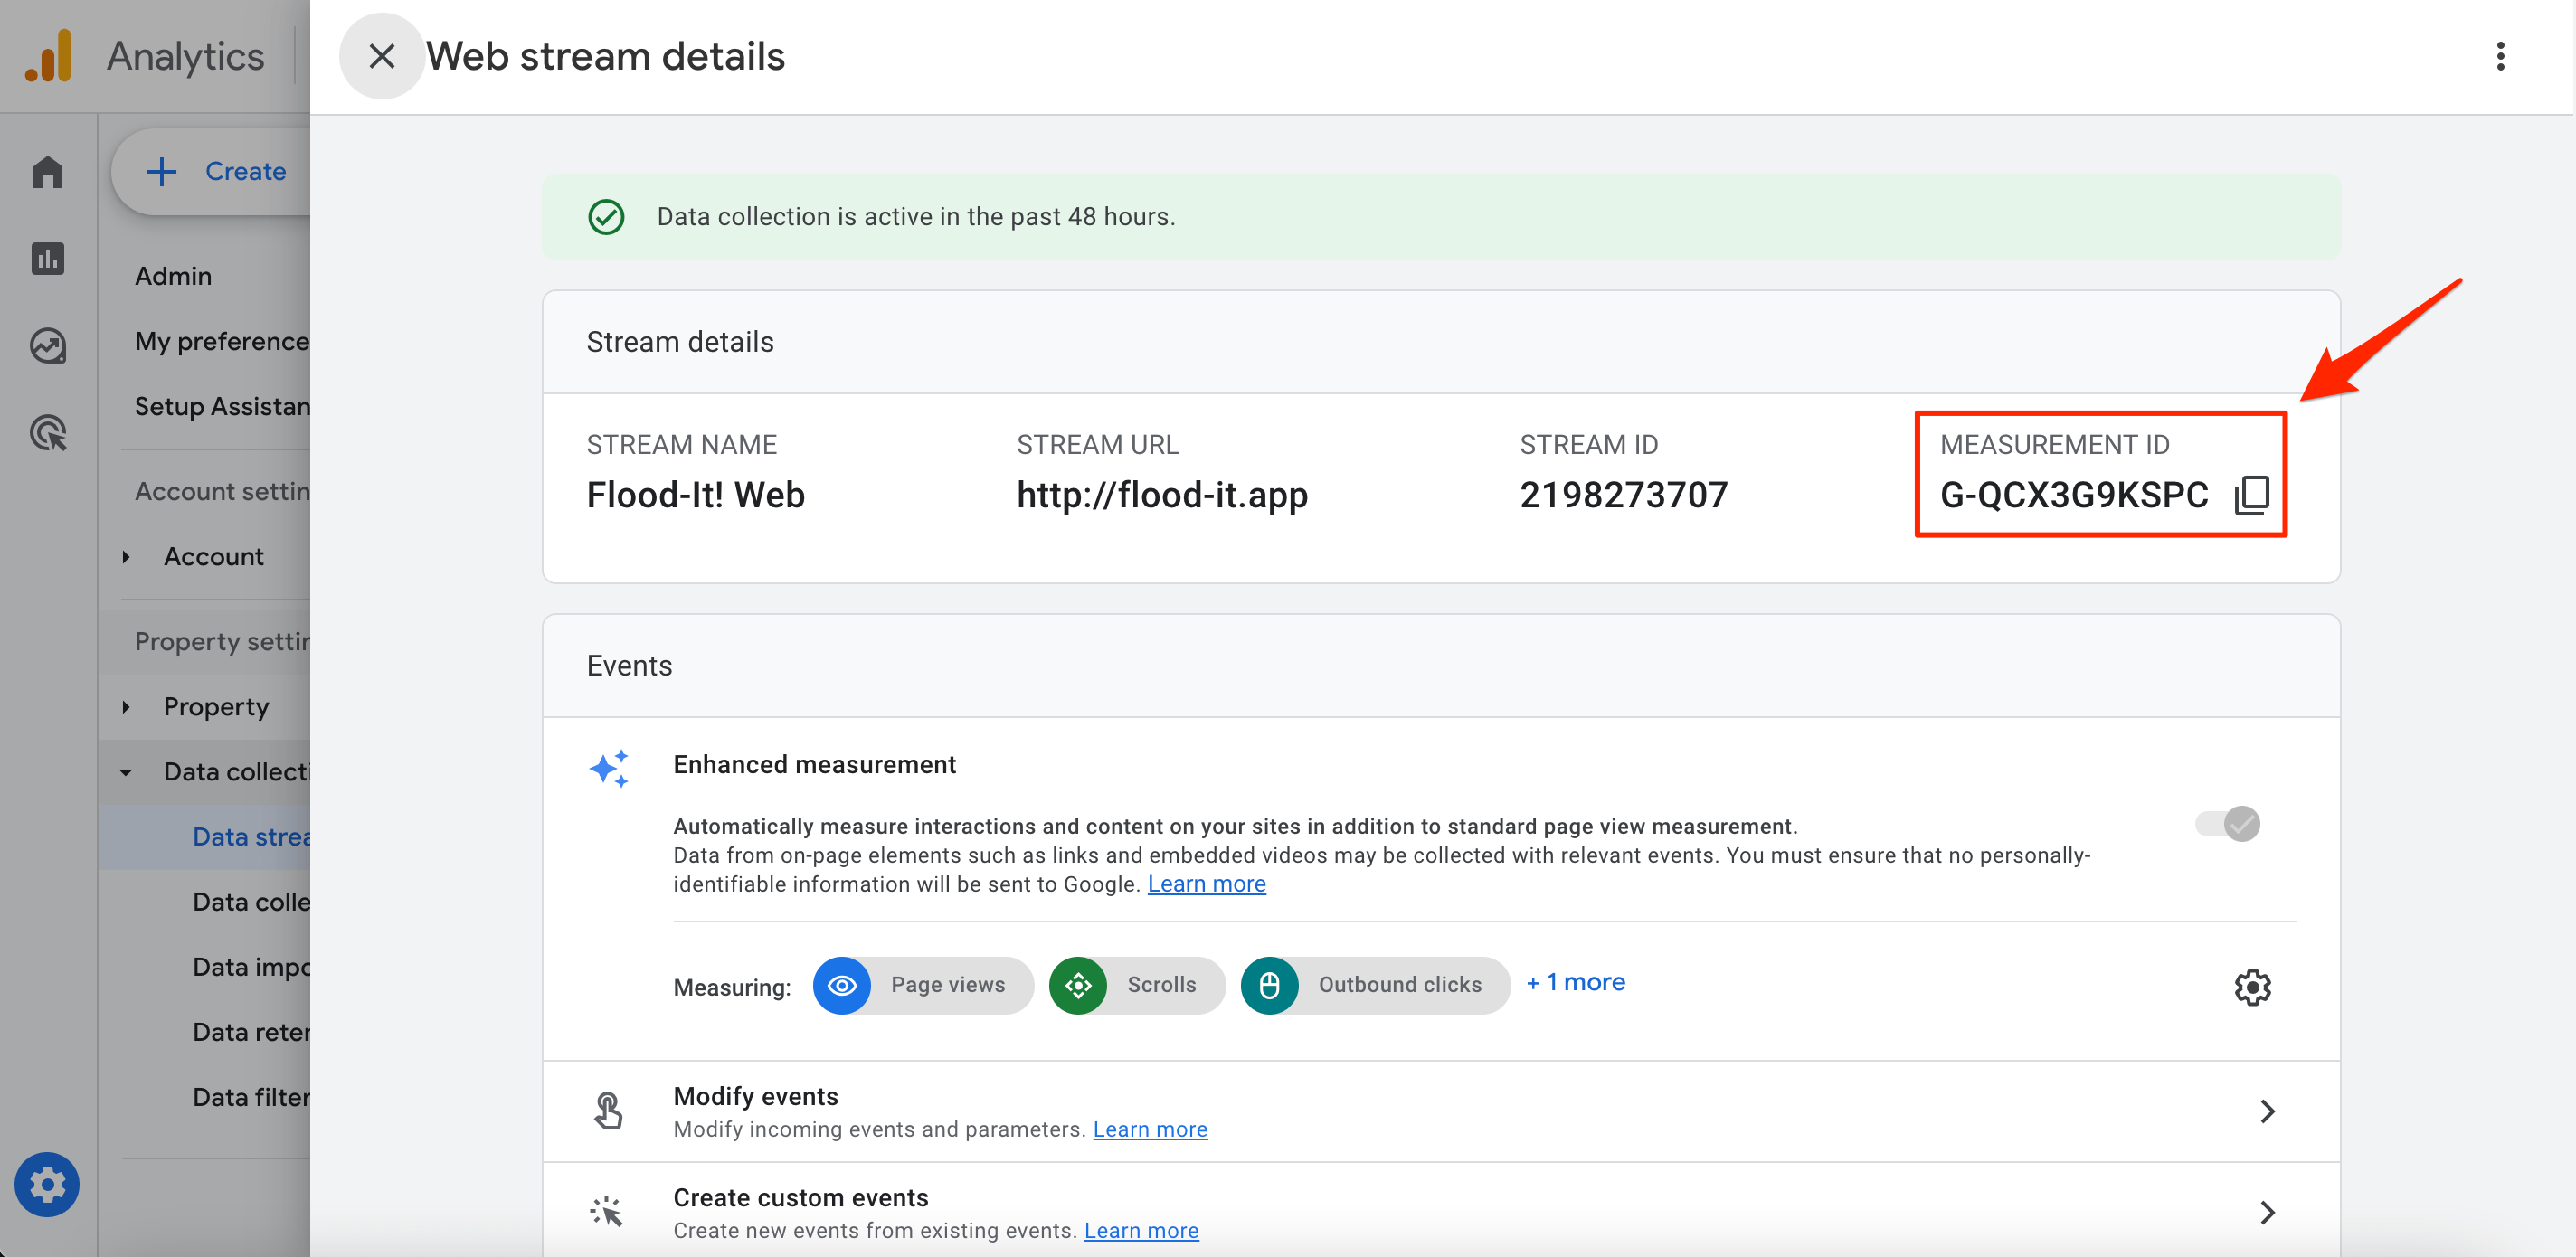
1. Go to GA4 > Data Streams > Web Stream Details, and copy your measurement ID.
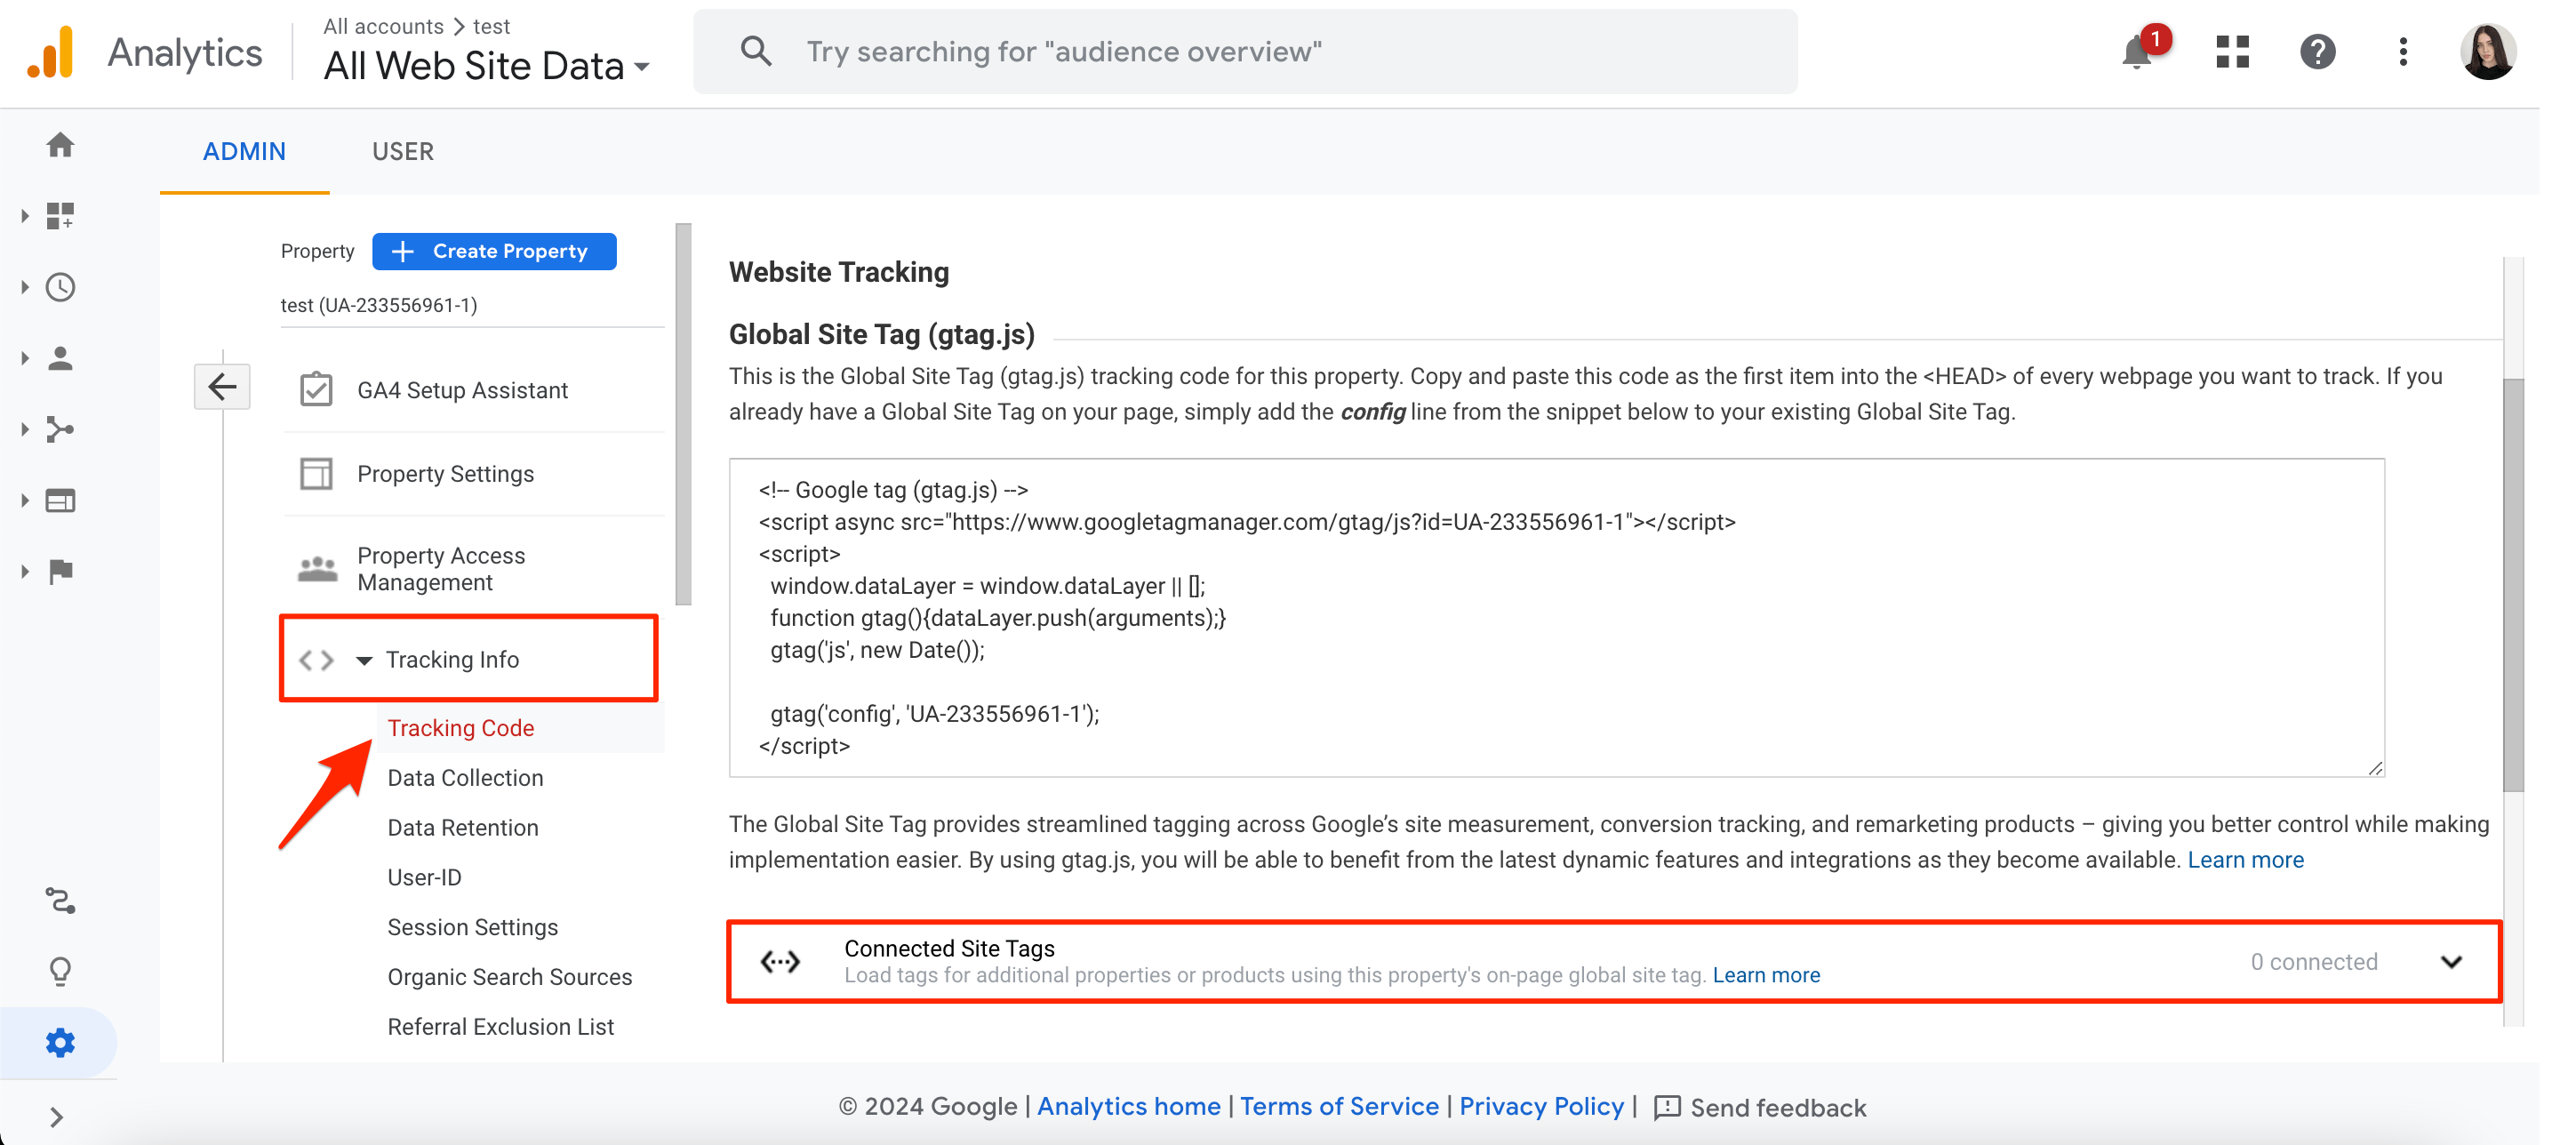
2. Go to your UA account > Admin > Tracking Info > Tracking code > Connected Site Tags and add your copied measurement ID into Enter ID of tag to connect and click Connect.
Still, the most common method of GA4 ecommerce setup is through Google Tag Manager. Let’s look at how to do it next.
Implementation with Google Tag Manager
Once you create and configure your new GA4 property, you’ll need to add Google Tag Manager.
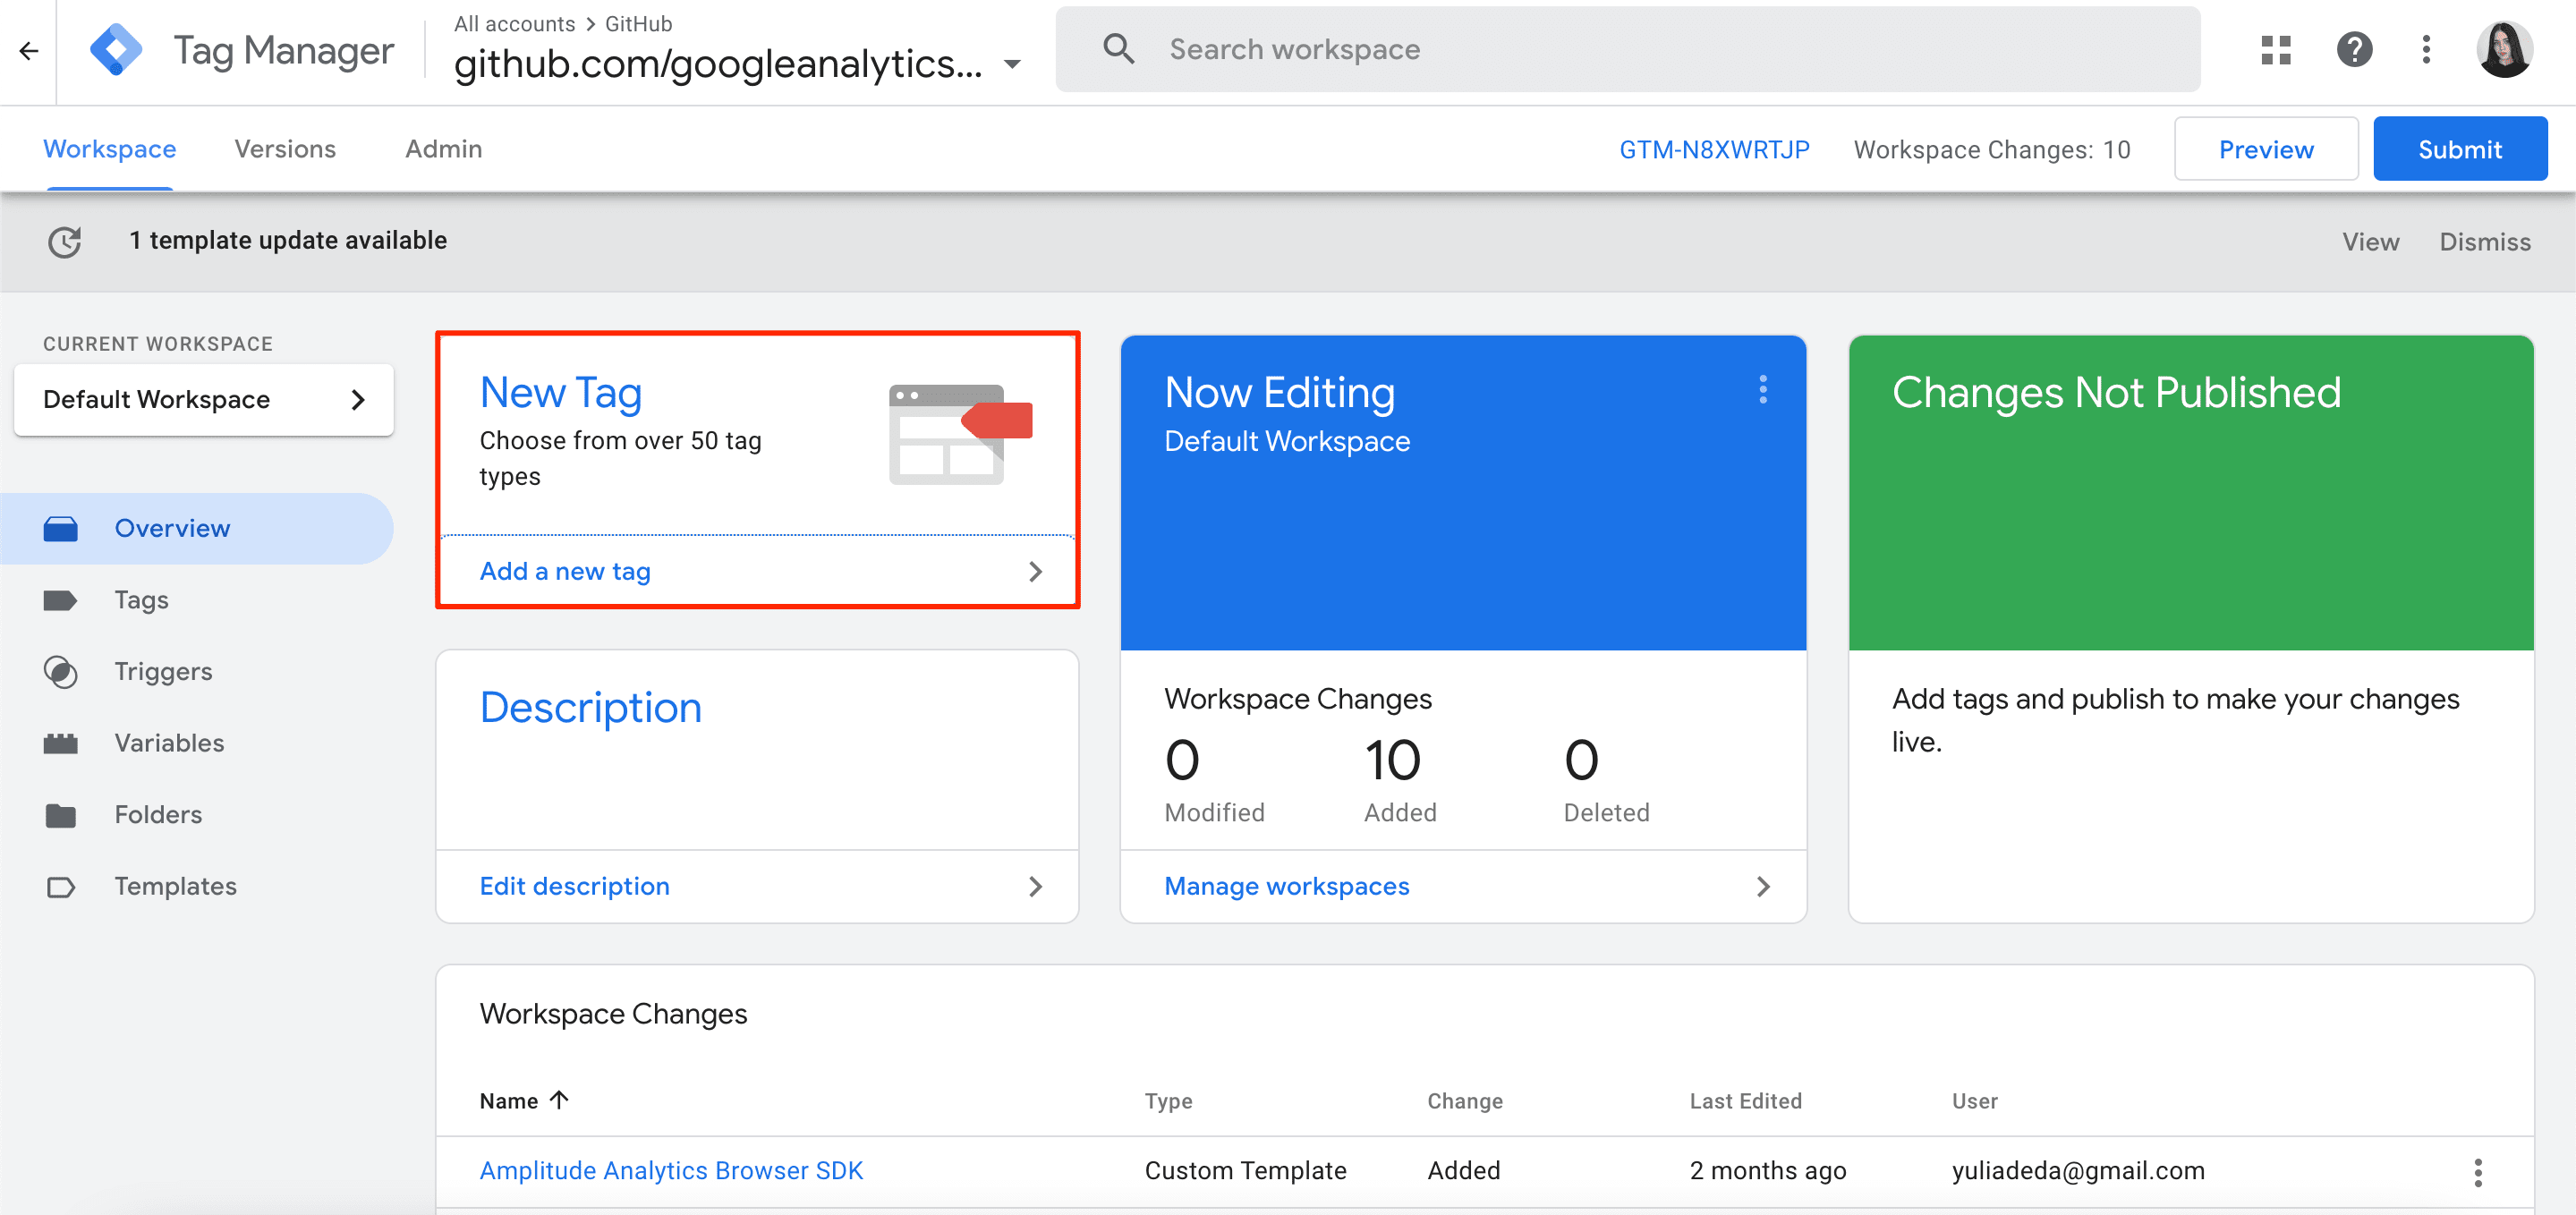
Now, click on Tag Configuration>Google Tag.
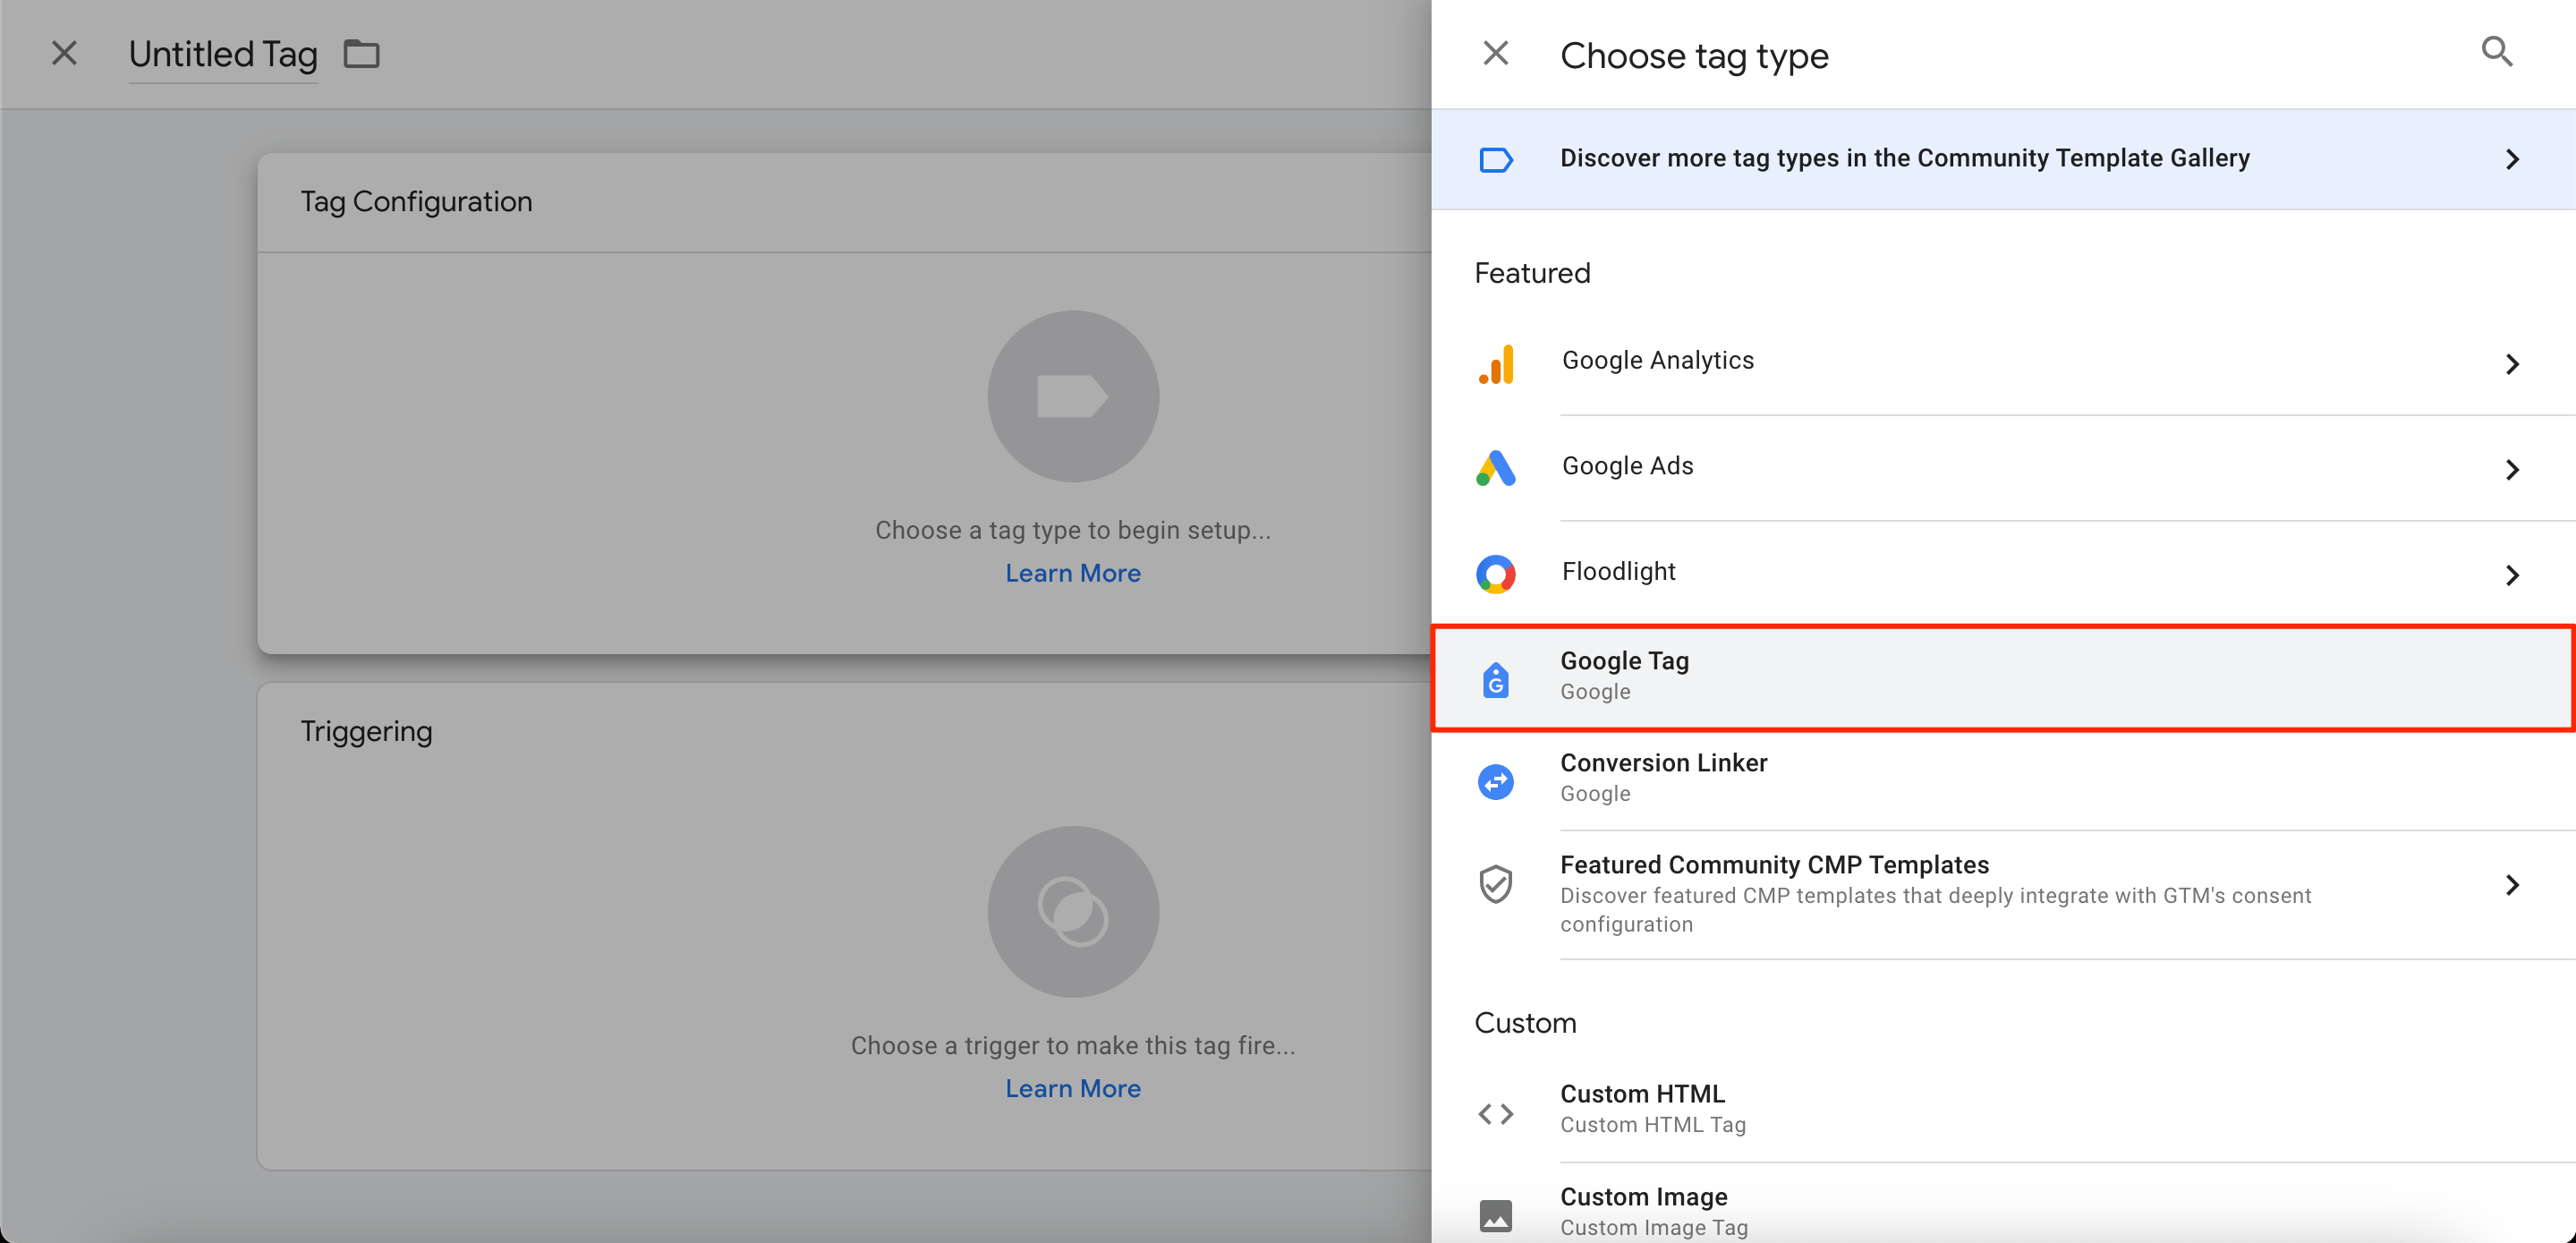
Make sure to insert the tag ID for your GA4 property and choose the option to trigger the tag on All Pages (or the group of pages you want to track).
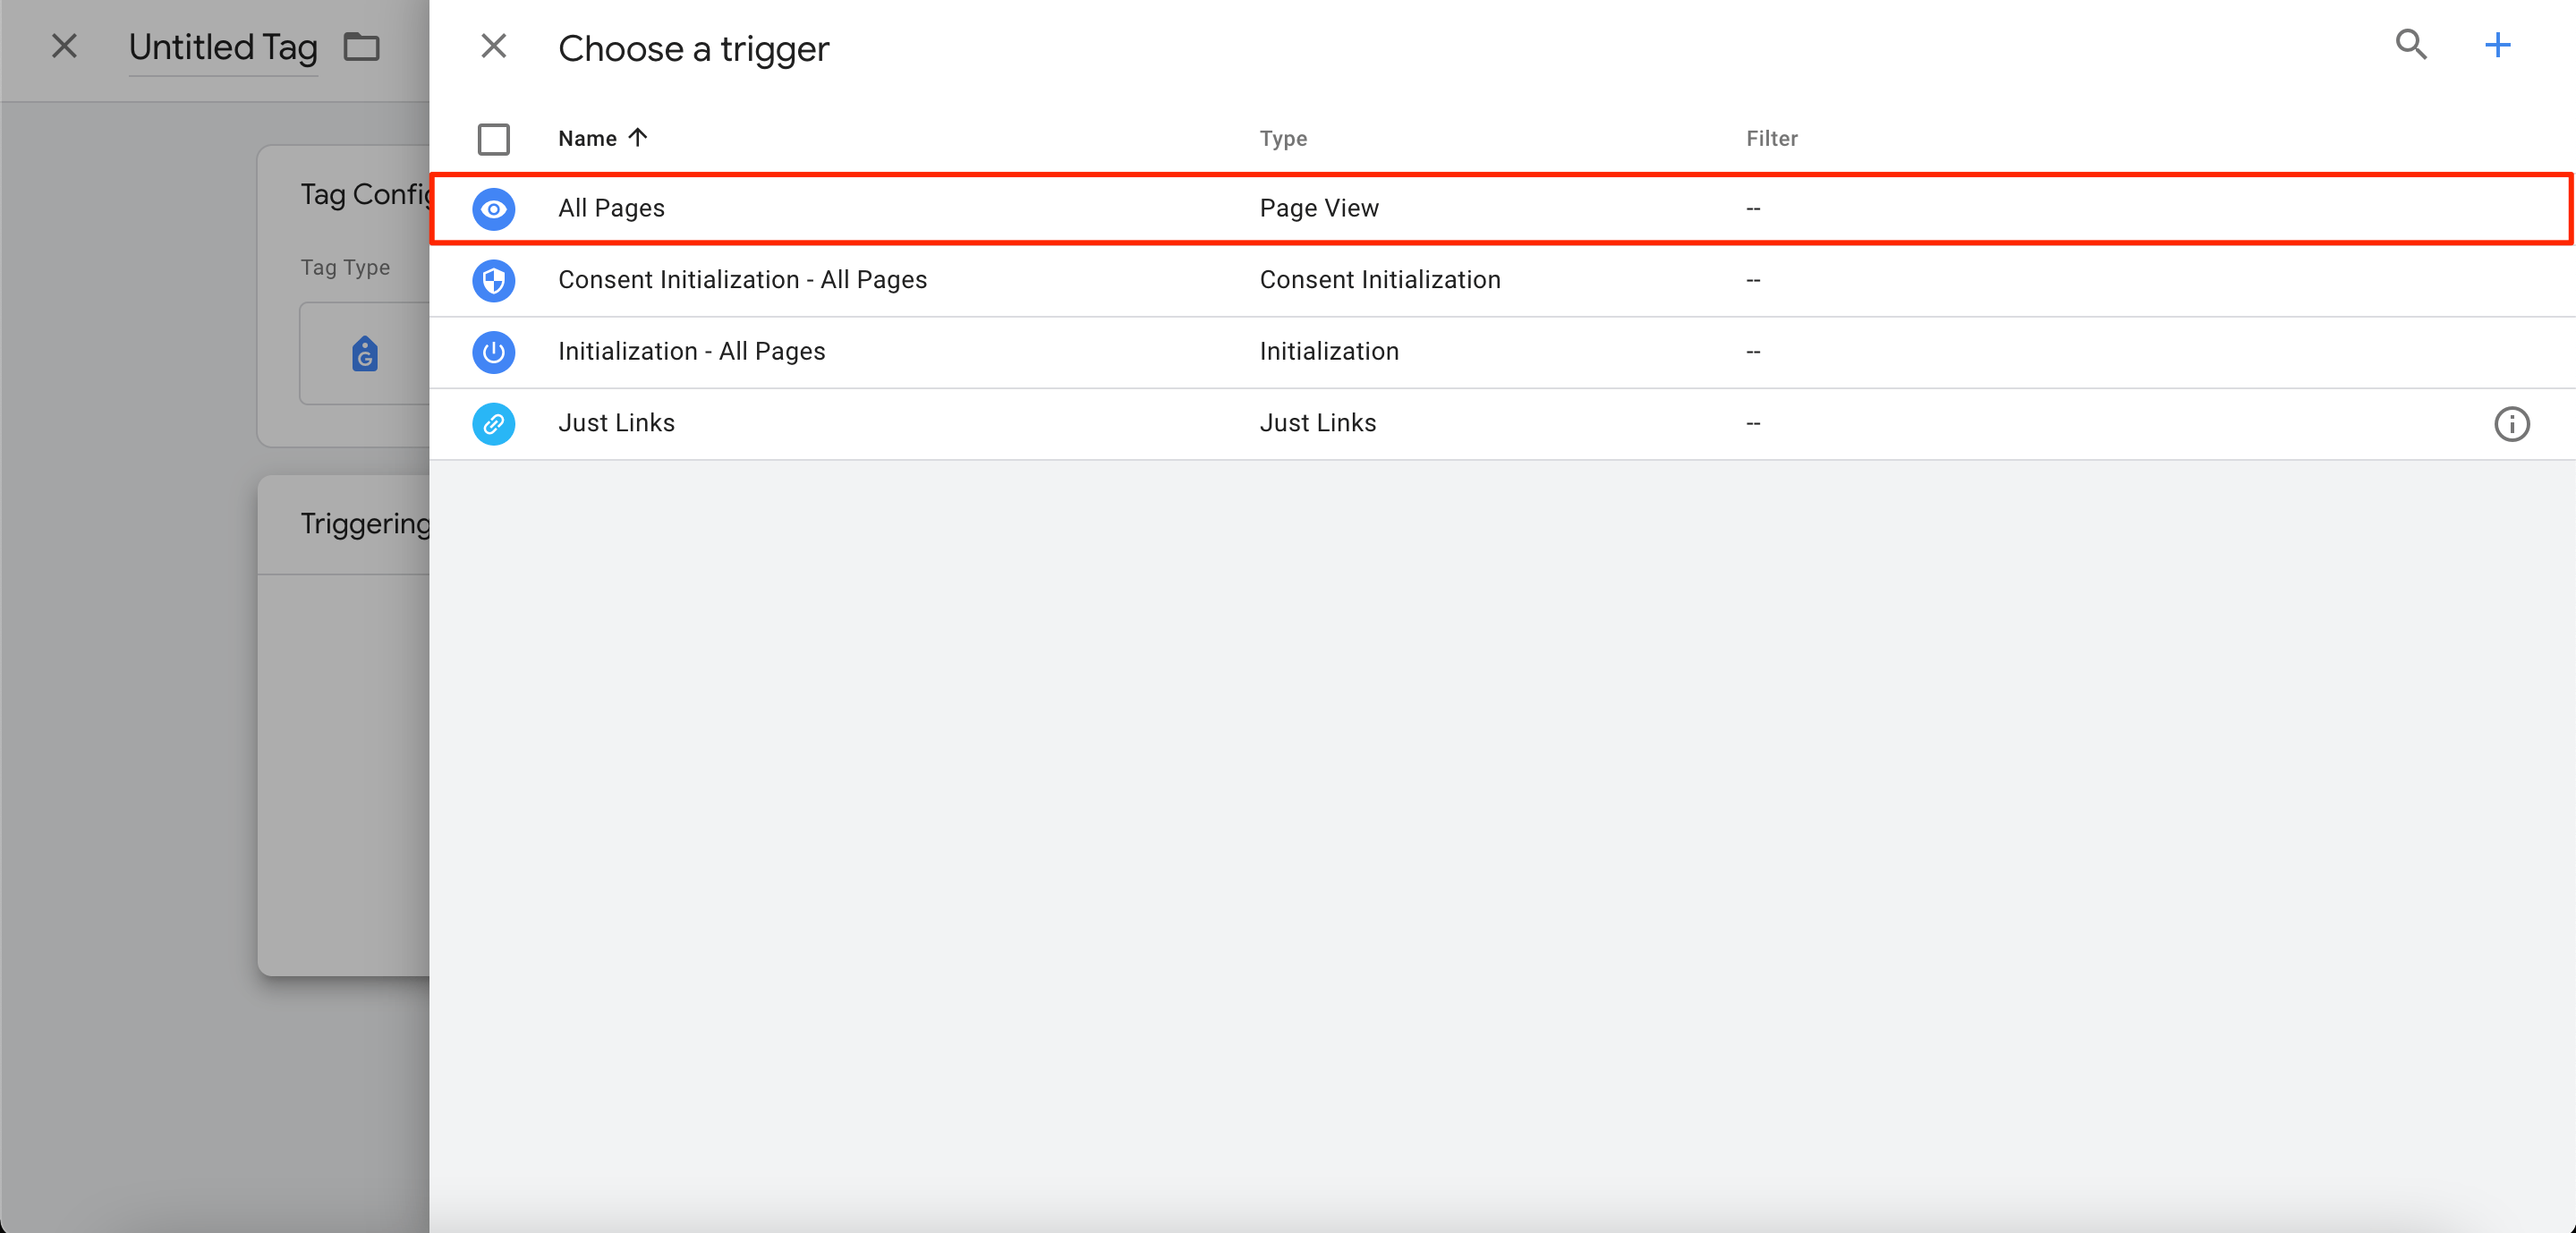
Finally, save and publish your tag configuration.
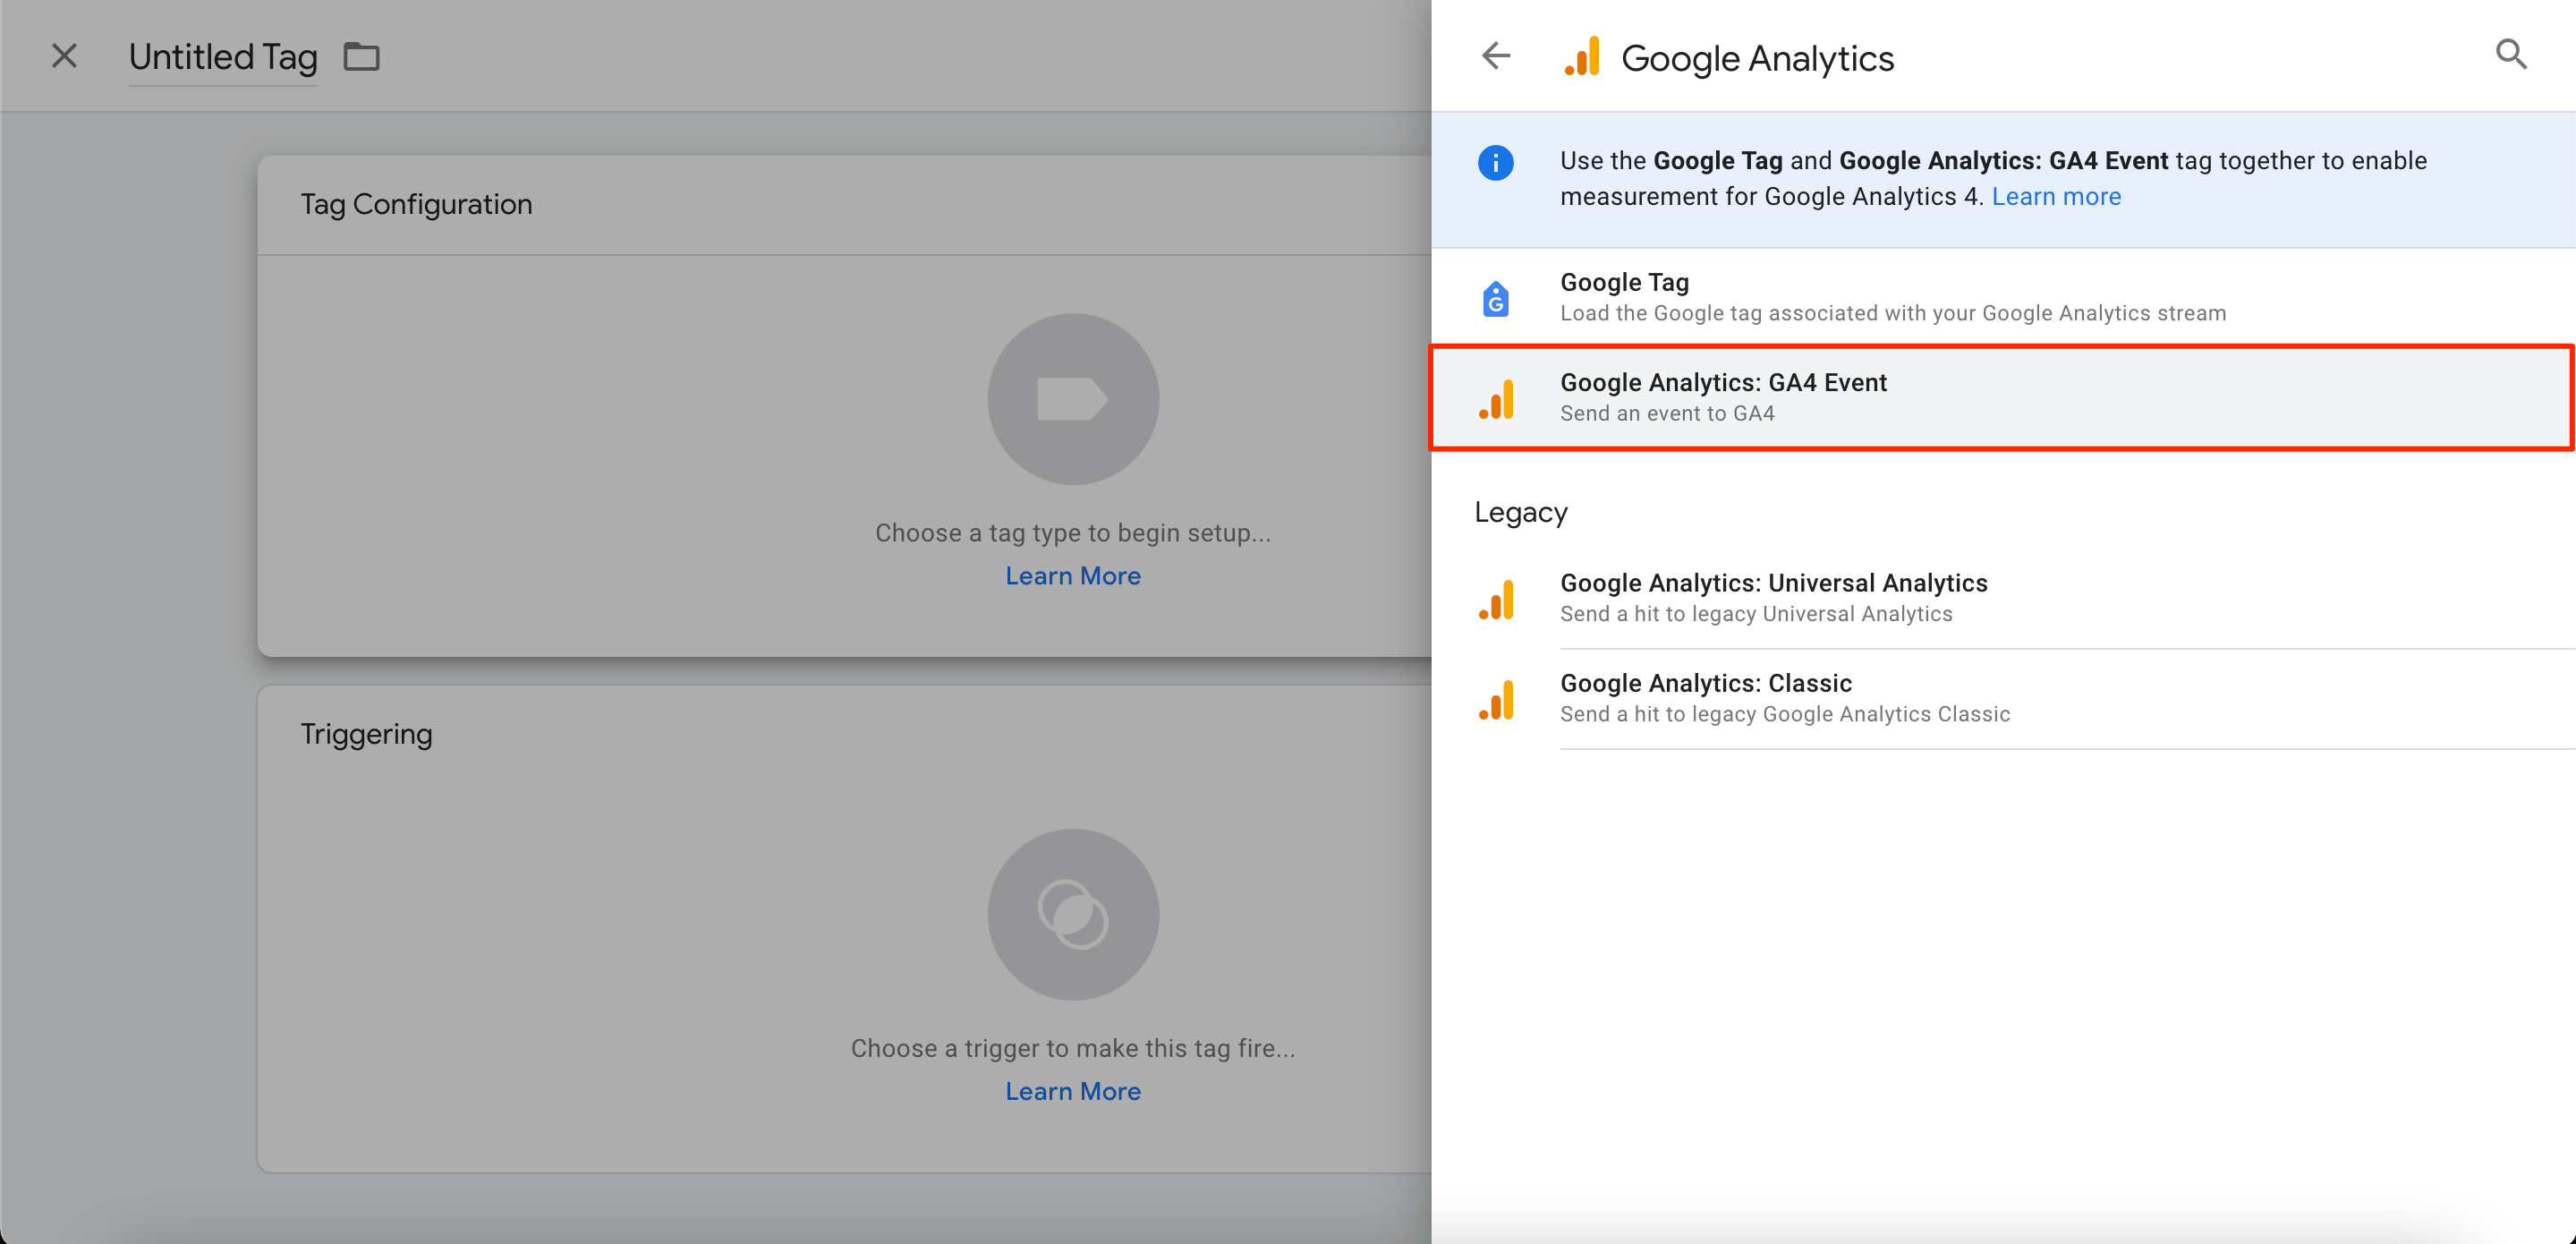
Now, to measure ecommerce events, add a GA4 Event tag configuration. Here’s how:
1. Create a new Tag Configuration and select GA4 Event.
2. Click More Settings>Ecommerce and check Send Ecommerce data. Also, mark the Data Layer as Data Source.
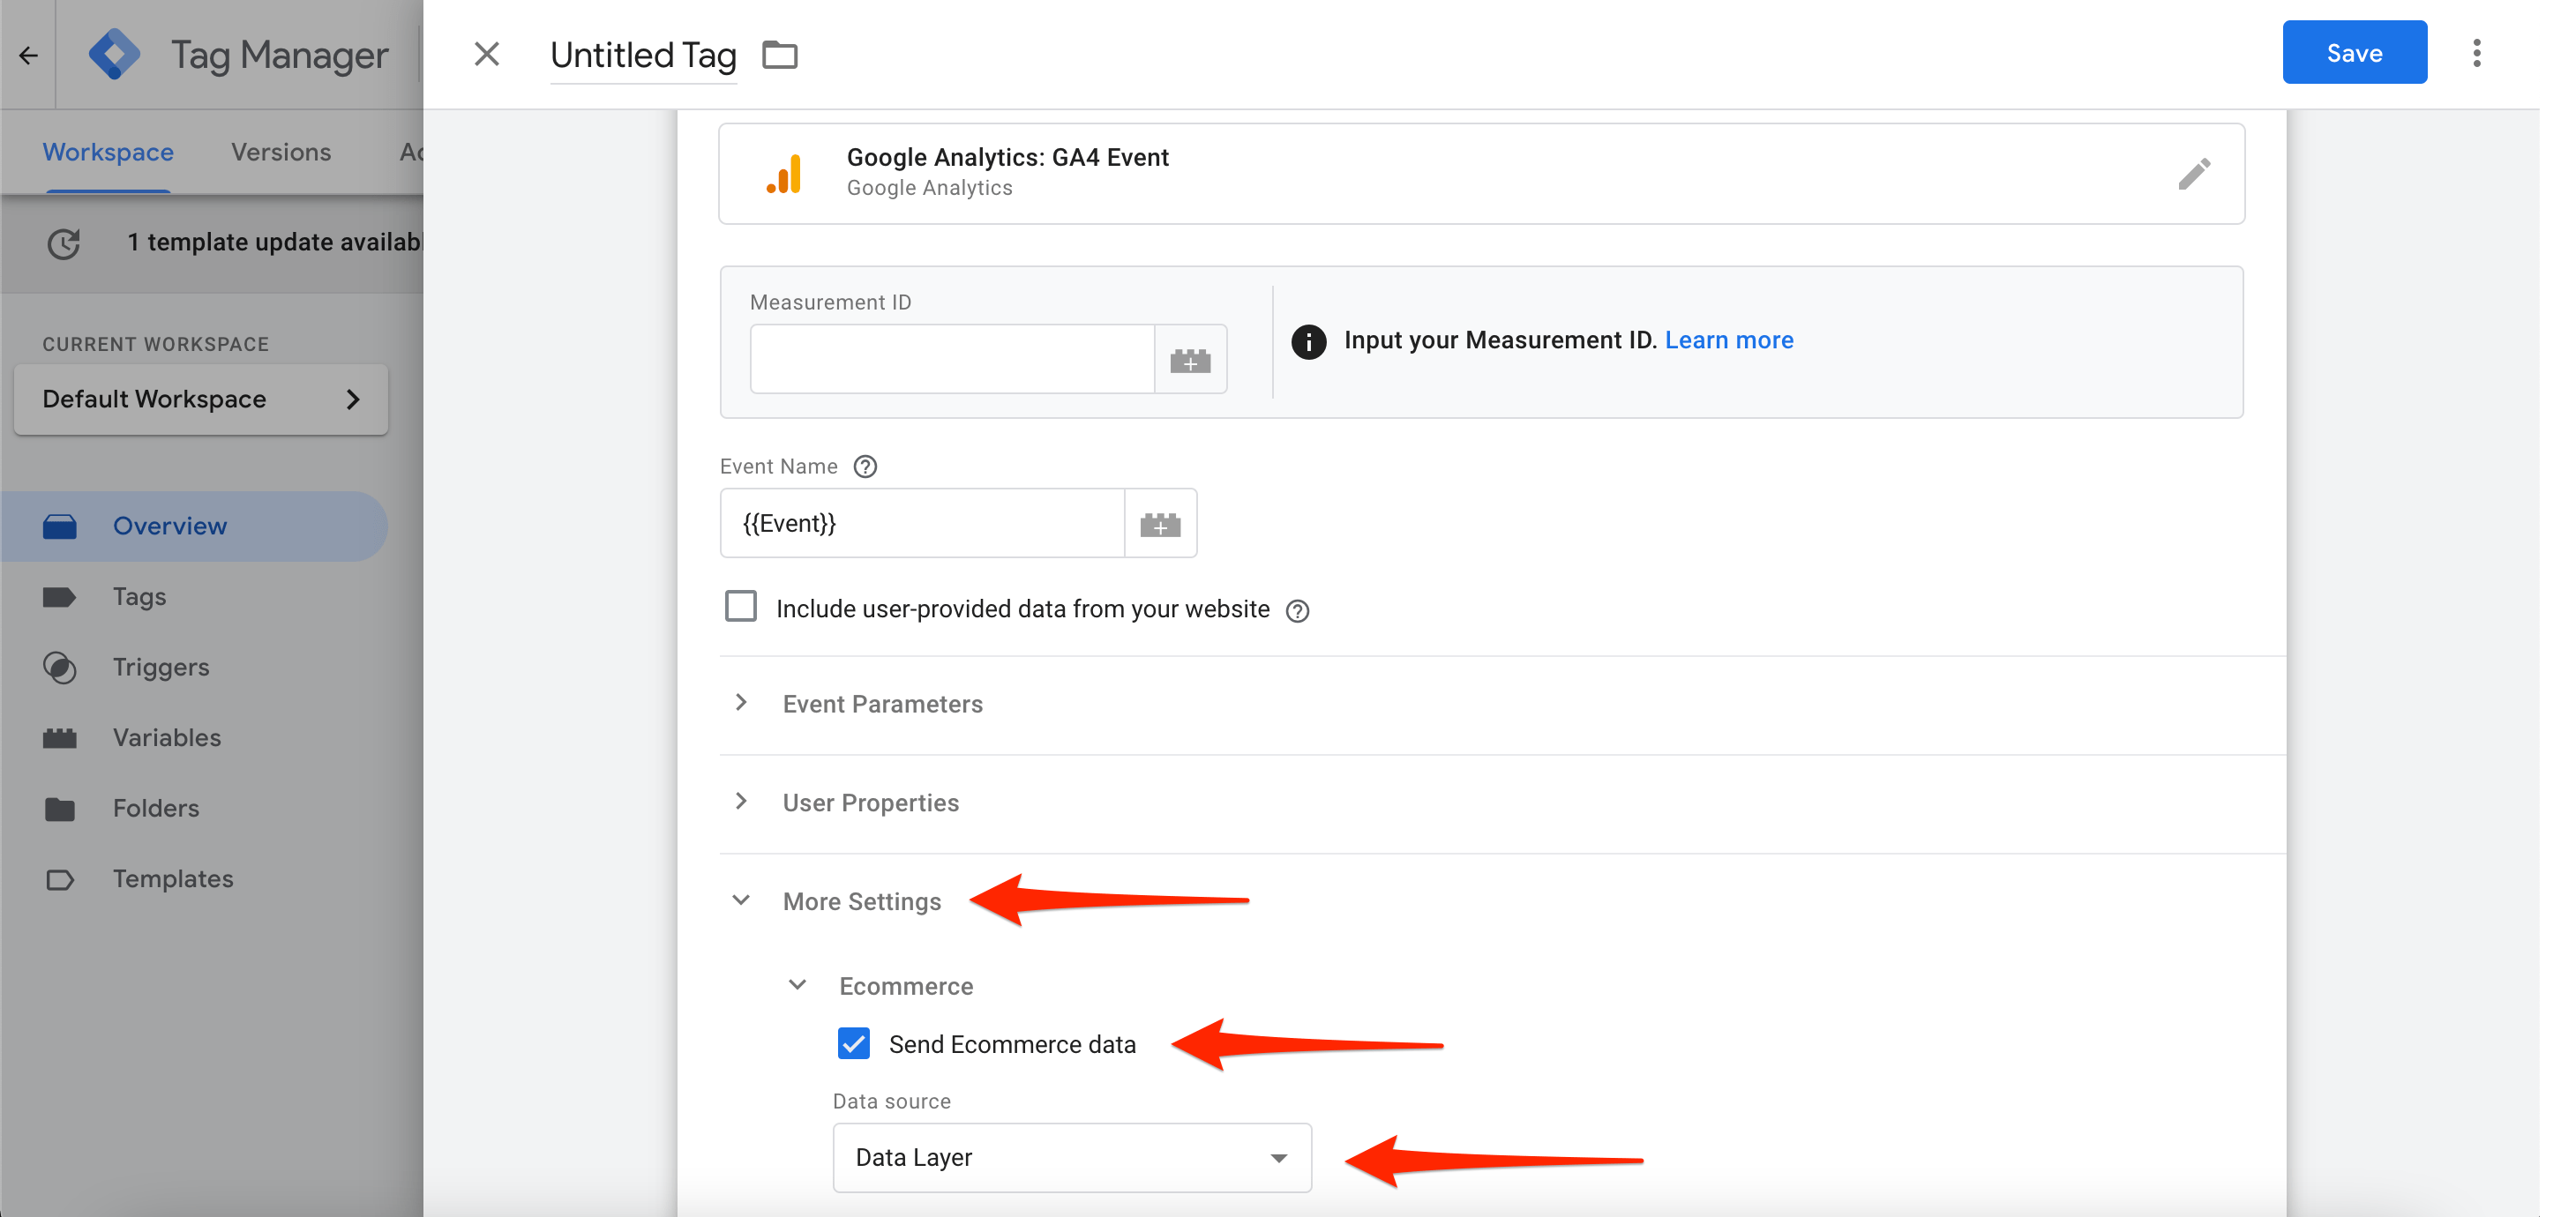
3. Click on the blue Save button to finish up.
Note: There’s no need to create multiple GA4 Event tags. A single GA4 Event tag with the built-in Event variable can be used for all ecommerce events. The tag triggers will indicate which GA4 ecommerce events will activate the tag.
Event Tracking in GA4 Ecommerce
Before you can enable enhanced event measurement, you must first figure out which events to collect data on. Plus, you need to have a clear understanding of the parameters that were collected for each event.
Google has simplified this process for you by creating the following list of events (each of which are recommended for GA4 ecommerce tracking):
- add_to_cart
- purchase
- refund
- remove_from_cart
- select_item
- select_promotion
- view_cart
- view_item
- view_item_list
- view_promotion
Apart from these, there are new GA4 ecommerce events that Google also recommends taking into account:
To enable/disable enhanced events tracking, make sure to:
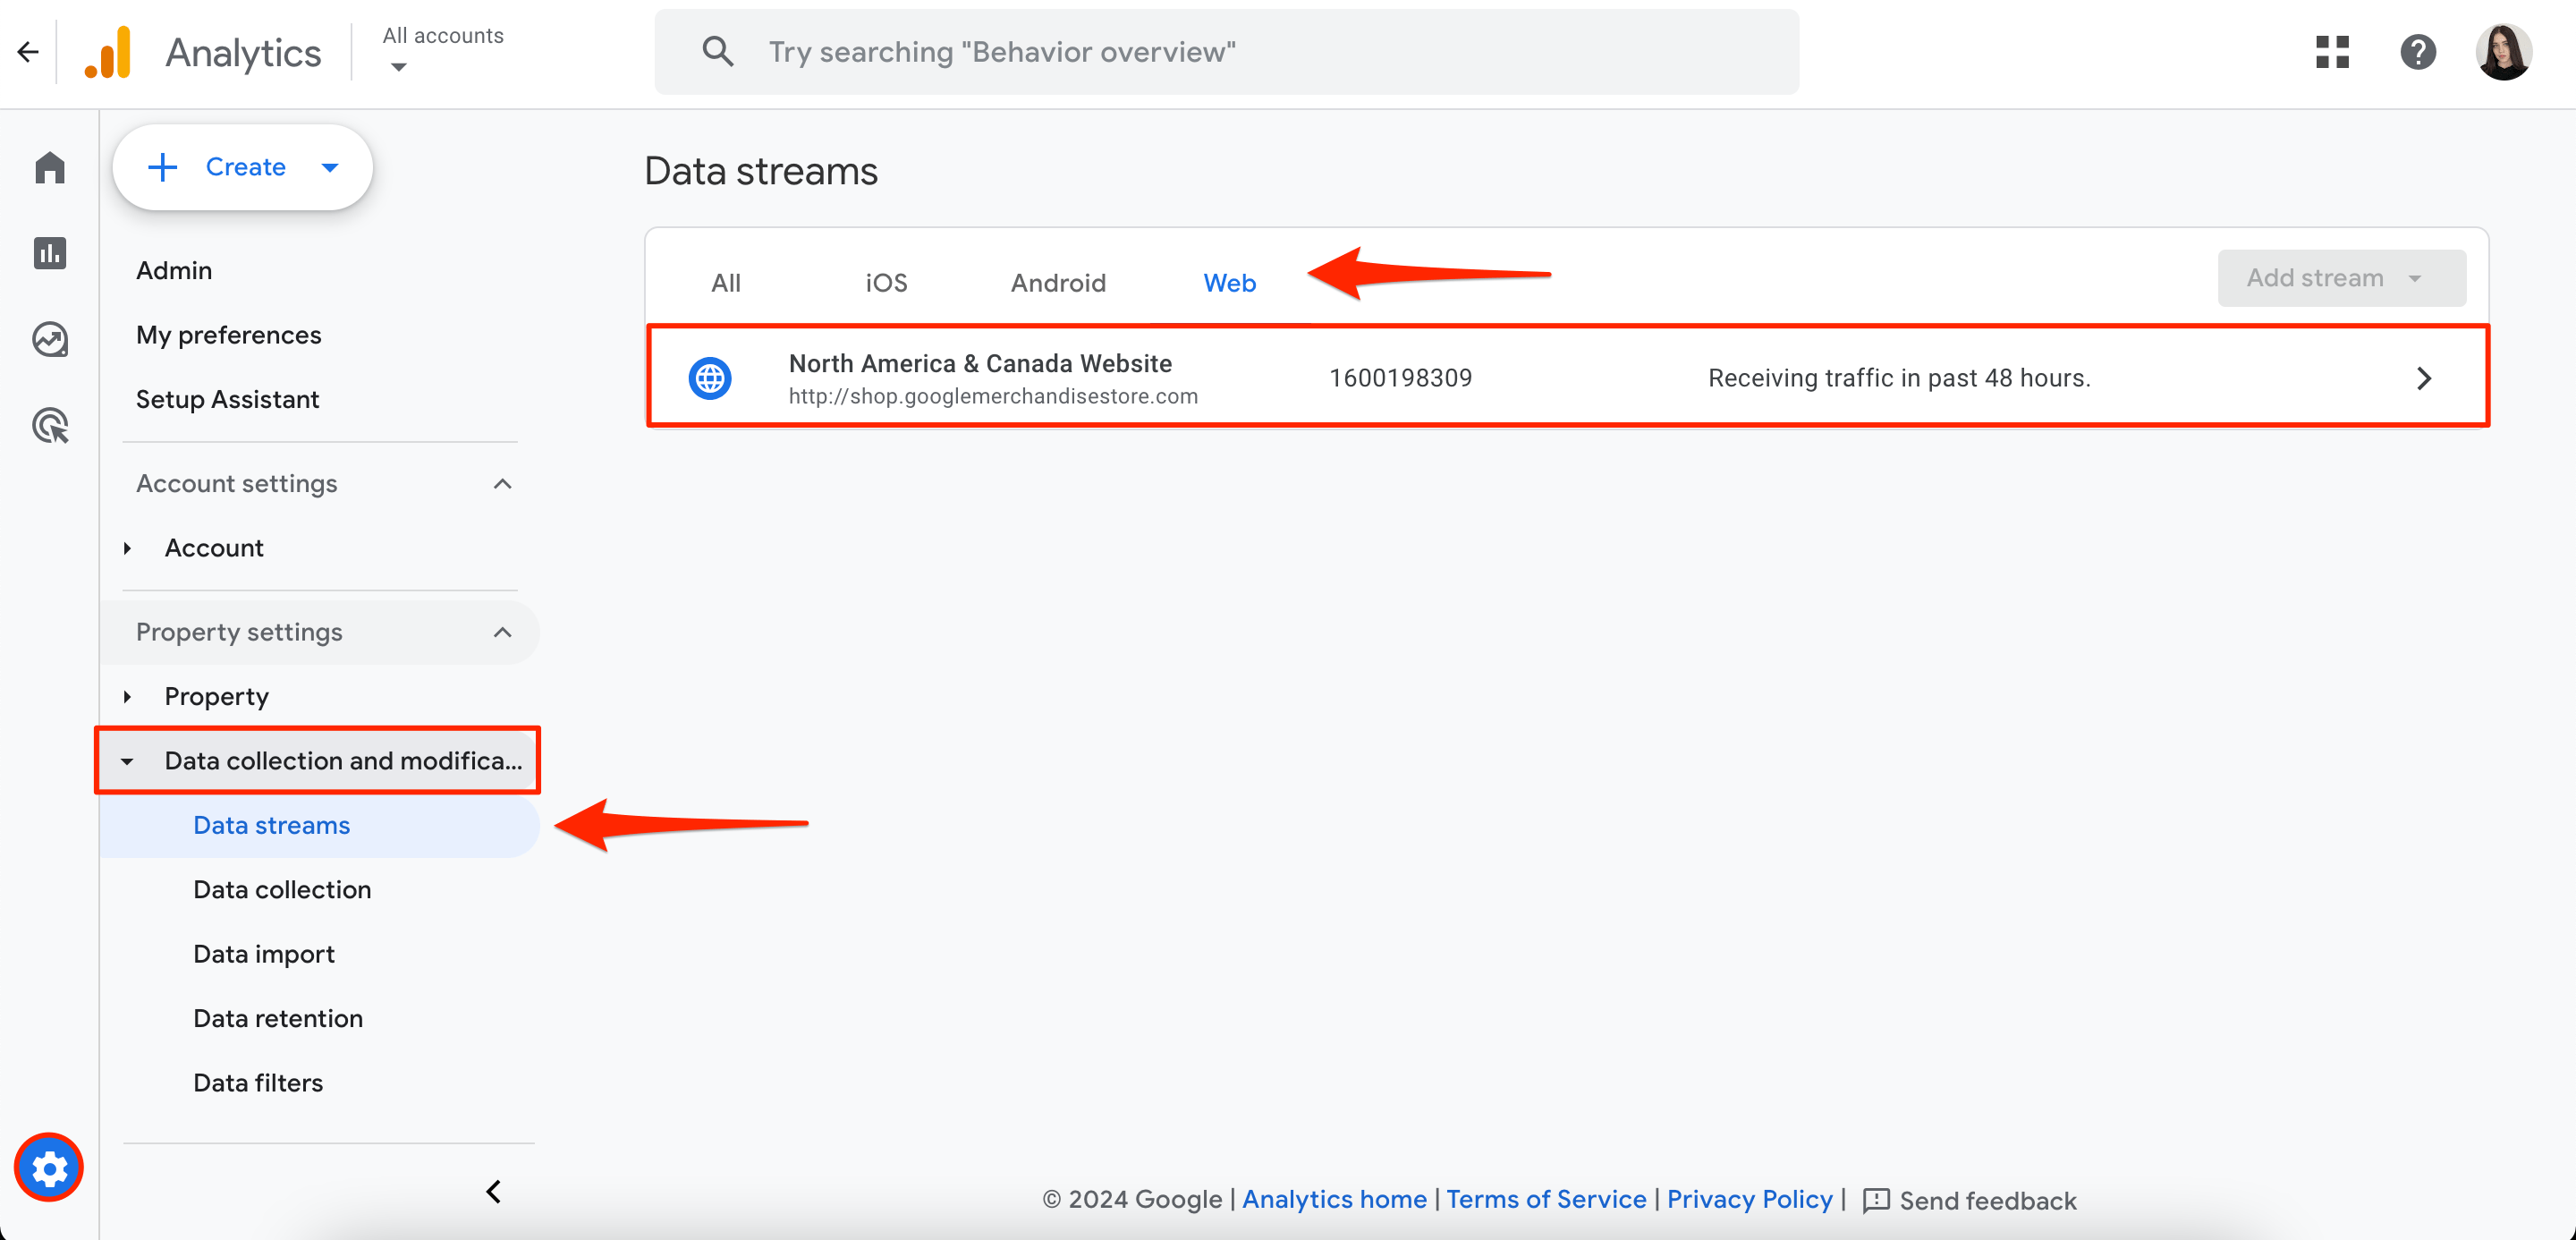
1. Navigate to the Admin block and click on Data Collection and Modification>Data Streams.
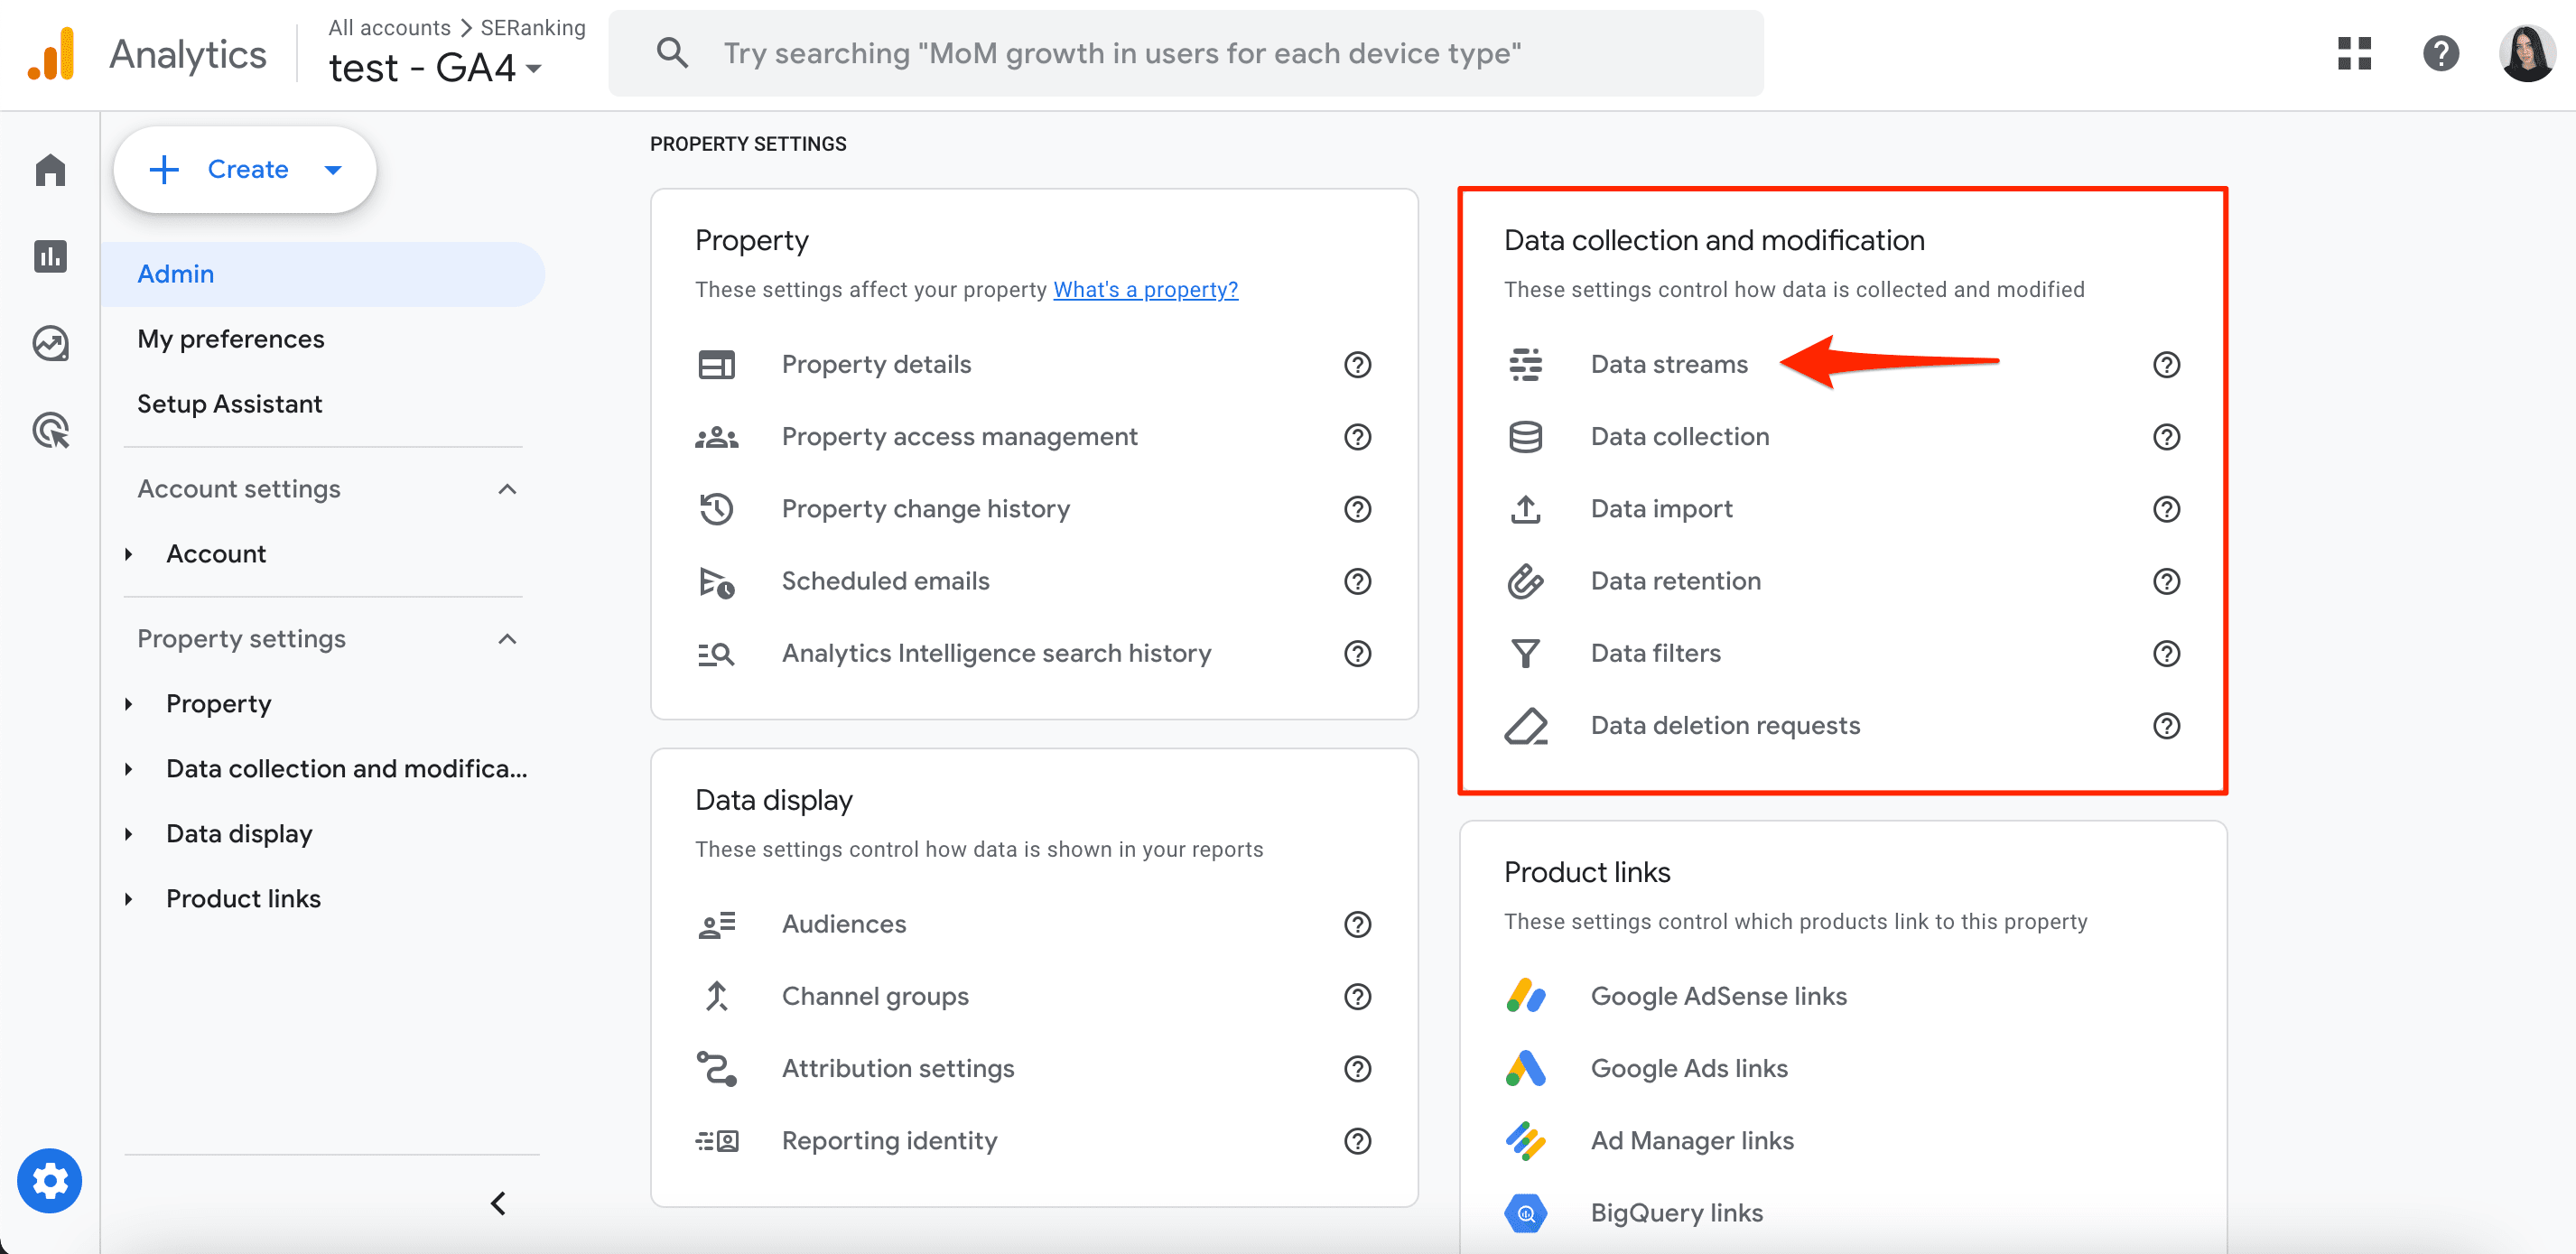
2. Select your data stream.
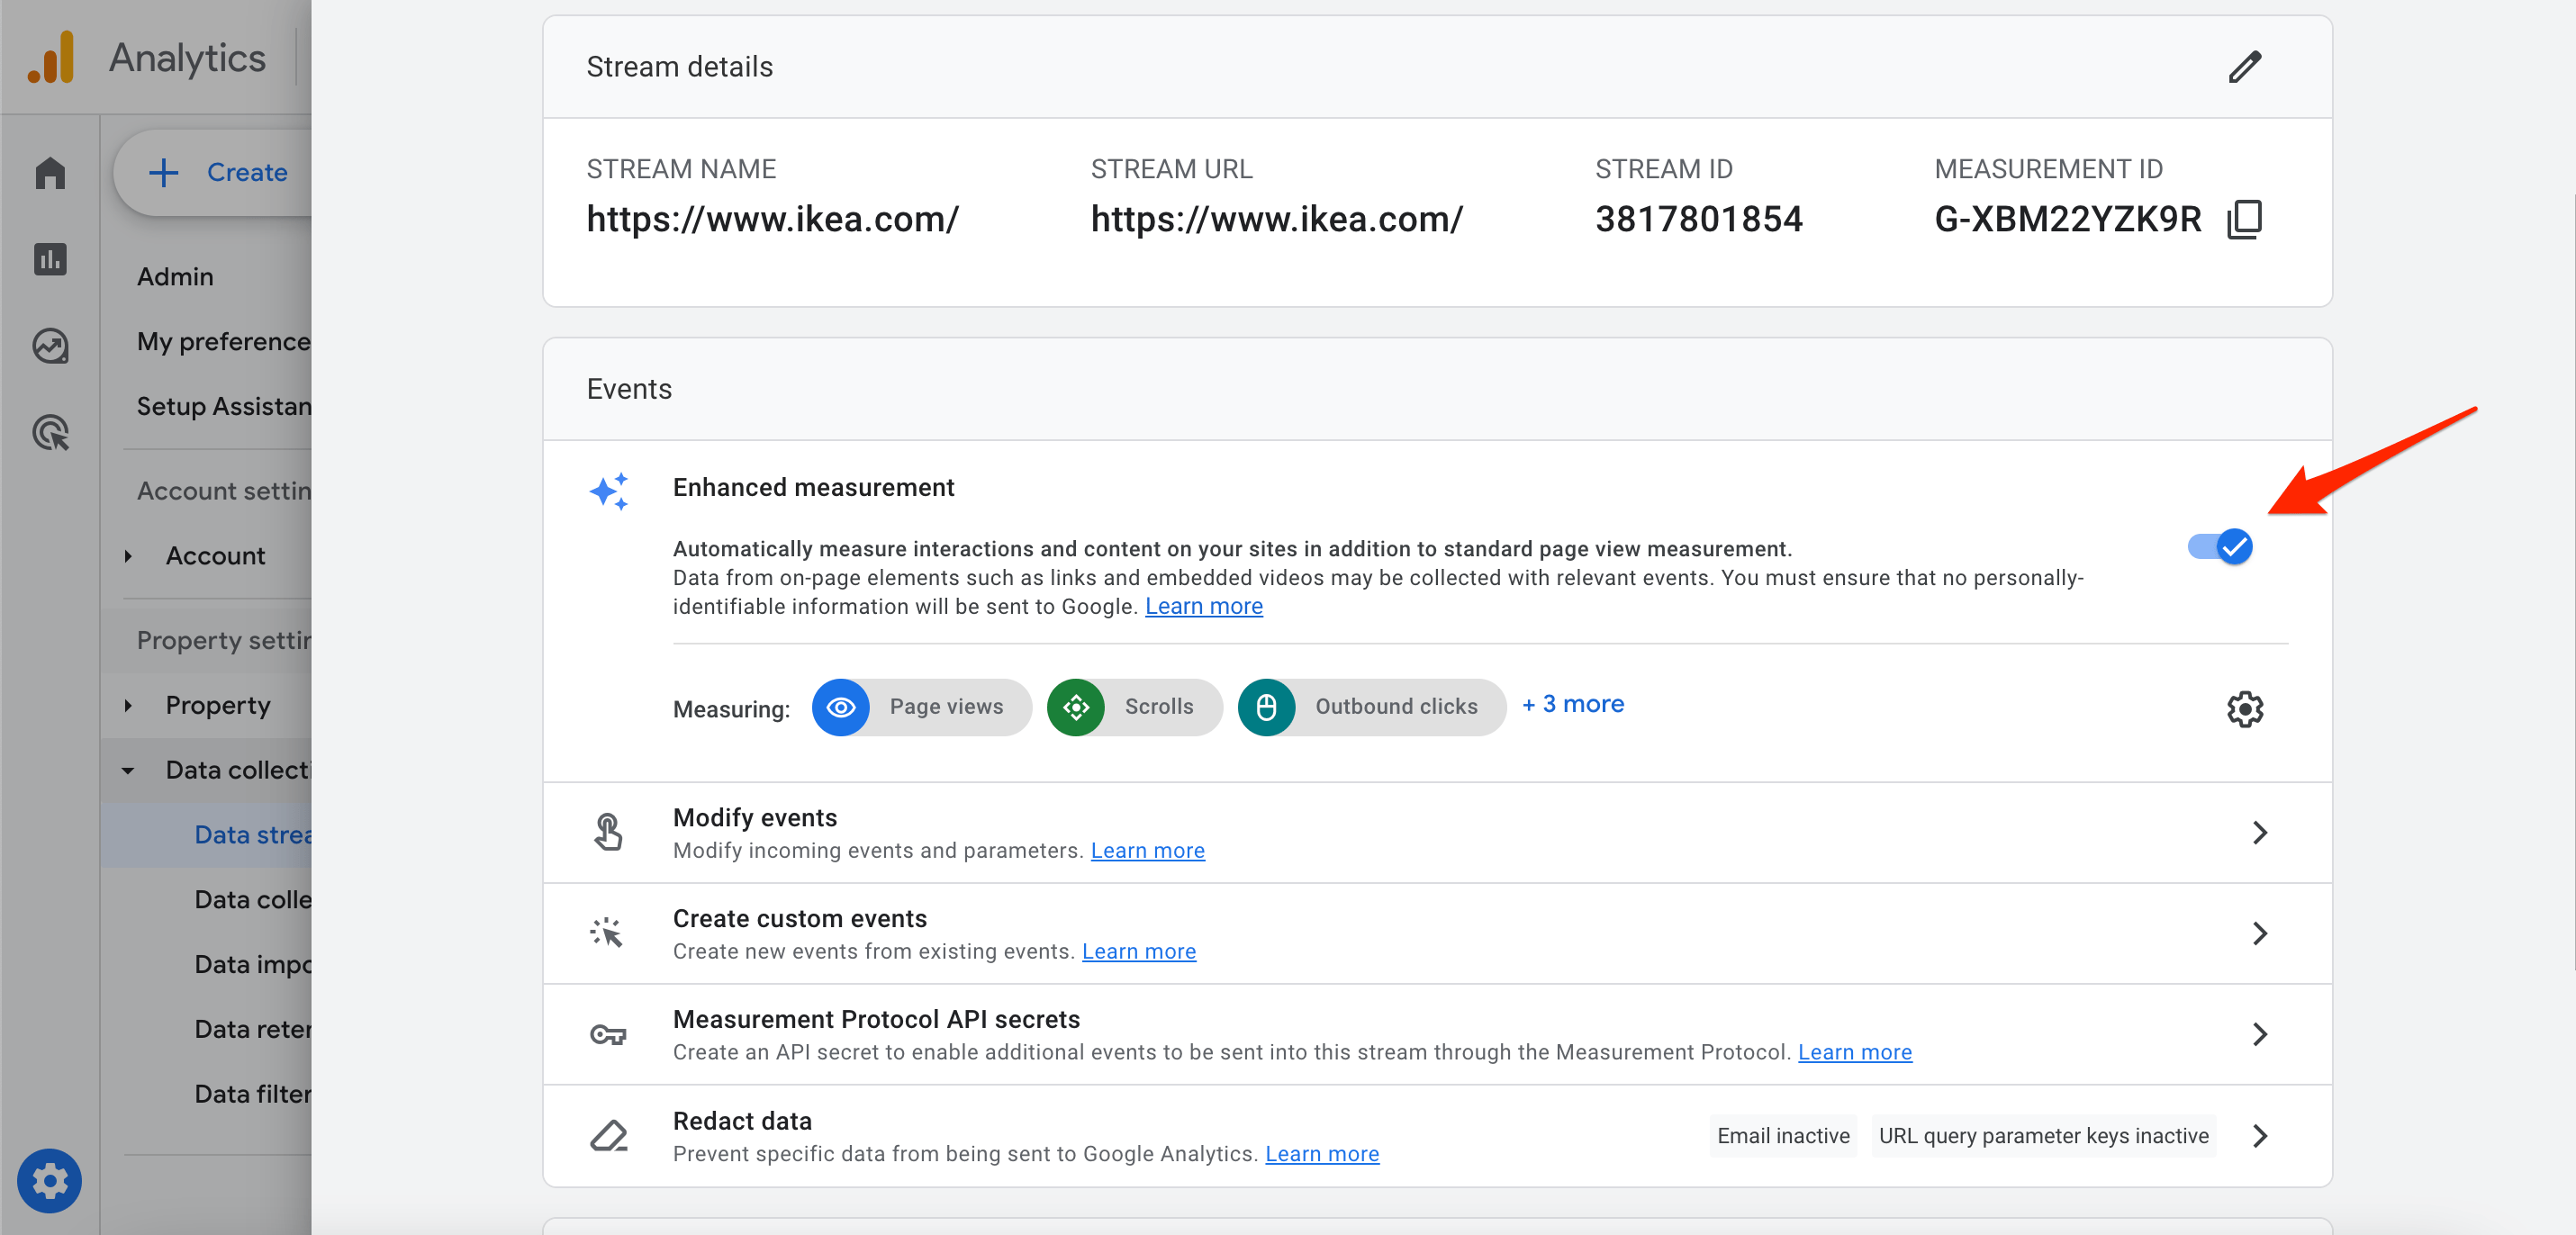
3. Under Enhanced measurement, flip the switch to On to enable all options.
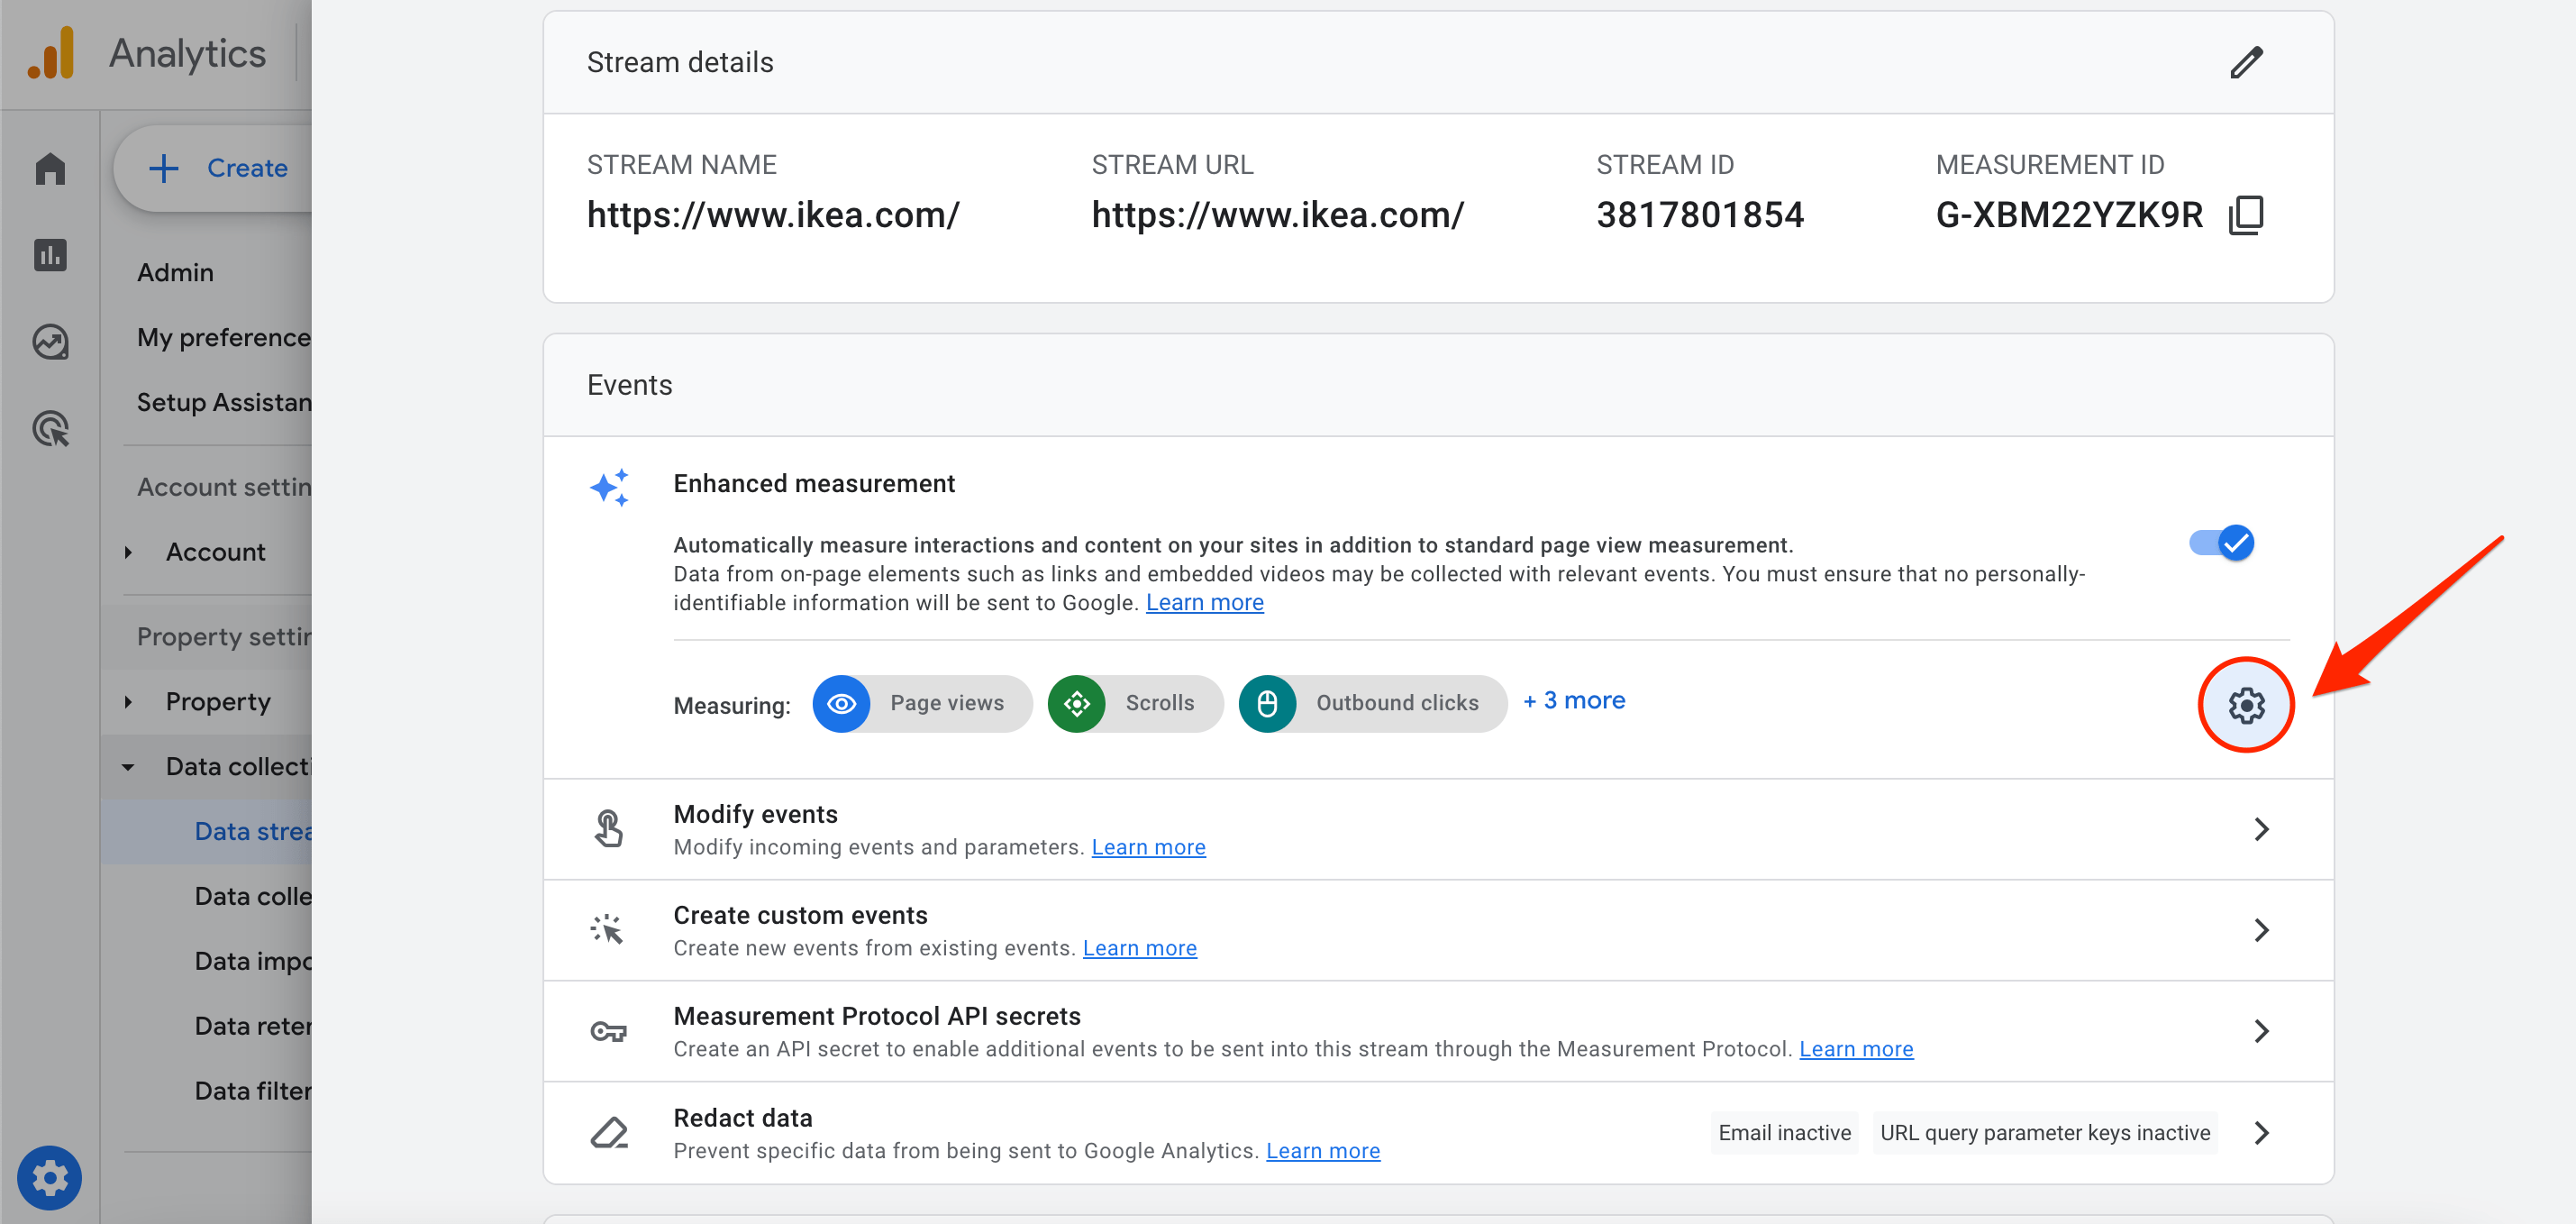
To edit some options, click on the gear icon and adjust the switchers as needed.
GA4 Ecommerce Tracking: Additional Configuration
To get the most out of GA4 ecommerce tracking, consider the configuration features in this section. By implementing them, you can improve the quality of the data you collect and tailor it to your business’s unique needs.
Set up Cross-Domain Tracking
For websites operating across several domains (e.g., you display products on the main site but sell through a third-party platform), cross-domain tracking is a must. Otherwise, once a user goes from one domain to another, you risk losing data on the original source of traffic. Plus, your reports will display a significantly larger user count than the actual number (as new sessions are started again).
To avoid these problems and ensure accurate data tracking when users move between several domains, set up cross-domain tracking. Here’s how:
1. In the Admin section, navigate to the Data Collection and Modification tab. Click Data Streams>Web and select your web data stream.
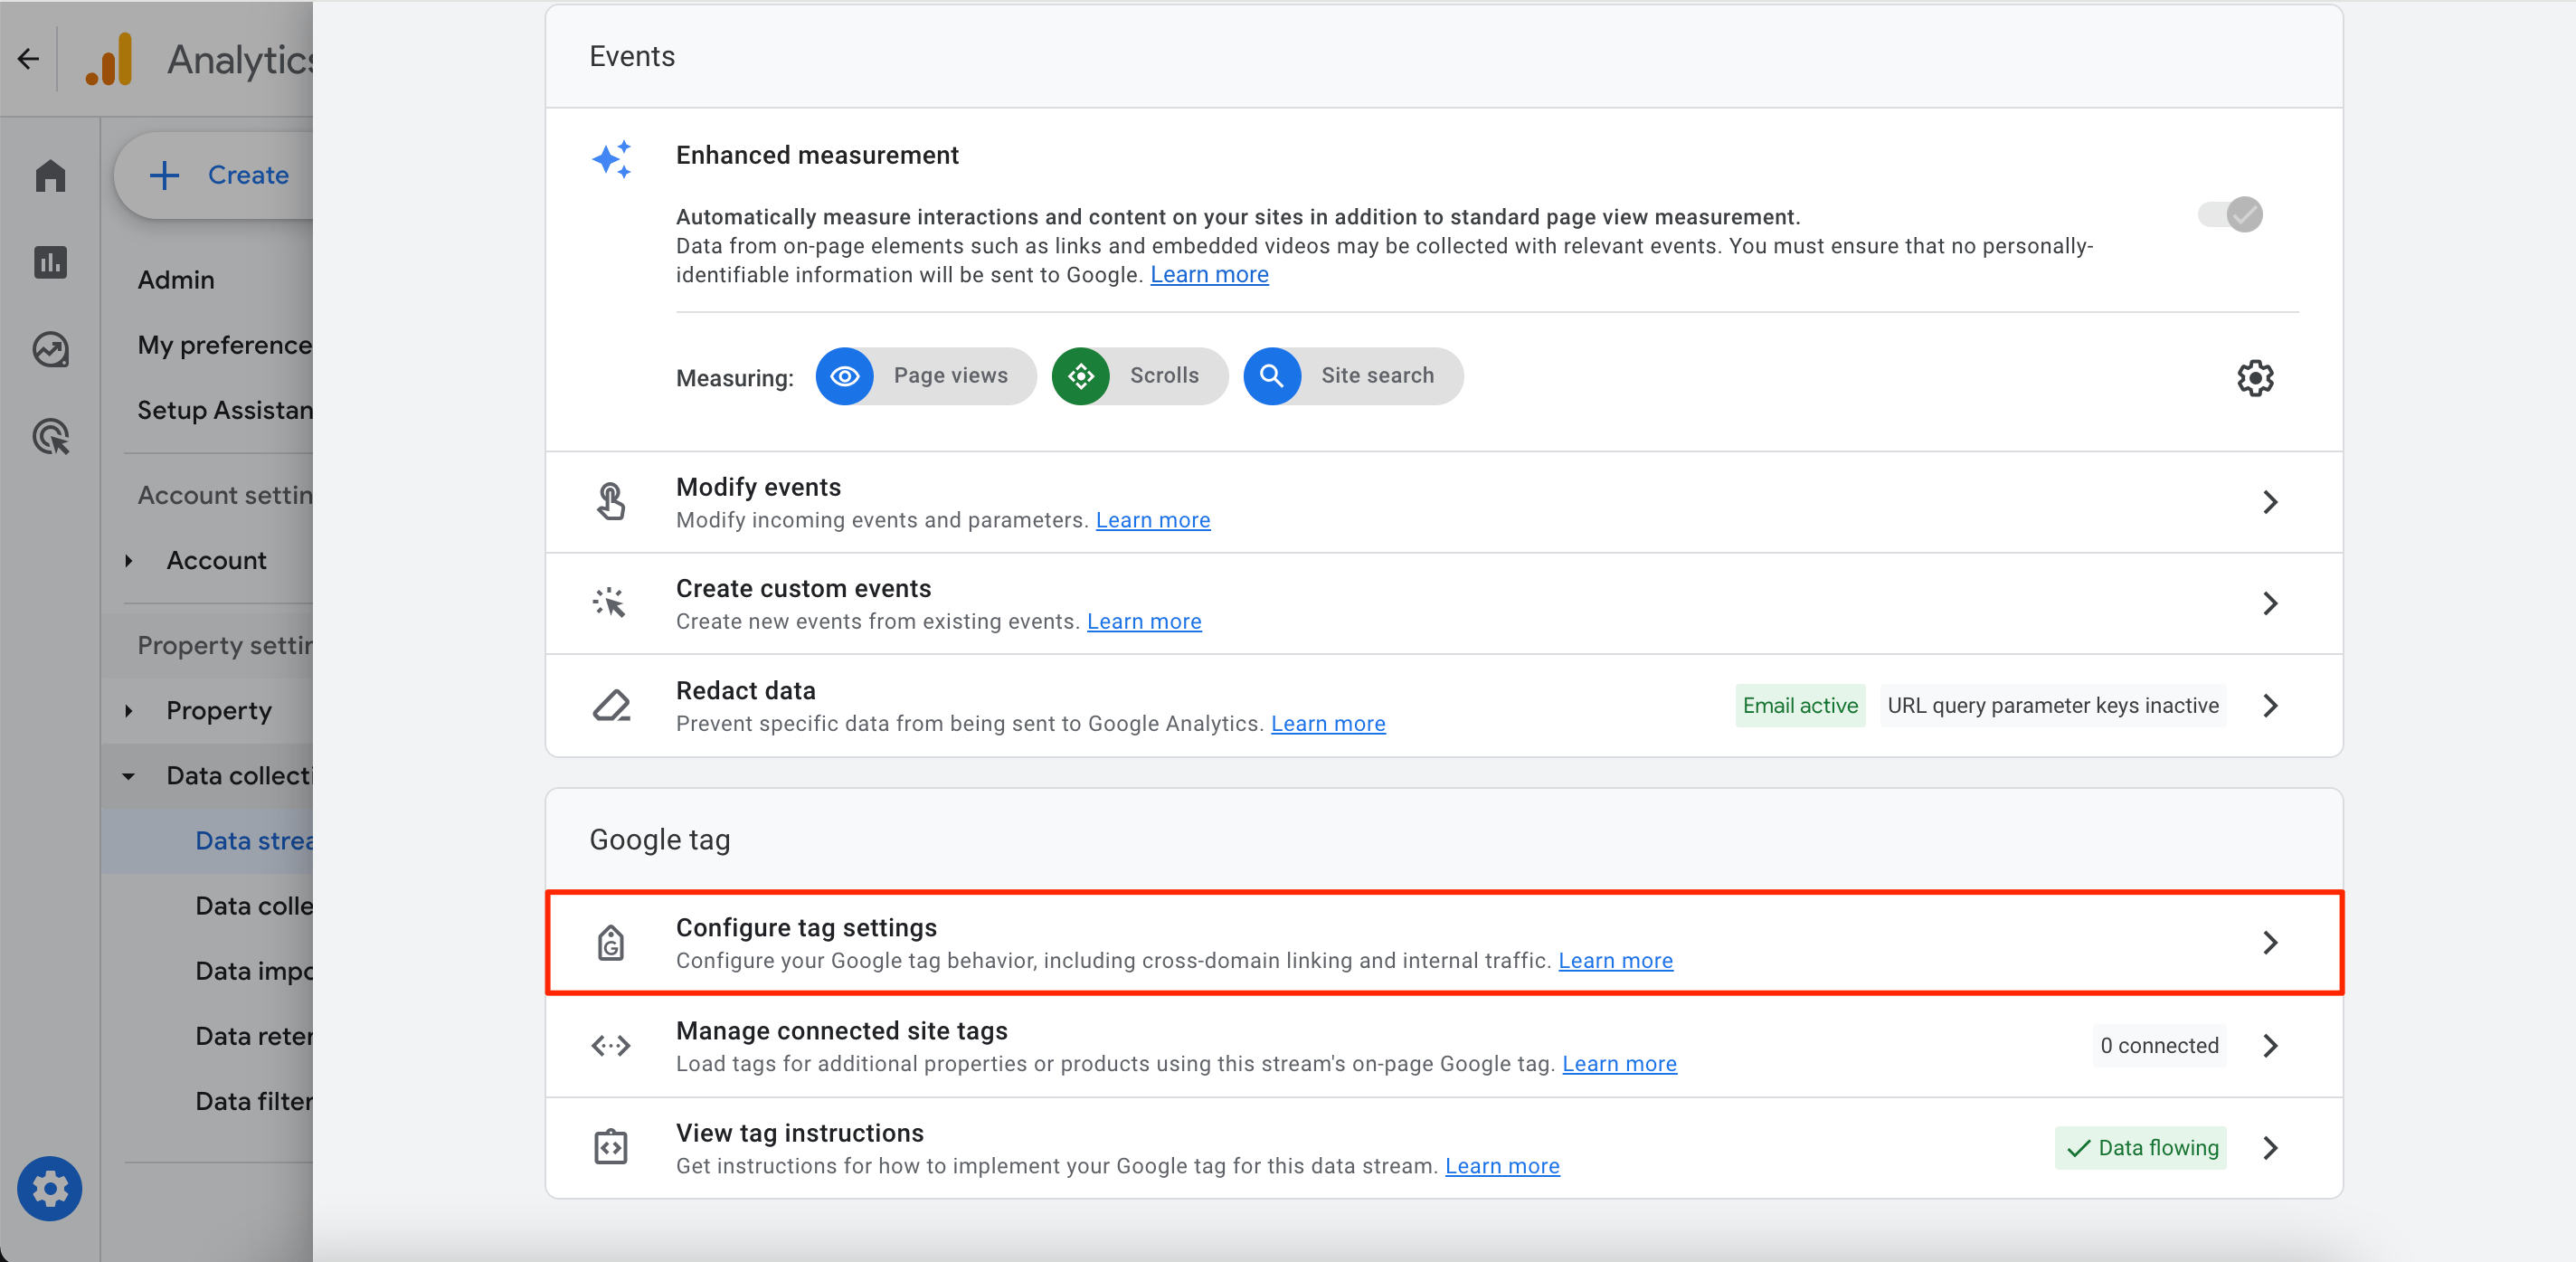
2. Under the Google tag block, click Configure Tag Settings.
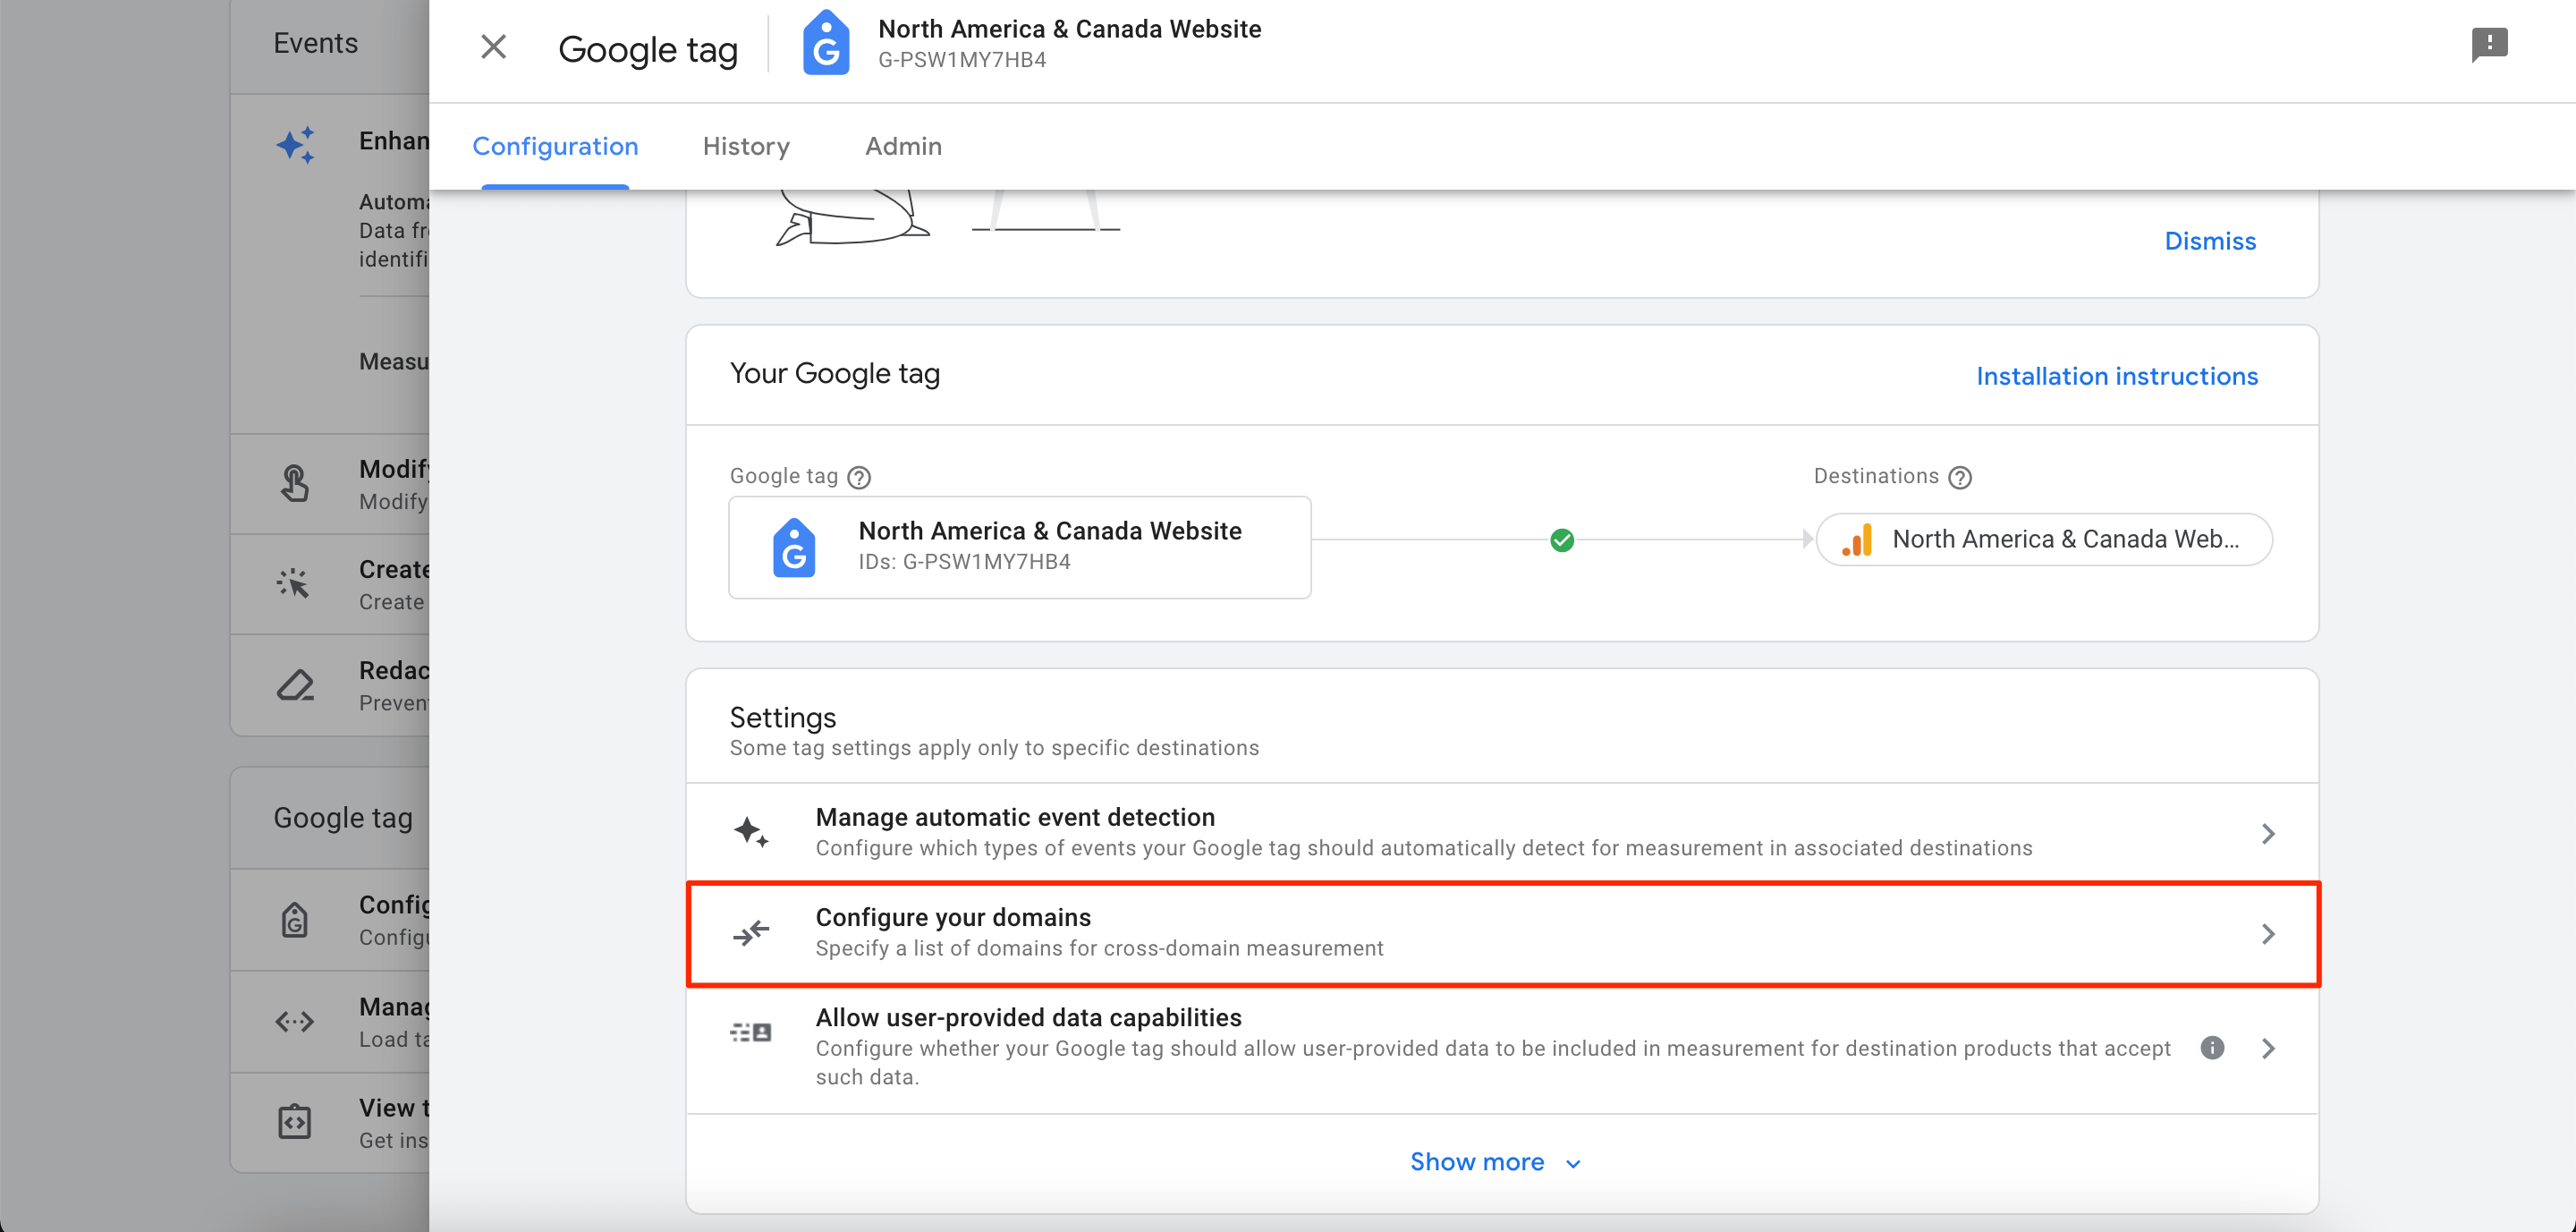
3. In the Settings section, select the Configure Your Domains option.
4. If you use the same Google tag for your domains, they will be shown in the Recommendations section. Click Add to accept a recommendation.
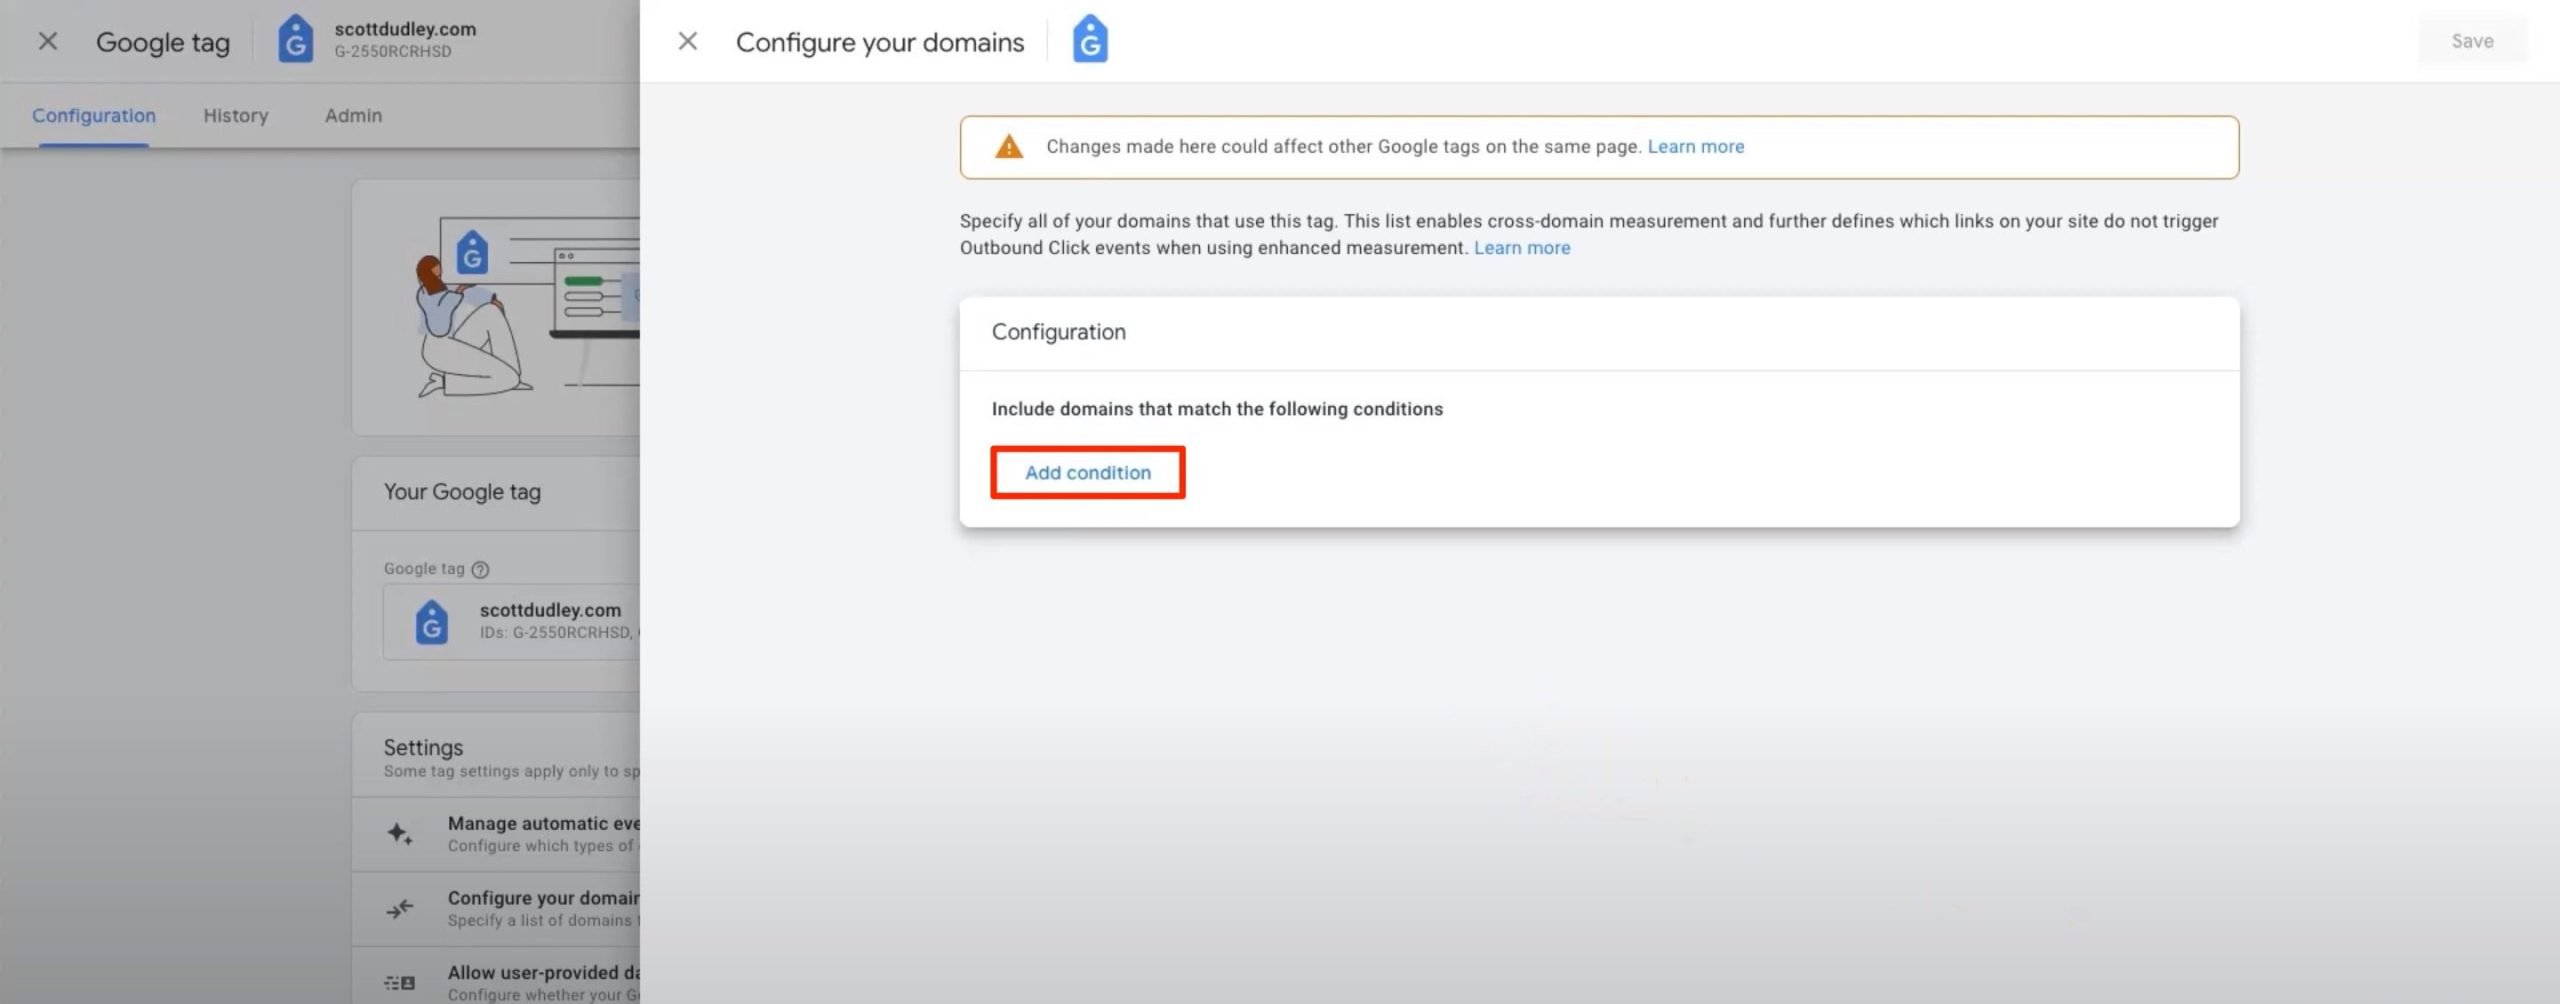
To manually add a domain, click the Add condition under Include domains that match the following conditions:
- Choose a match type.
- Under the Domain field, enter the identifier for each domain that you want to include in the cross-domain measurement.
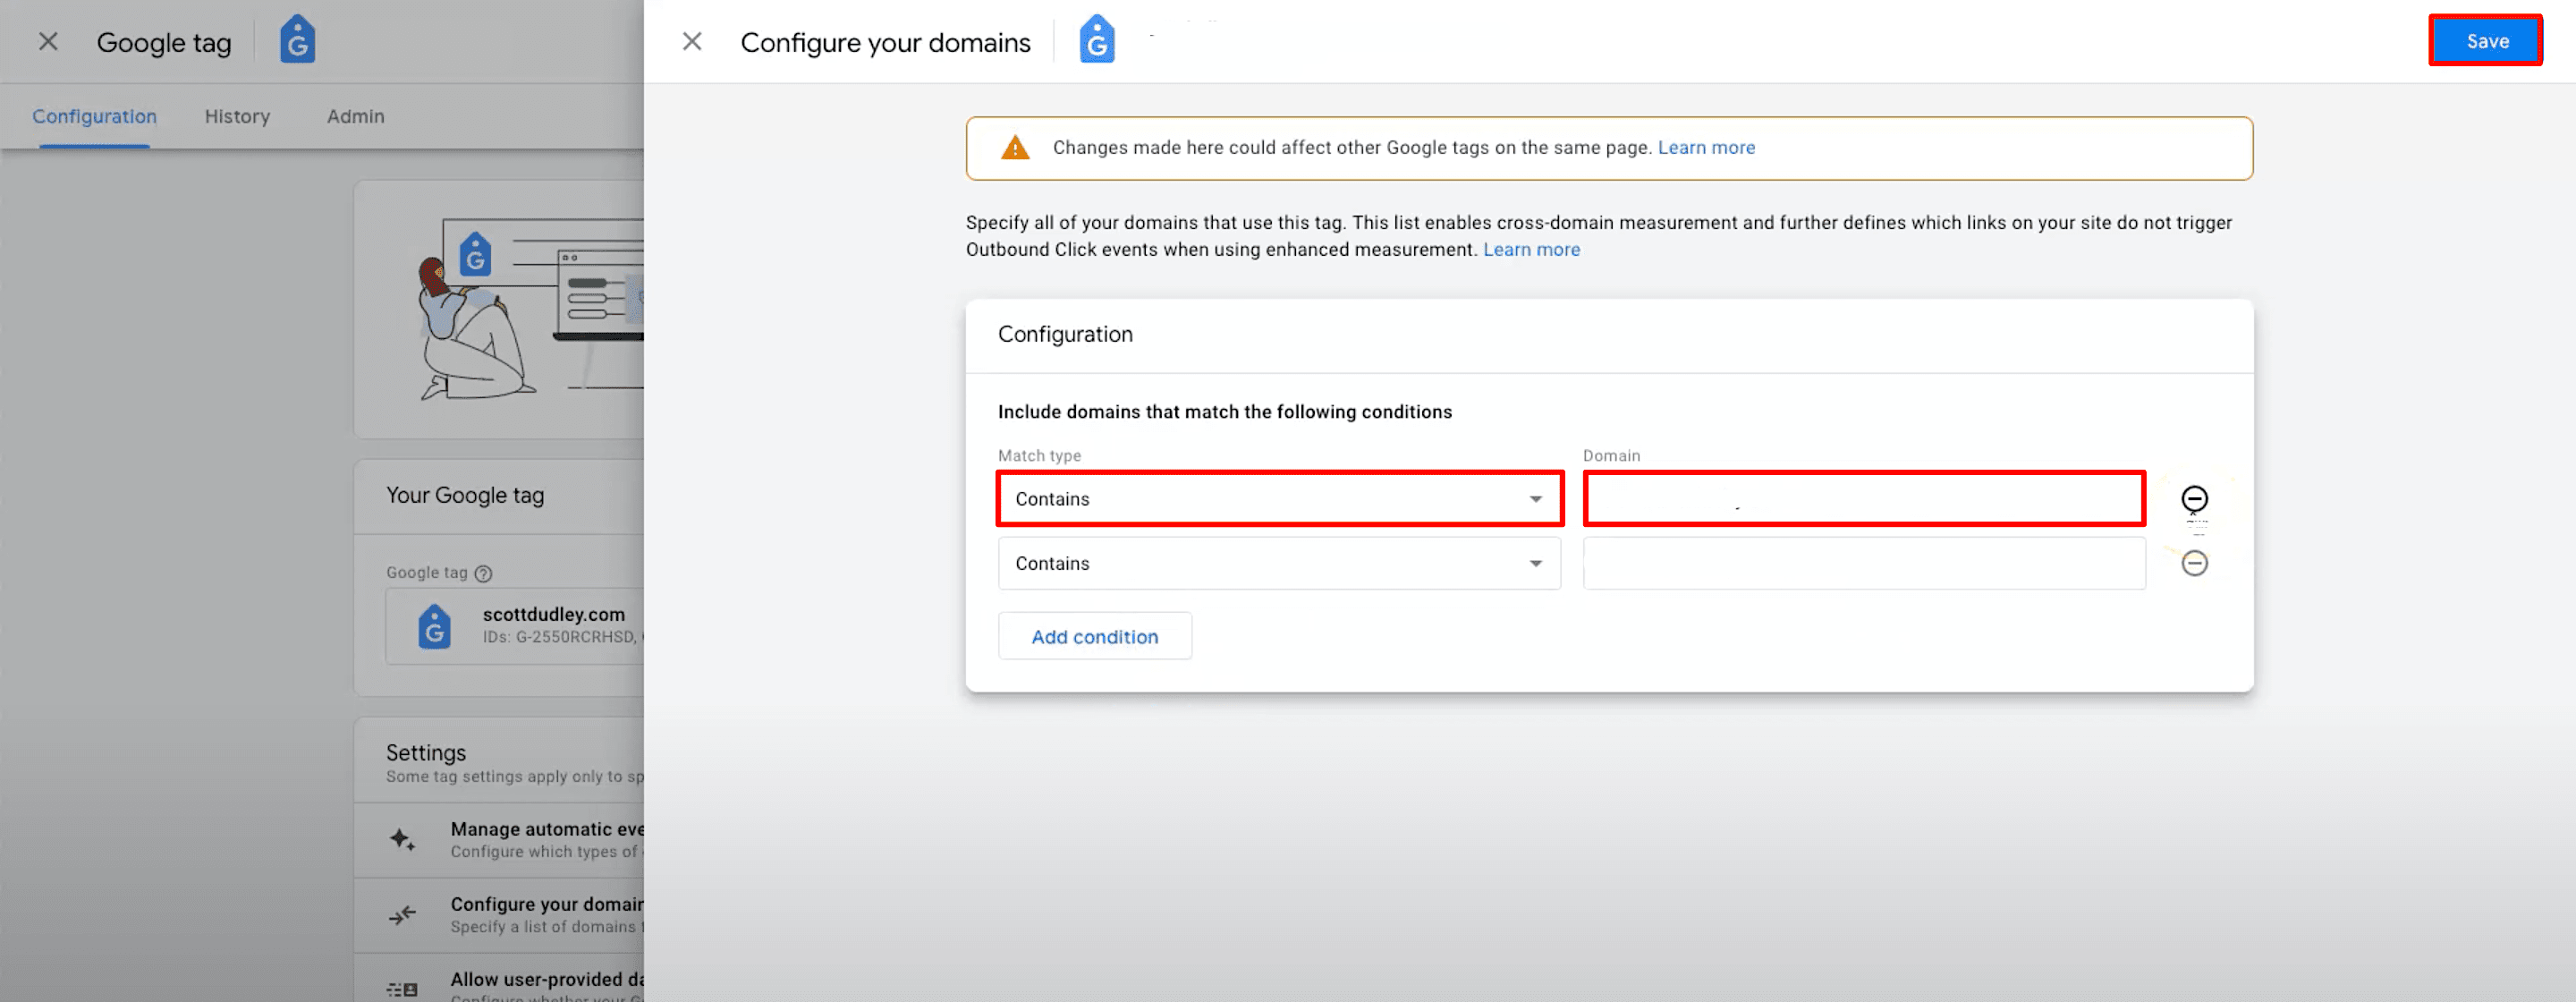
5. Save implemented changes.
Define and Filter Out Internal IPs
Only impartial data can bring value to your analysis. This suggests that web traffic from you and your employees will not improve the accuracy of your data insights. The team behind the site tends to interact with the website much differently than its actual users.
To improve the quality of your data (making it easier for you to understand who your real visitors are, where they come from, and what they’re doing on the website), you should filter out internal traffic.
Here is how to do it using GA4:
1. Under the Admin section, navigate to the Data Collection and Modification tab. Click Data Streams>Web and select your web data stream.

2. Under the Google tag block, click Configure Tag Settings.

3. Click Show More.
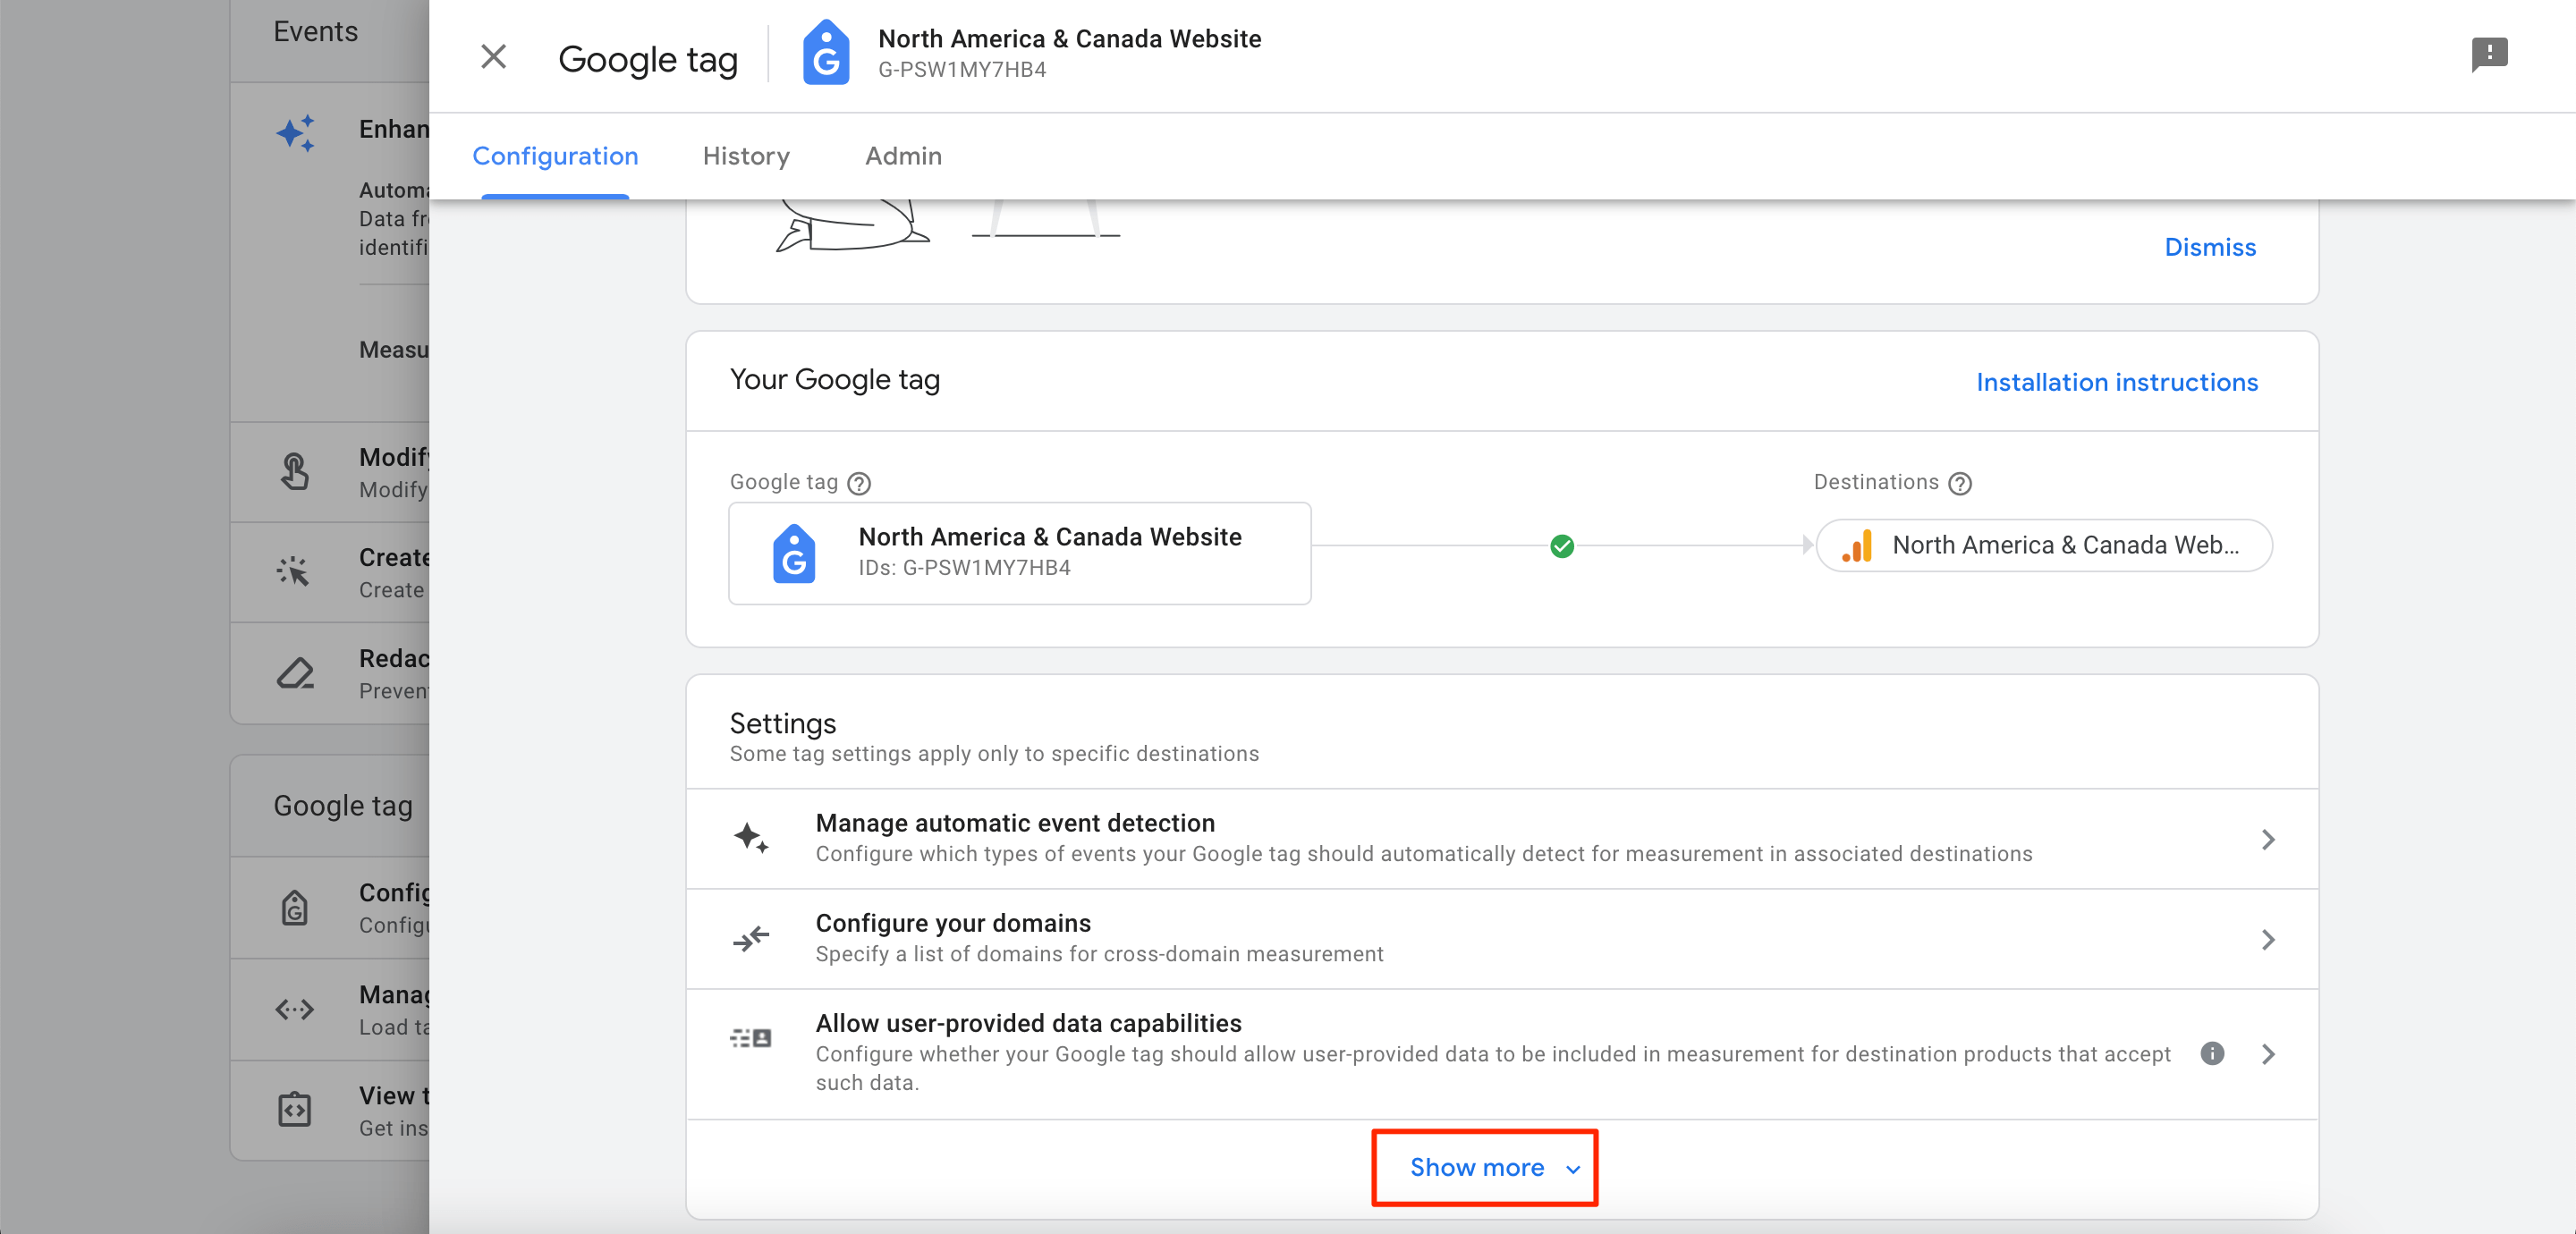
4. Click Define Internal Traffic.
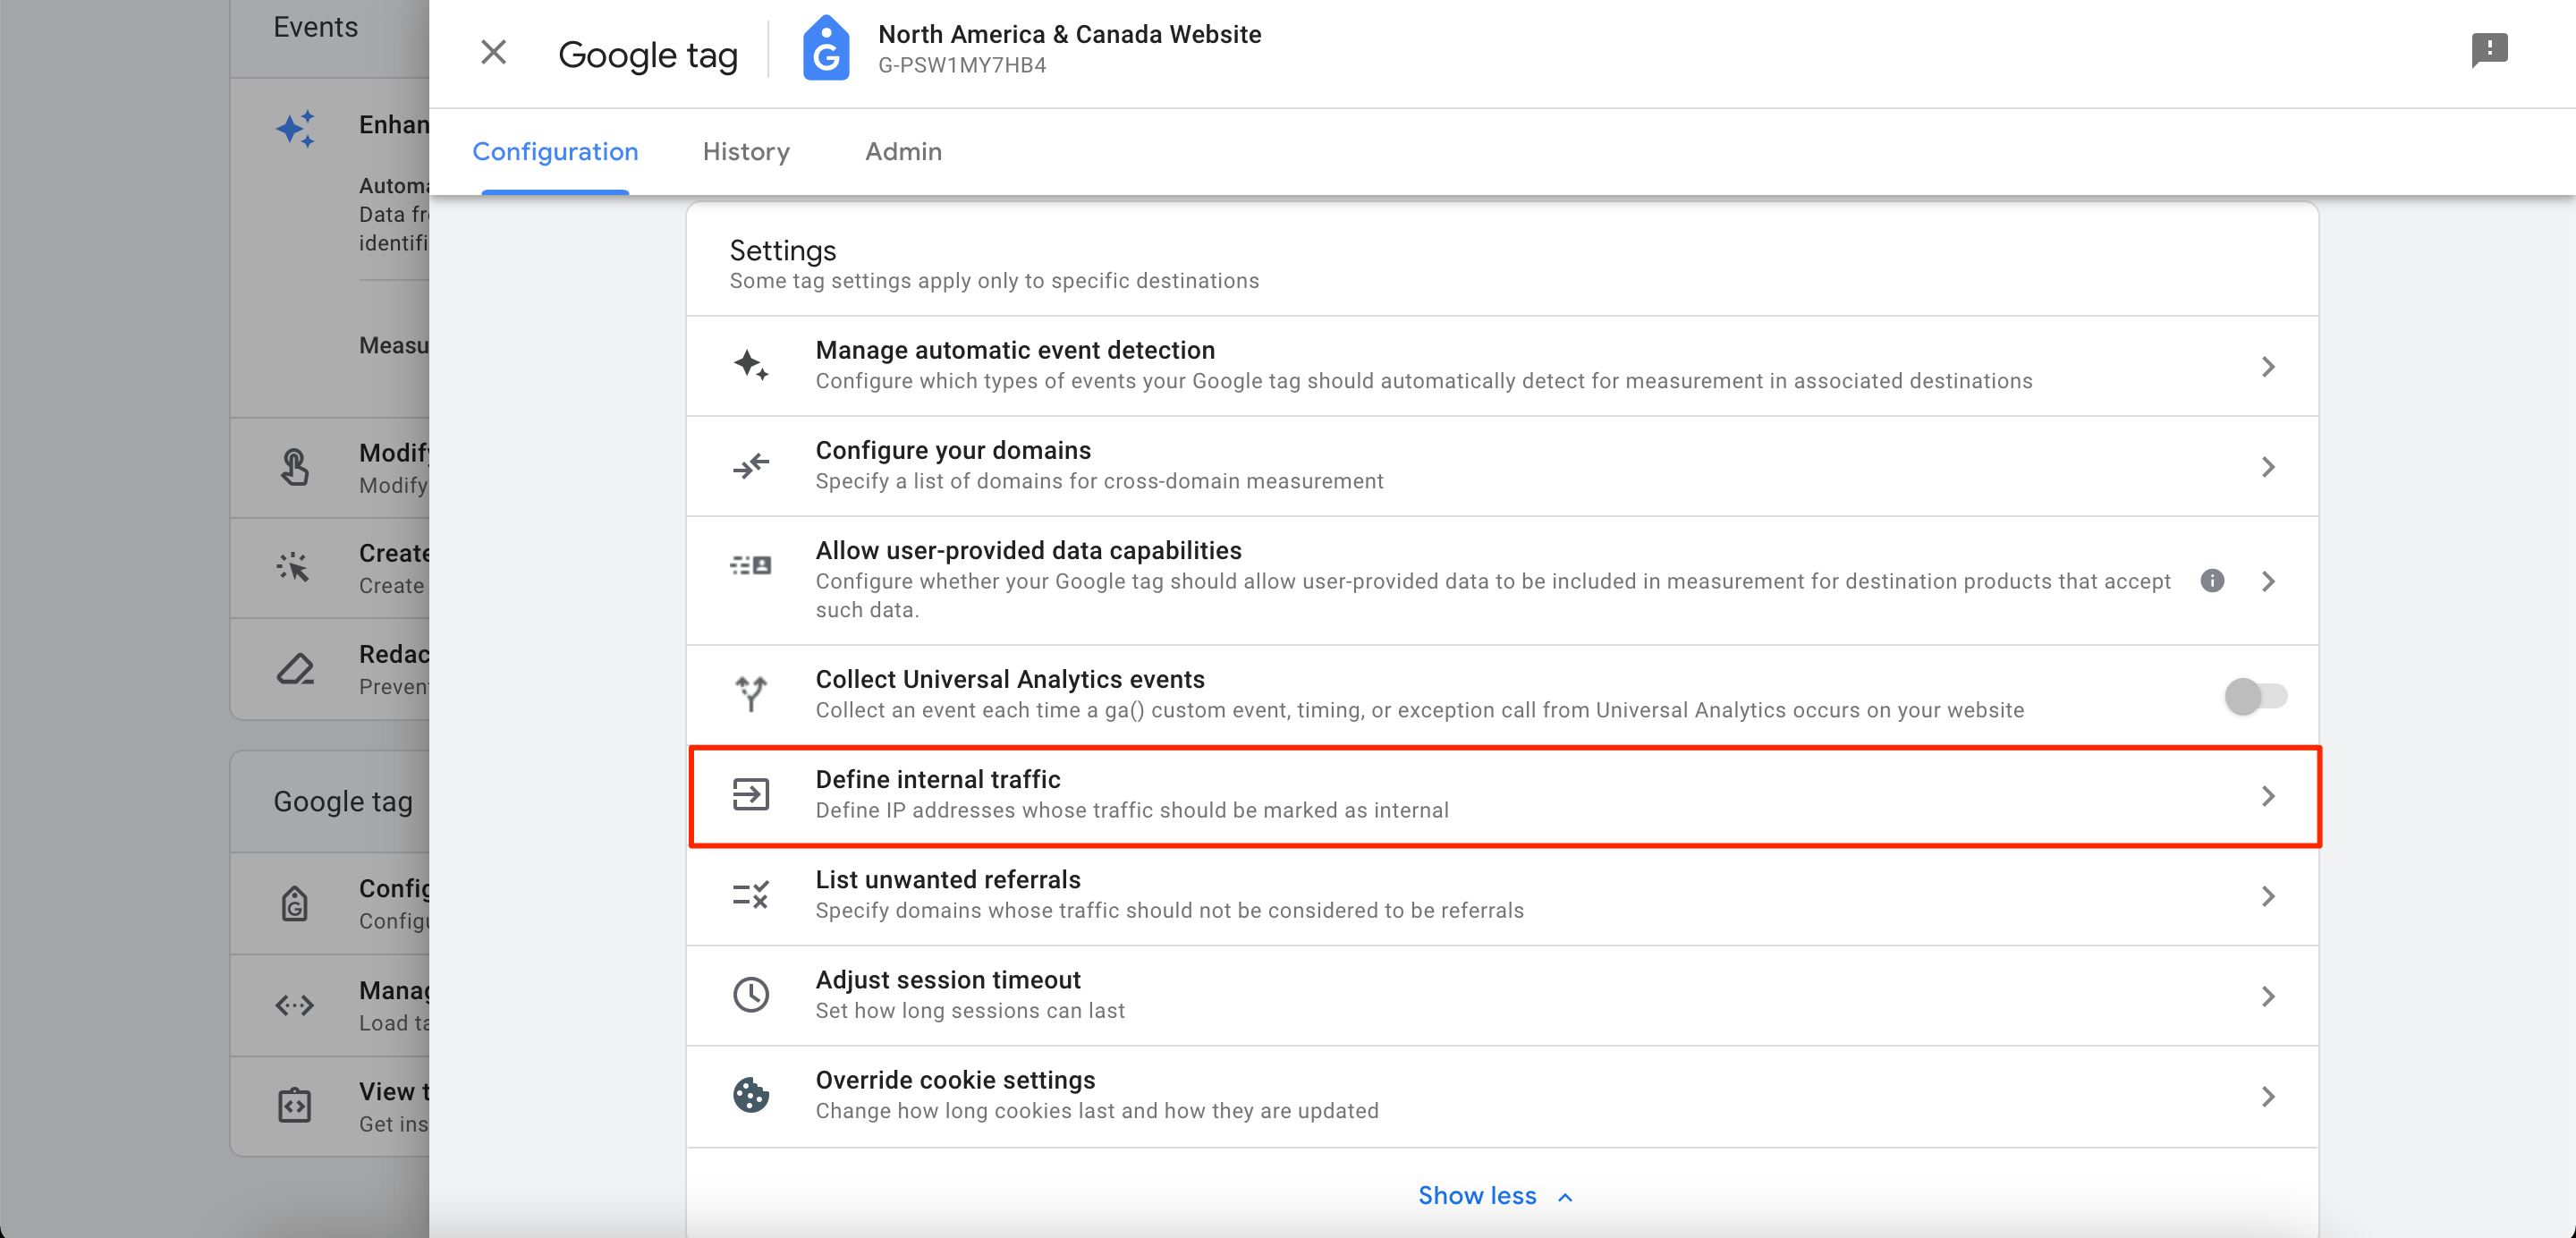
5. Click Create.

6. Now, enter a rule name and value for the traffic_type parameter.
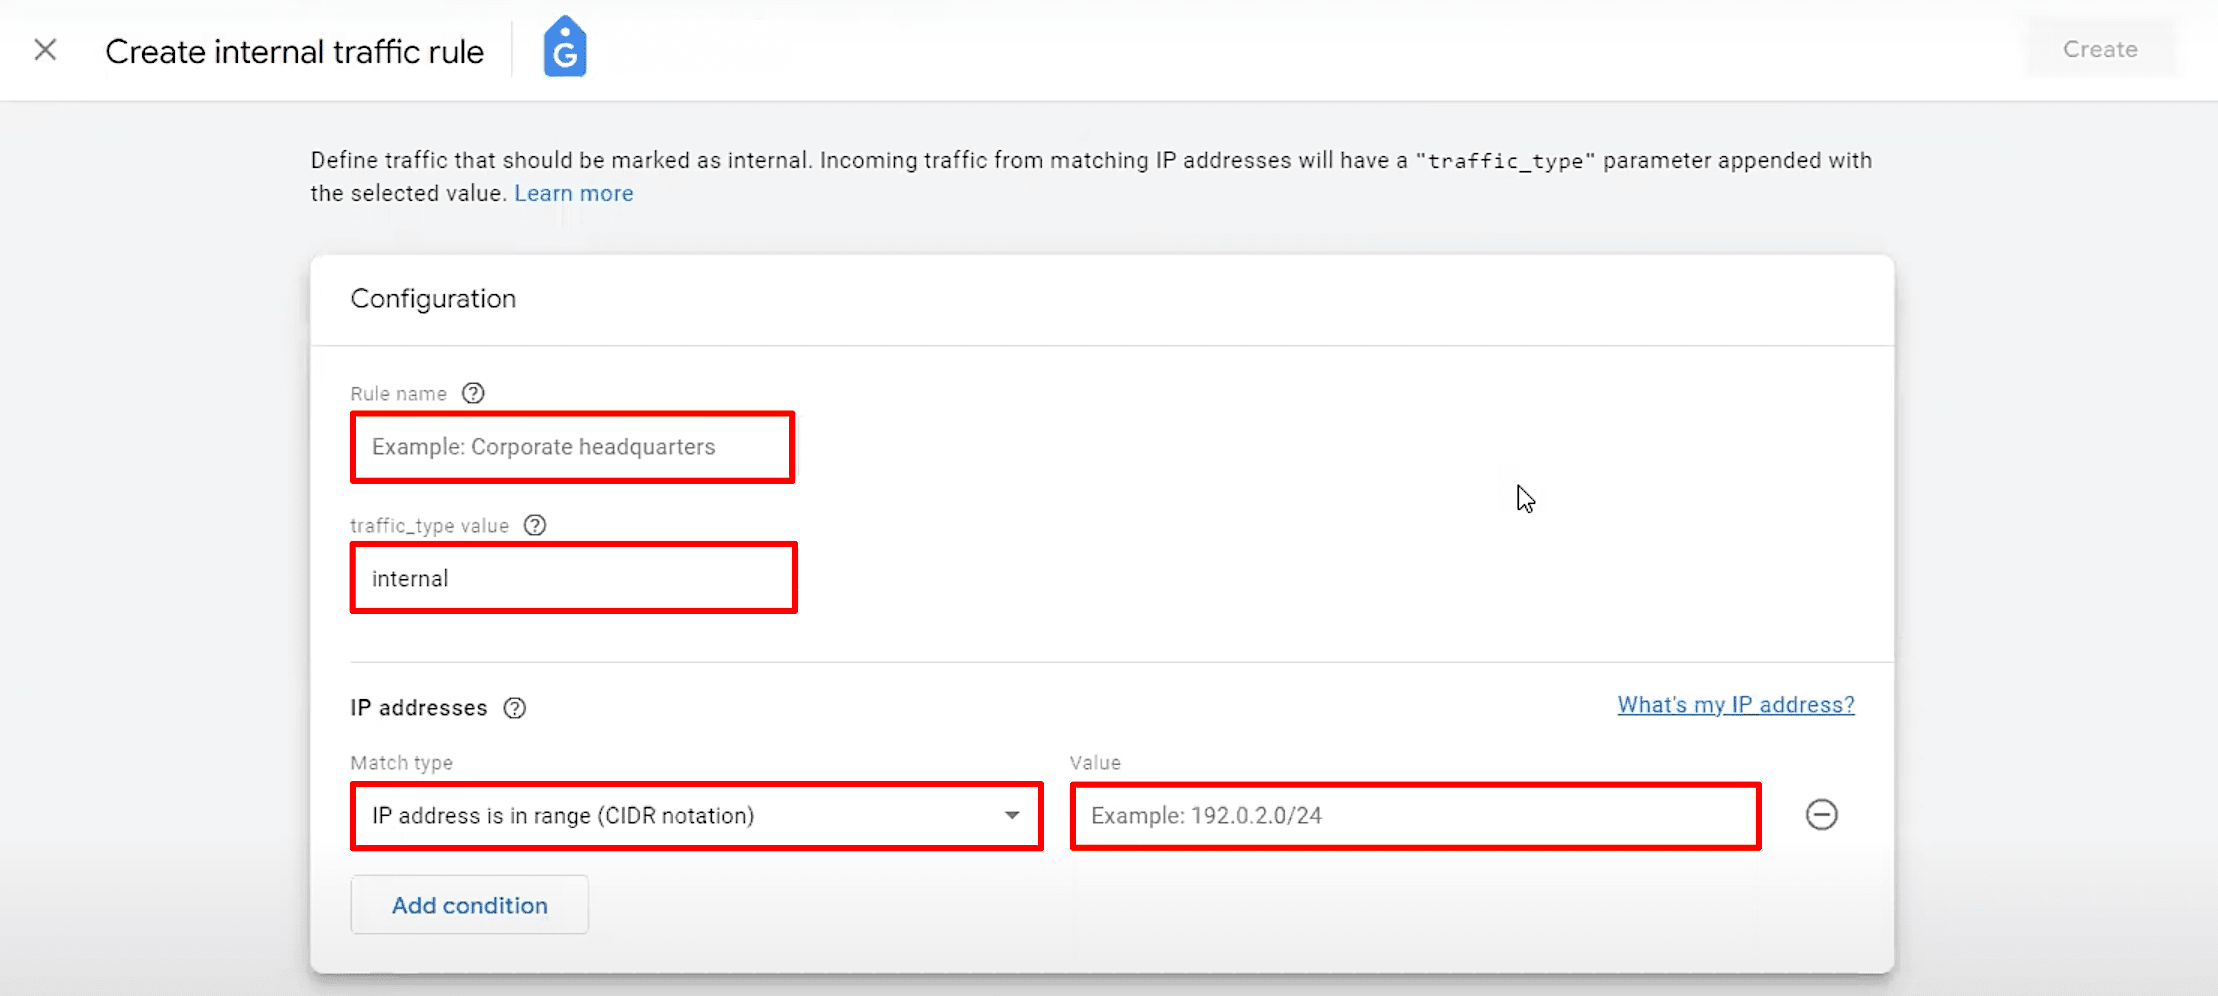
7. Next, under the IP Address block, click on the Match Type and select an operator. Afterward, click Value and enter an address (or range of addresses) that identifies traffic originating from the location you highlighted in the previous step.
Note: You can click What’s my IP address? to find your public IP address. Plus, to set multiple conditions, you can click on the Add Condition button. But keep in mind that your conditions will be considered as OR options rather than AND options.
Now that we’ve identified internal traffic, it needs to be excluded from your reports. Here’s how:
1. Navigate to Admin>Data Collection and Modification>Data Filters.
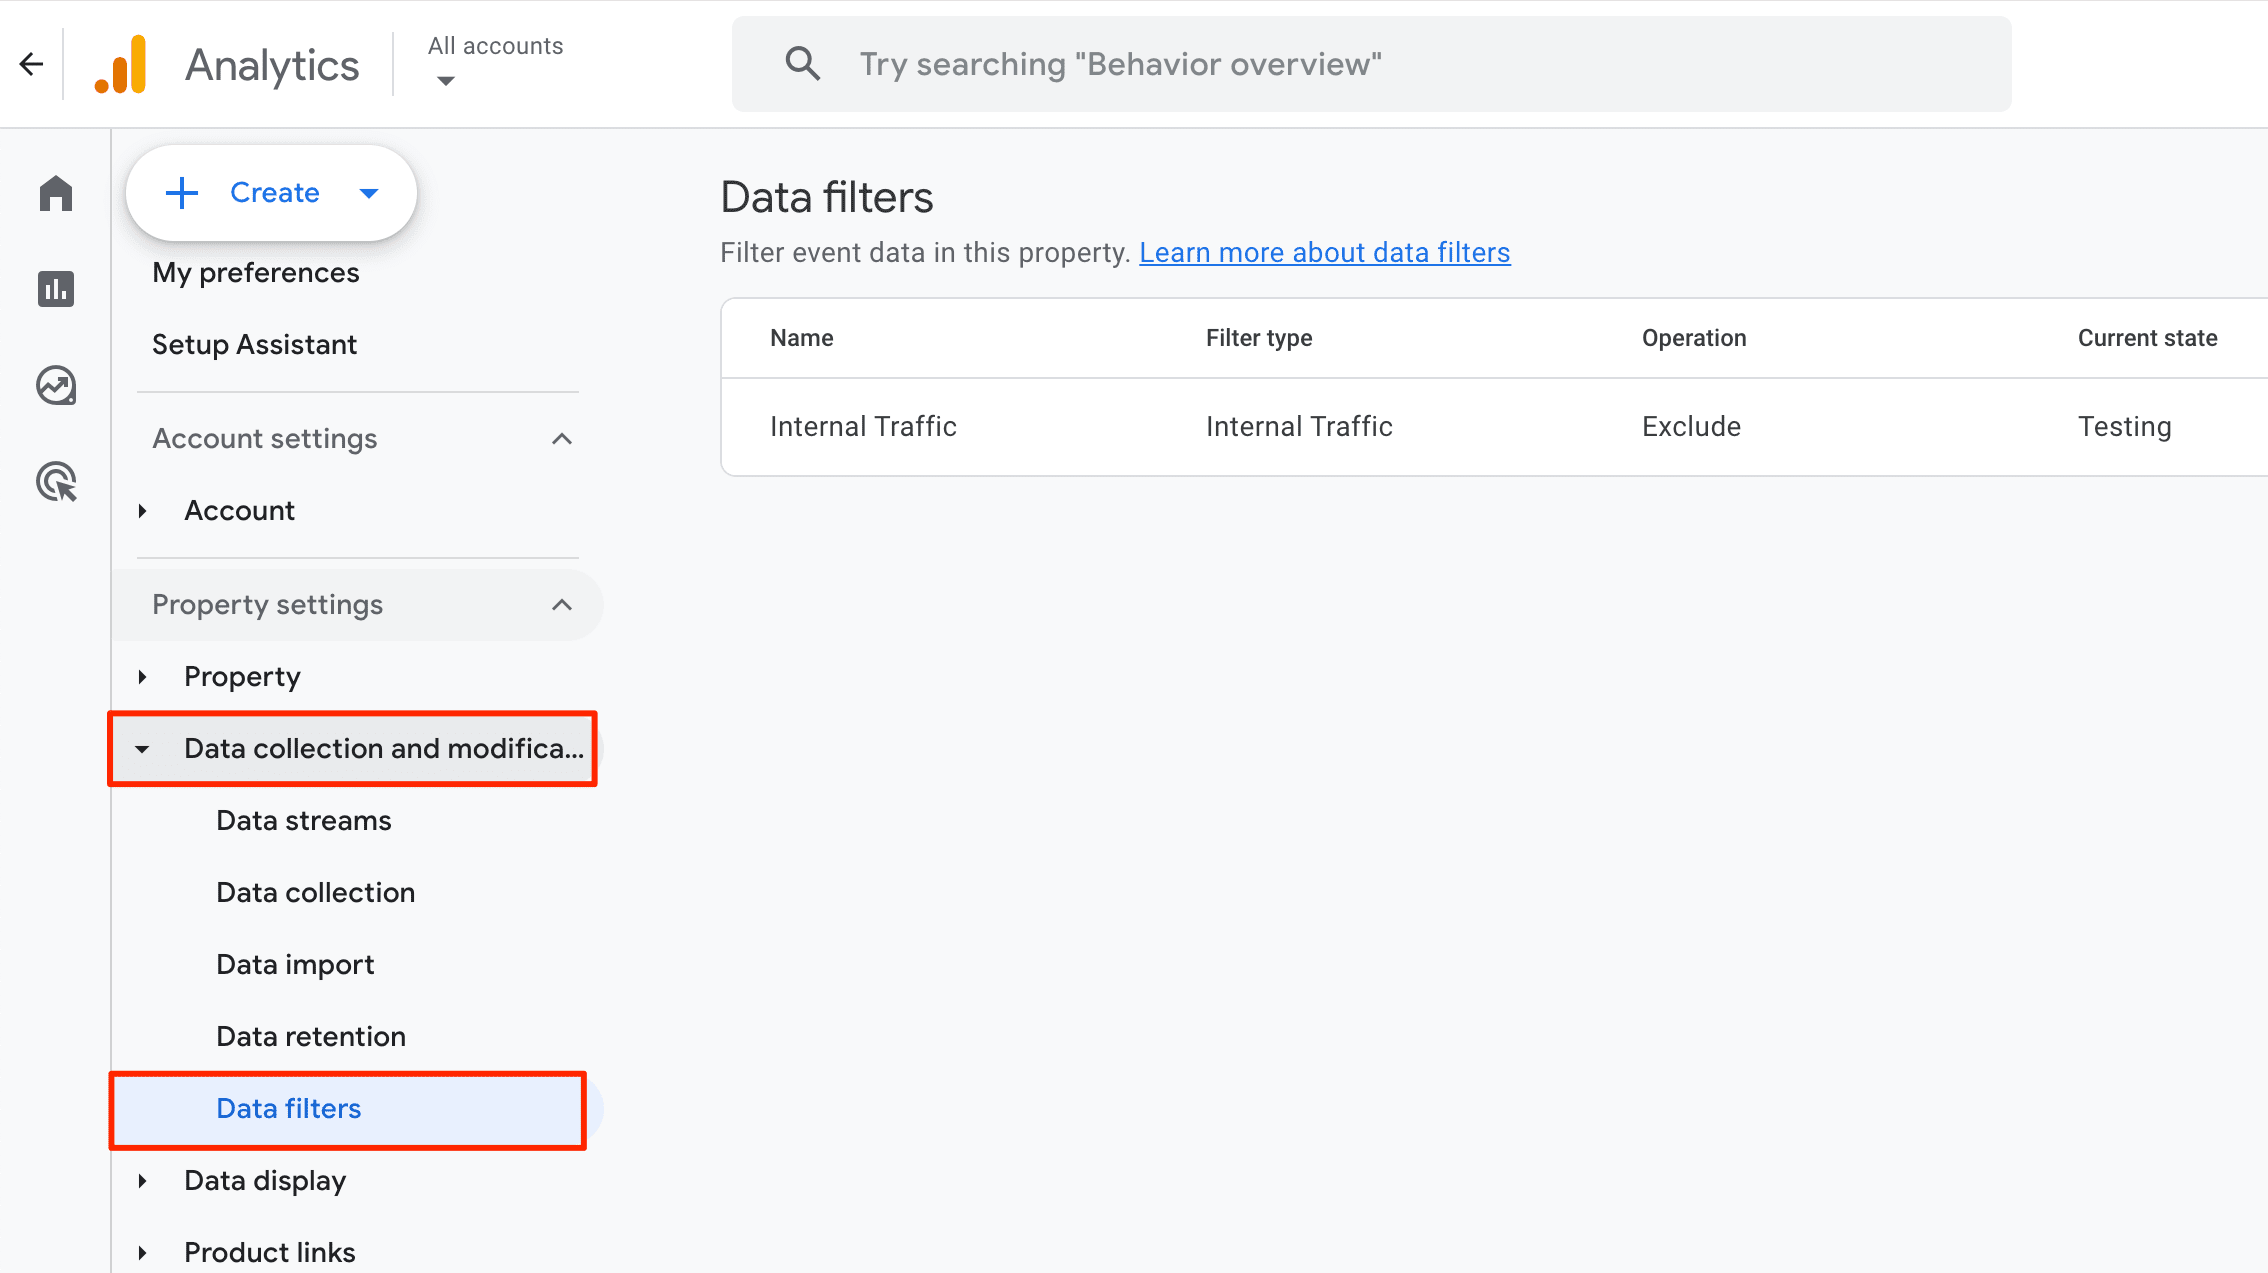
2. Select the Create Filter option.

3. Choose Internal Traffic.

4. Insert a name for the data filter, choose the Exclude option, and enter the traffic_type parameter.
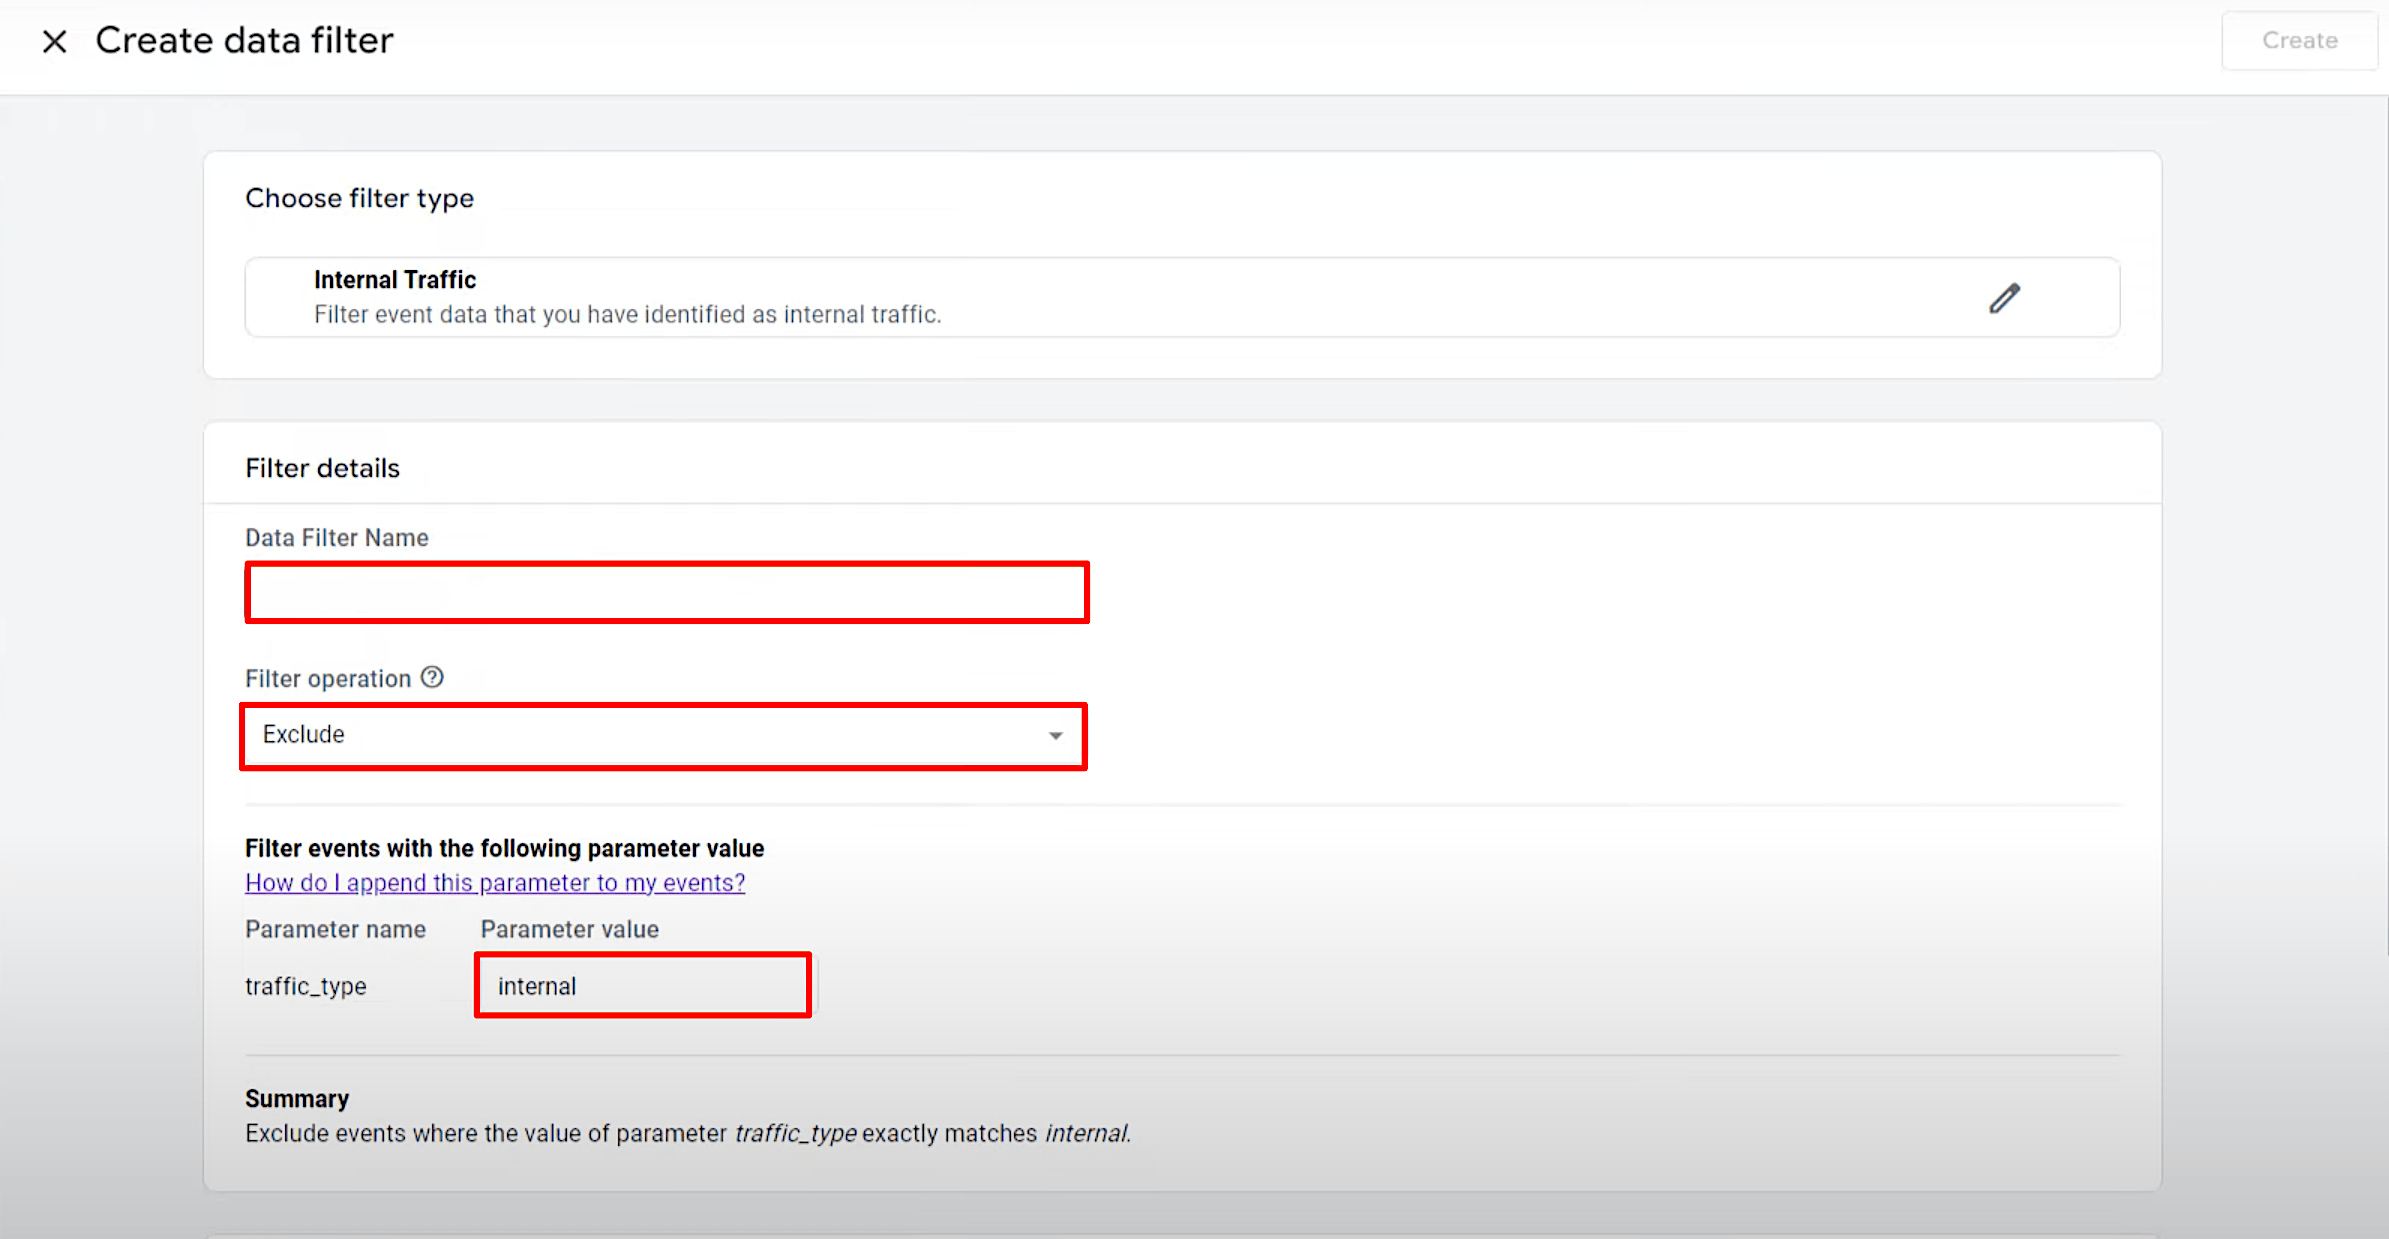
5. Select a specific filter state: Testing, Active, or Inactive.

6. Save implemented changes.
List Unwanted Referrals
GA4 allows you to exclude any domain that you don’t want to see as a referral. Here are some situations where this feature can come in handy:
- Third-party payment processors: If you use any type of payment gateways to allow users to complete payments, add them to your unwanted referral list.
- Website-managed interactions: Let’s say you send a user an email to recover their password. Once they return to your website, GA4 may count them as a referral (which is obviously not true). To prevent this from happening, specify these instances as unwanted referrals.
- Self-referrals: While Google usually successfully detects your domain (and any sub-domains), some experts believe that it helps to add your domain to your unwanted referral list.
Here is what the process of configuring unwanted referrals looks like when using GA4:
1. Under the Admin section, navigate to the Data Collection and Modification tab. Click Data Streams>Web and select your web data stream.

2. Under the Google tag block, click Configure Tag Settings.

3. Click Show More.

4. Click List Unwanted Referrals.
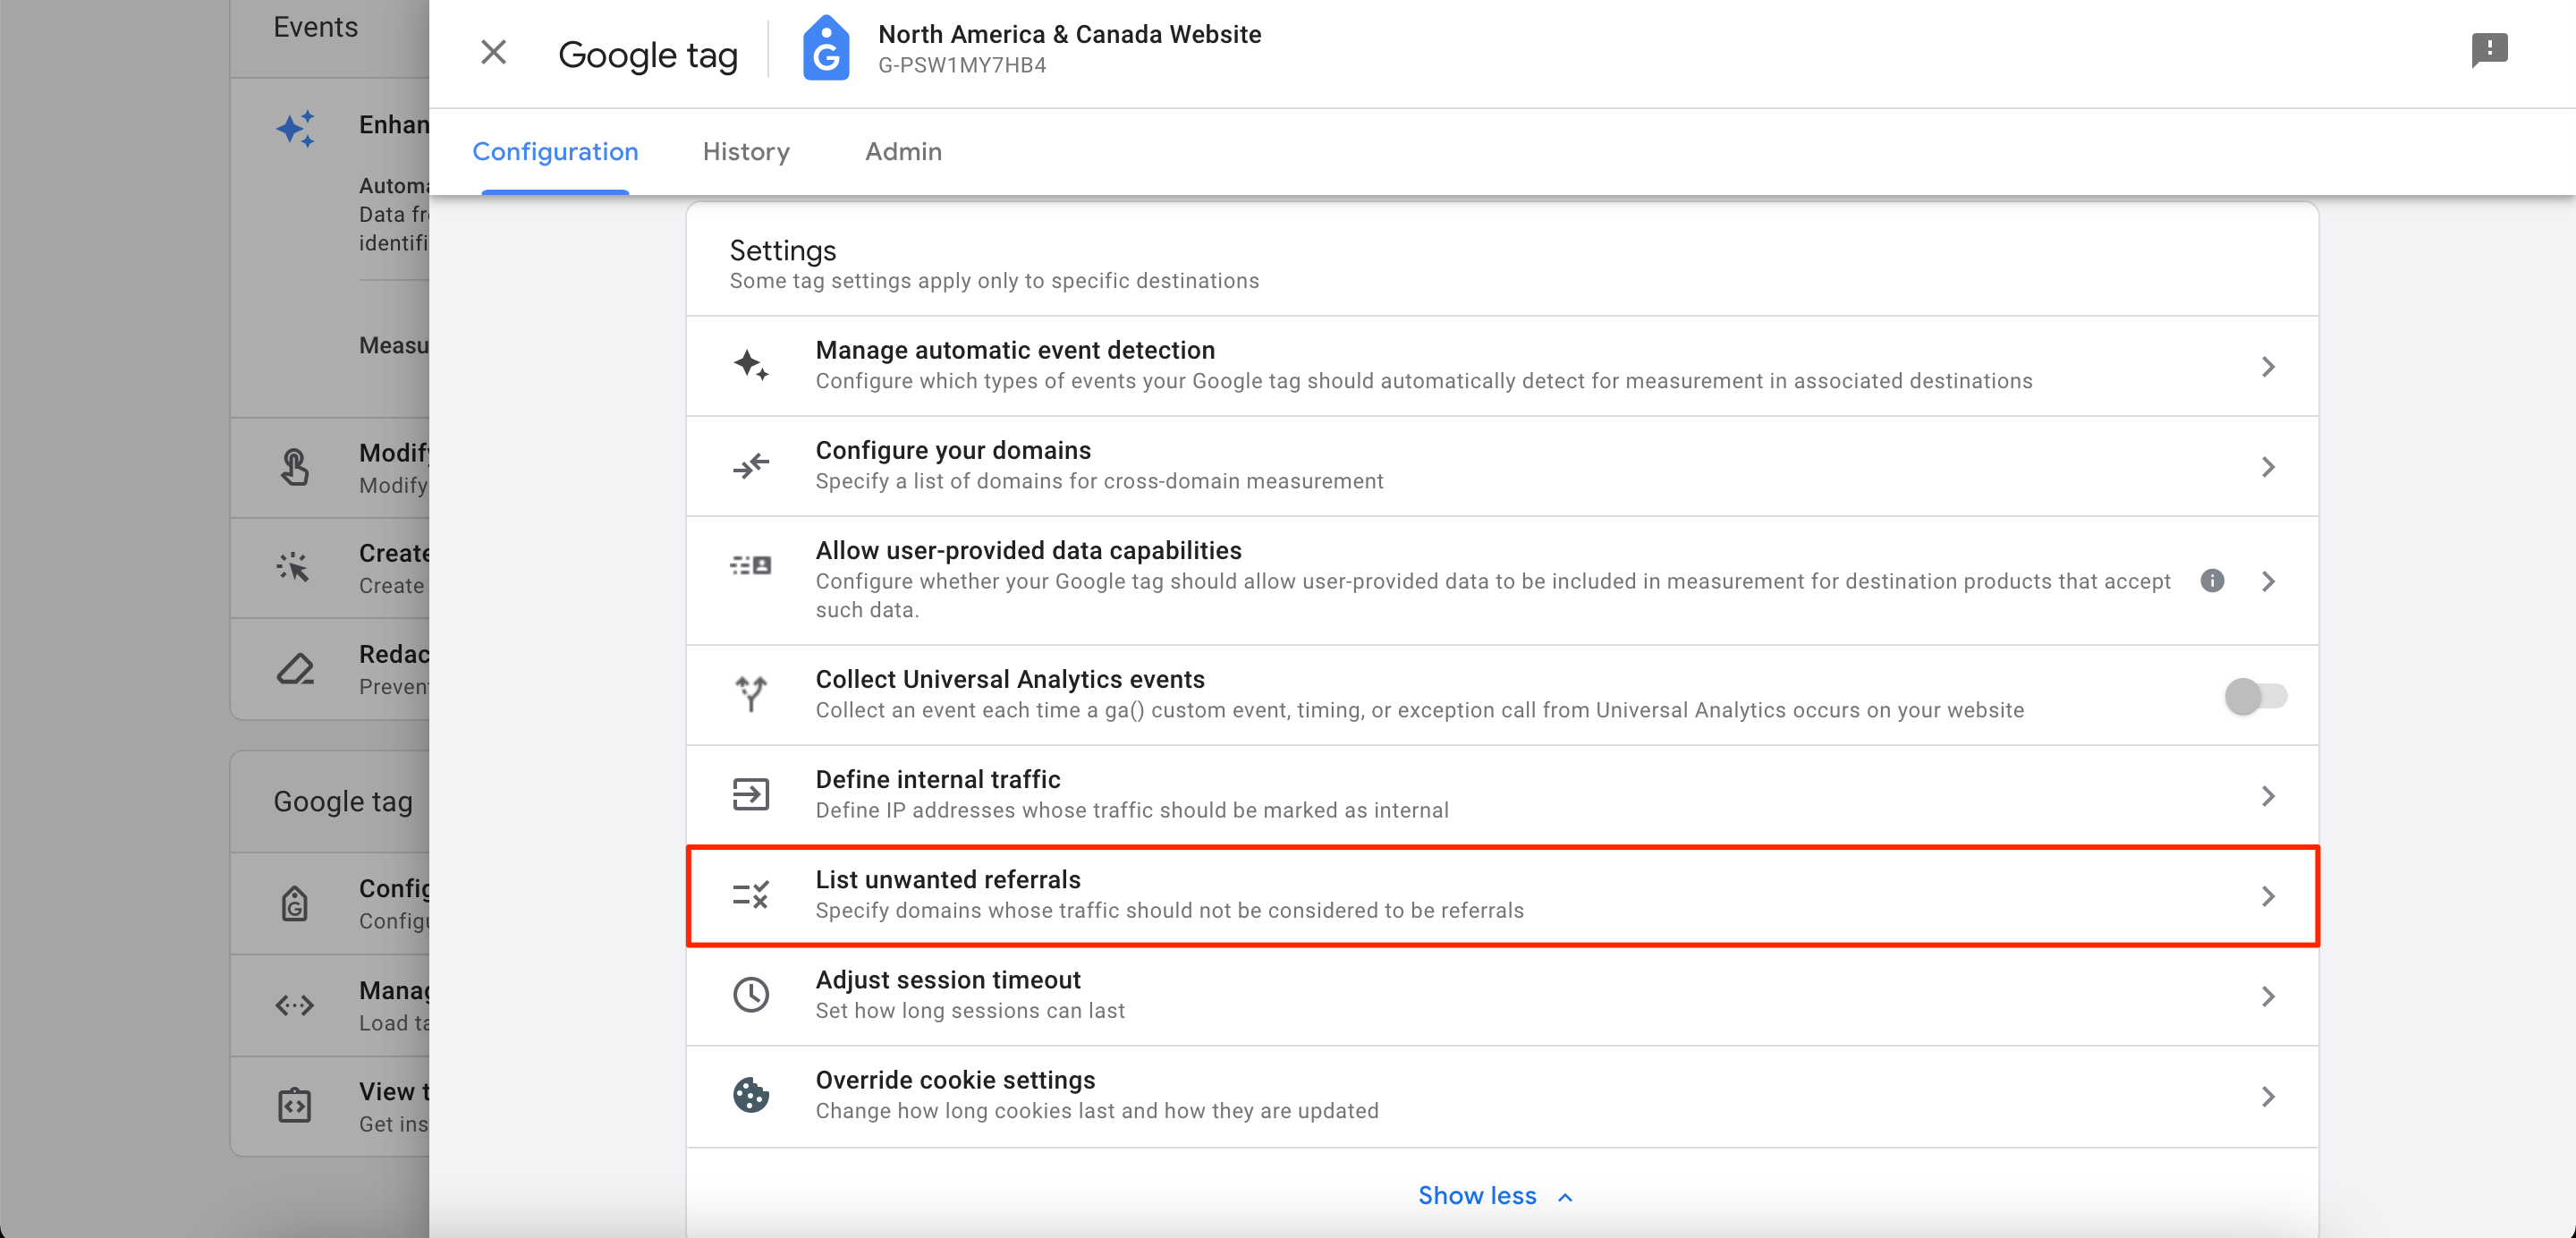
5. Choose a match type and enter the identifier for the domain you want to match. To add more domains, click Add Condition.

Note: You can specify no more than 50 unwanted referrals per data stream. Conditions are evaluated using OR logic.
6. Save implemented changes.
Configure Session Timeout
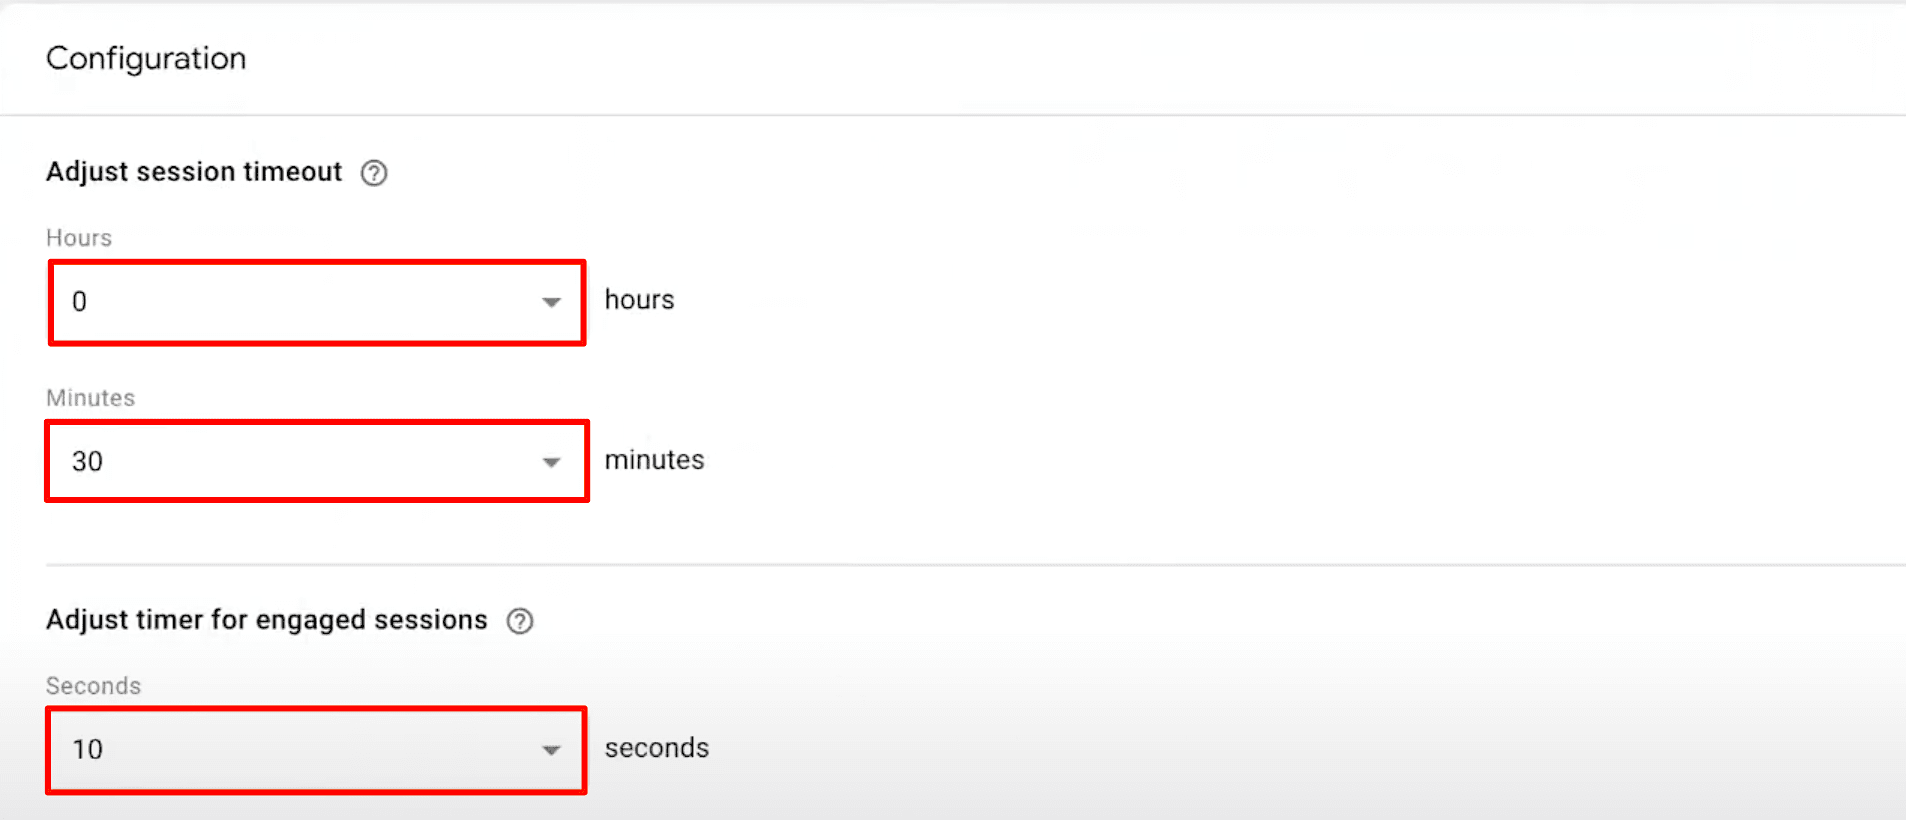
In GA4, the default timeout is considered 30 minutes, but you can adjust it if needed. For ecommerce, this might be useful whenever users take longer to take actions like browsing, selecting products, and completing transactions.
Follow these steps to change the default session timeout:
1. Under the Admin section, navigate to the Data Collection and Modification tab. Click Data Streams>Web and select your web data stream.

2. Under the Google tag block, click Configure Tag Settings.

3. Click Show More.

4. Select the Adjust Session Timeout option.
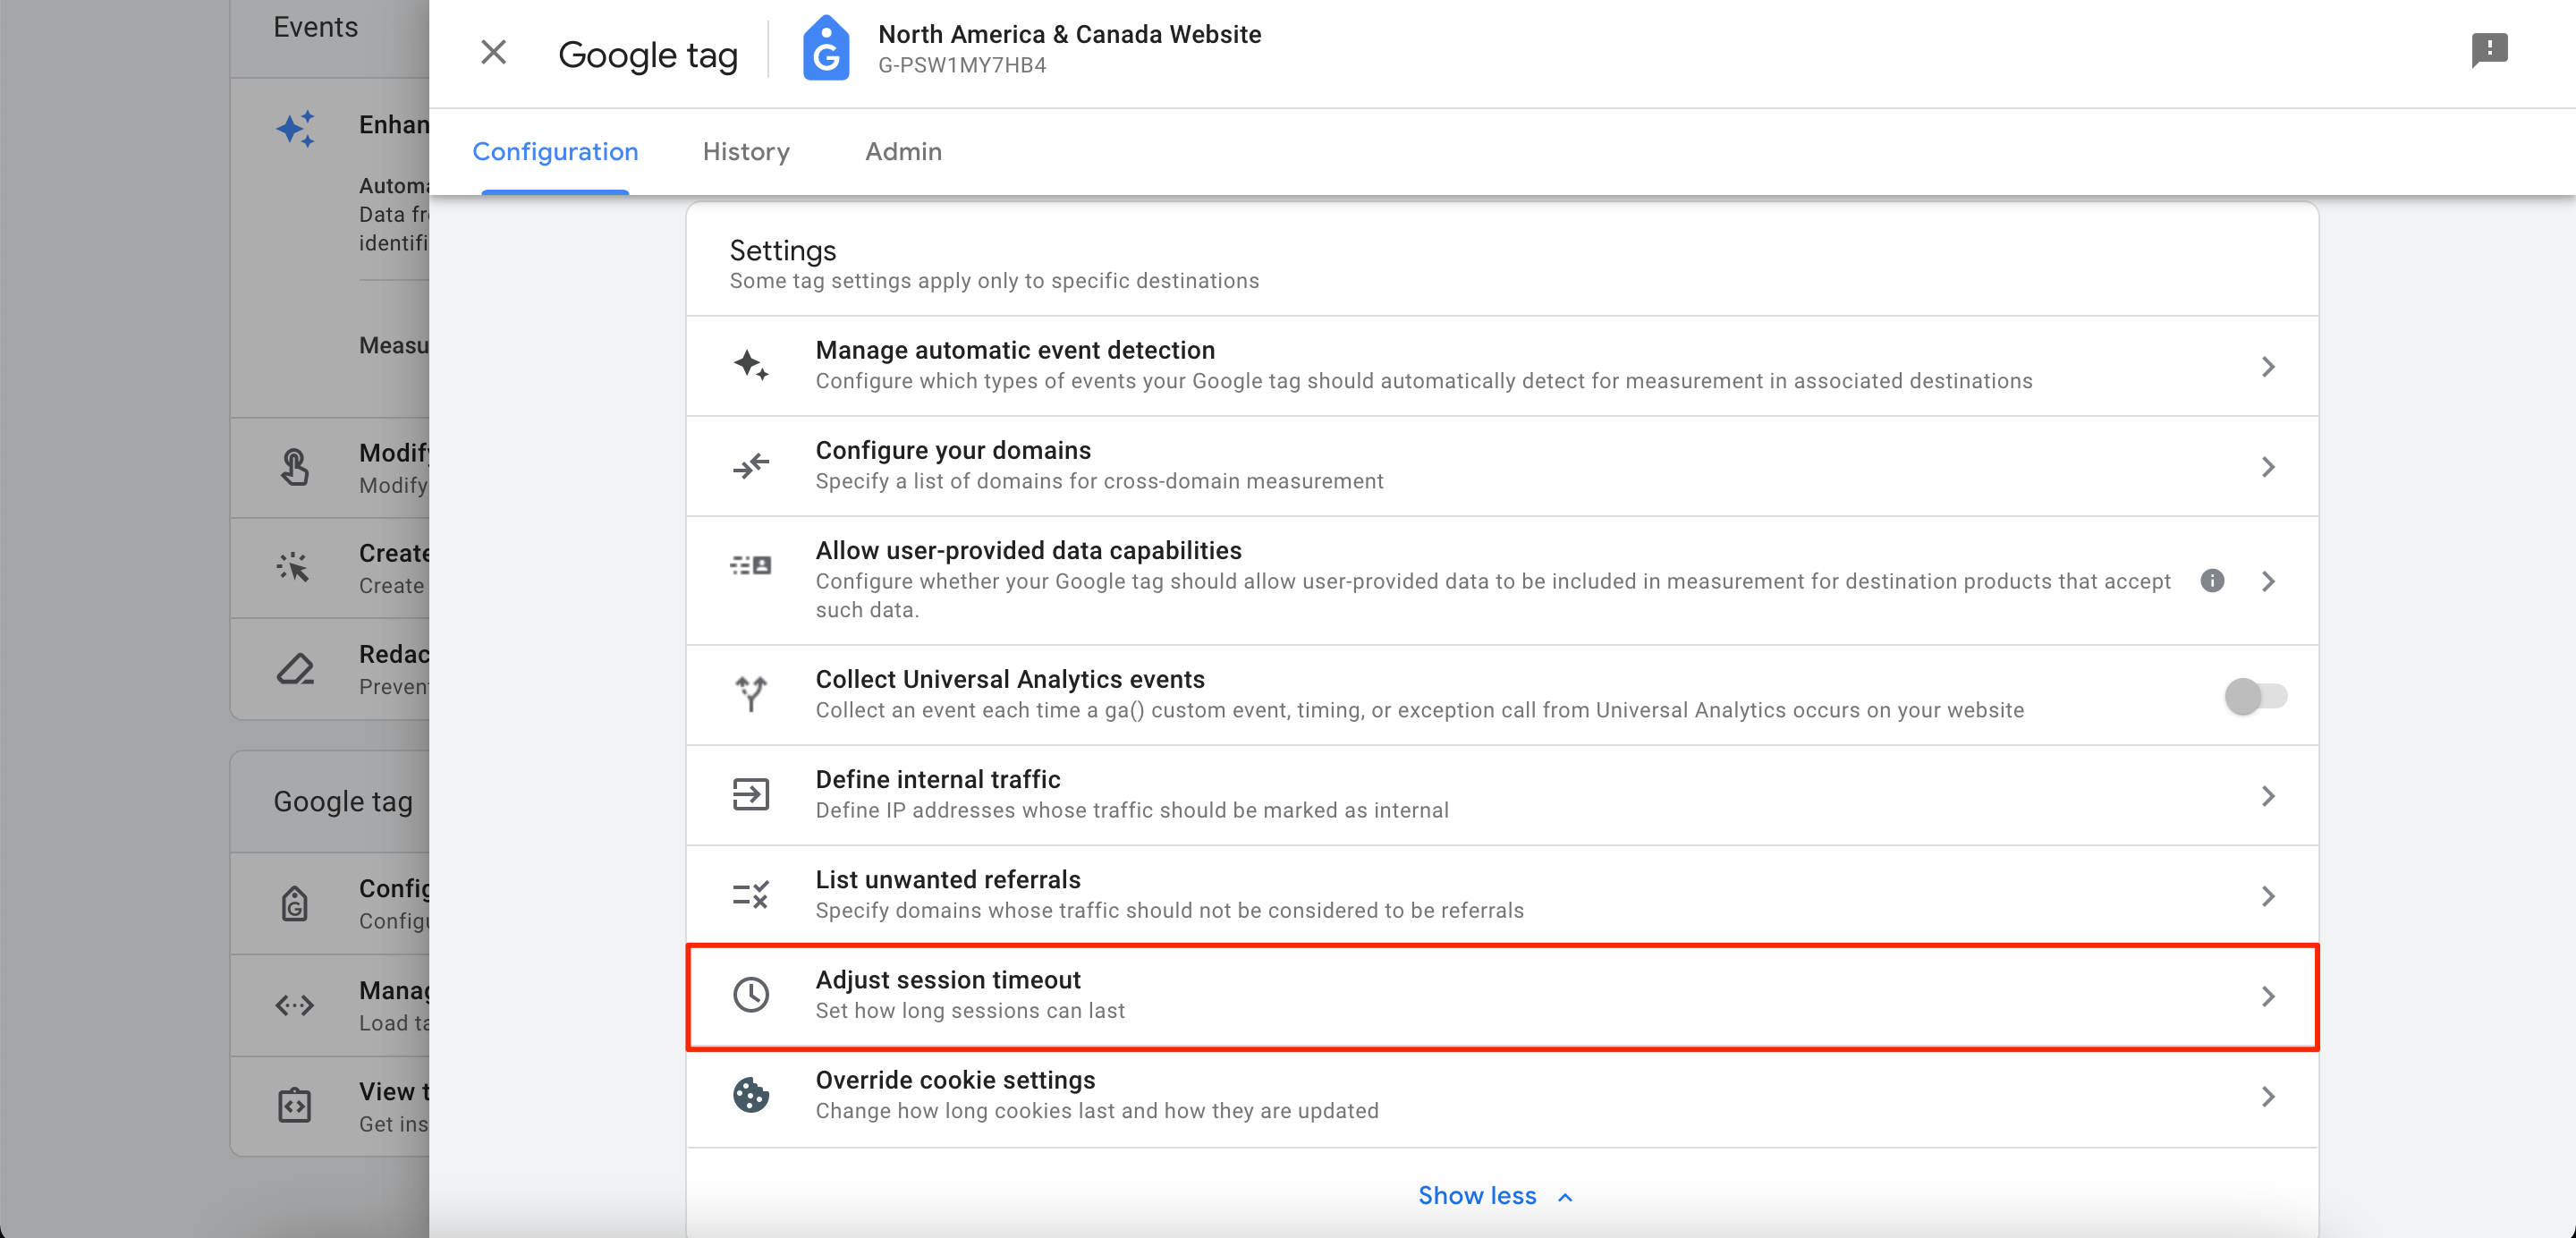
5. Configure the settings to your liking and save all implemented changes.
GA4 Ecommerce Reports in Detail
Here comes one of the most interesting parts of the GA4 ecommerce guide. Let’s take a closer look at the tool’s built-in reports designed specifically for ecommerce purposes.
New Standard Reports
If you have already used UA, you probably remember its standard reports, which were divided into four main categories: audience, acquisitions, behavior, and conversions. Now, all standard reports offered by GA4 fall into one of the following groups:
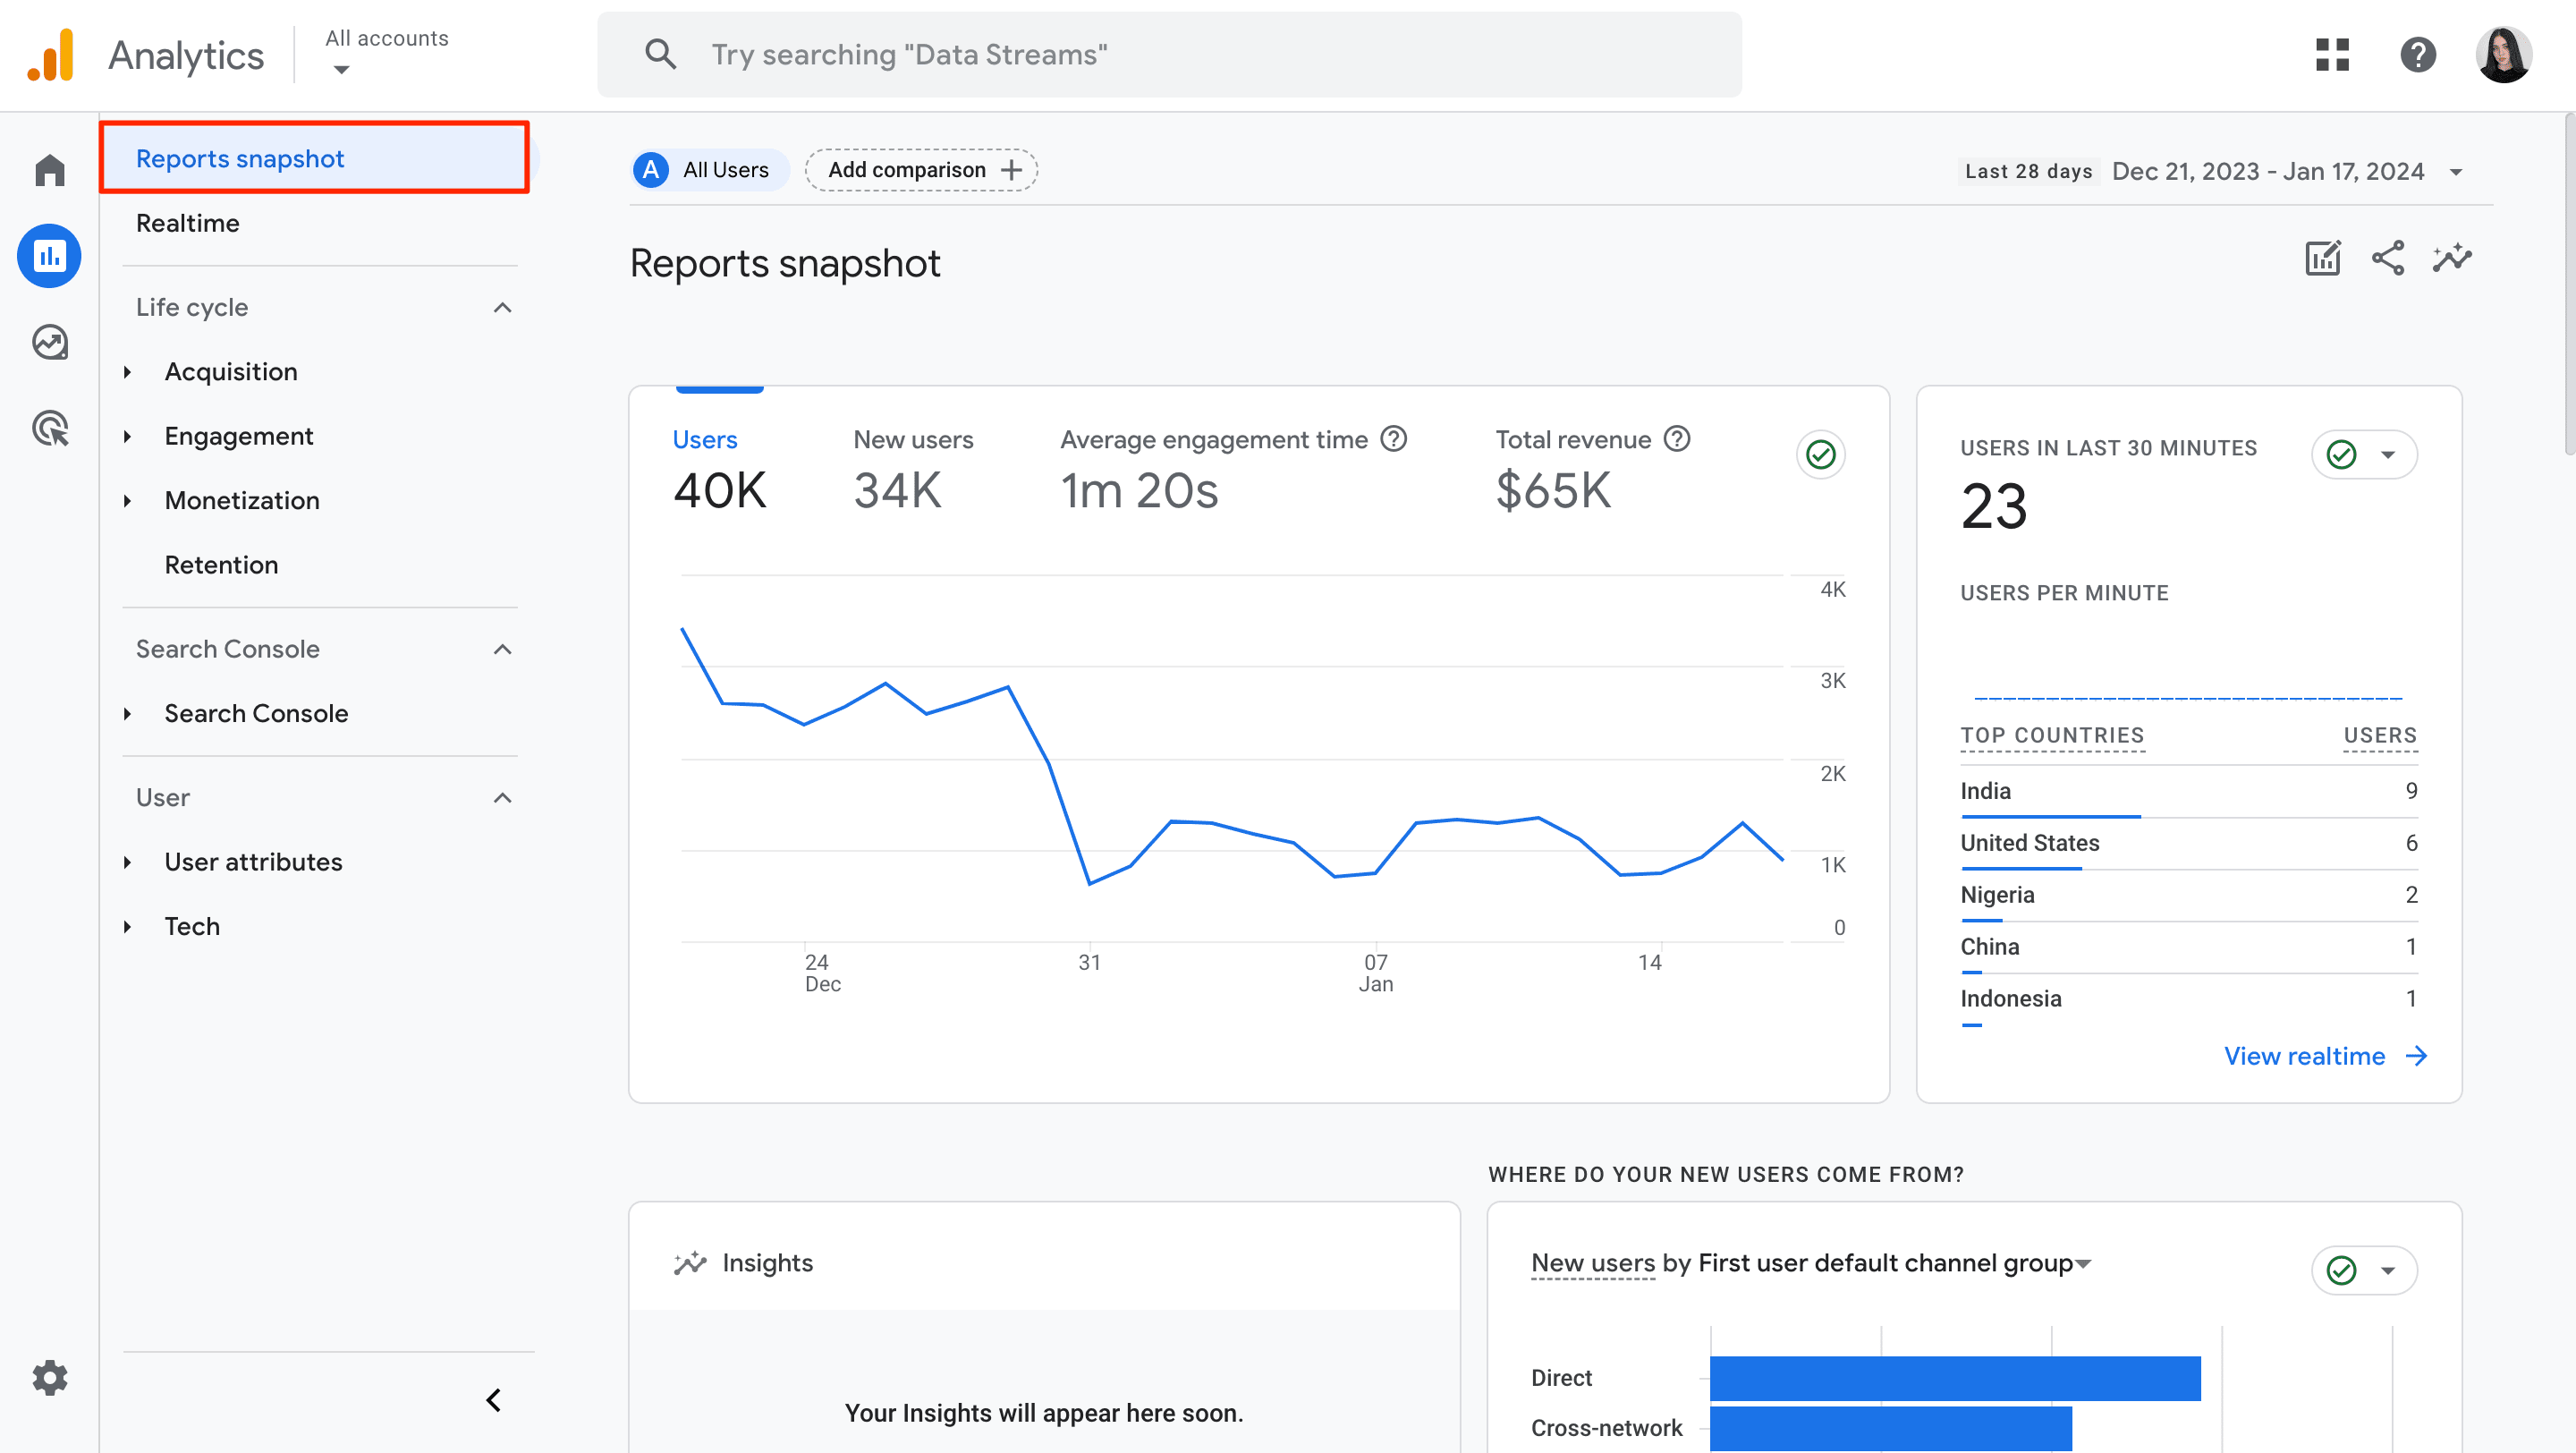
1. Reports snapshot
This block provides a diverse collection of reports, all arranged in the form of widgets. Here, you can get a quick overview of your website traffic without going too deep into the details.
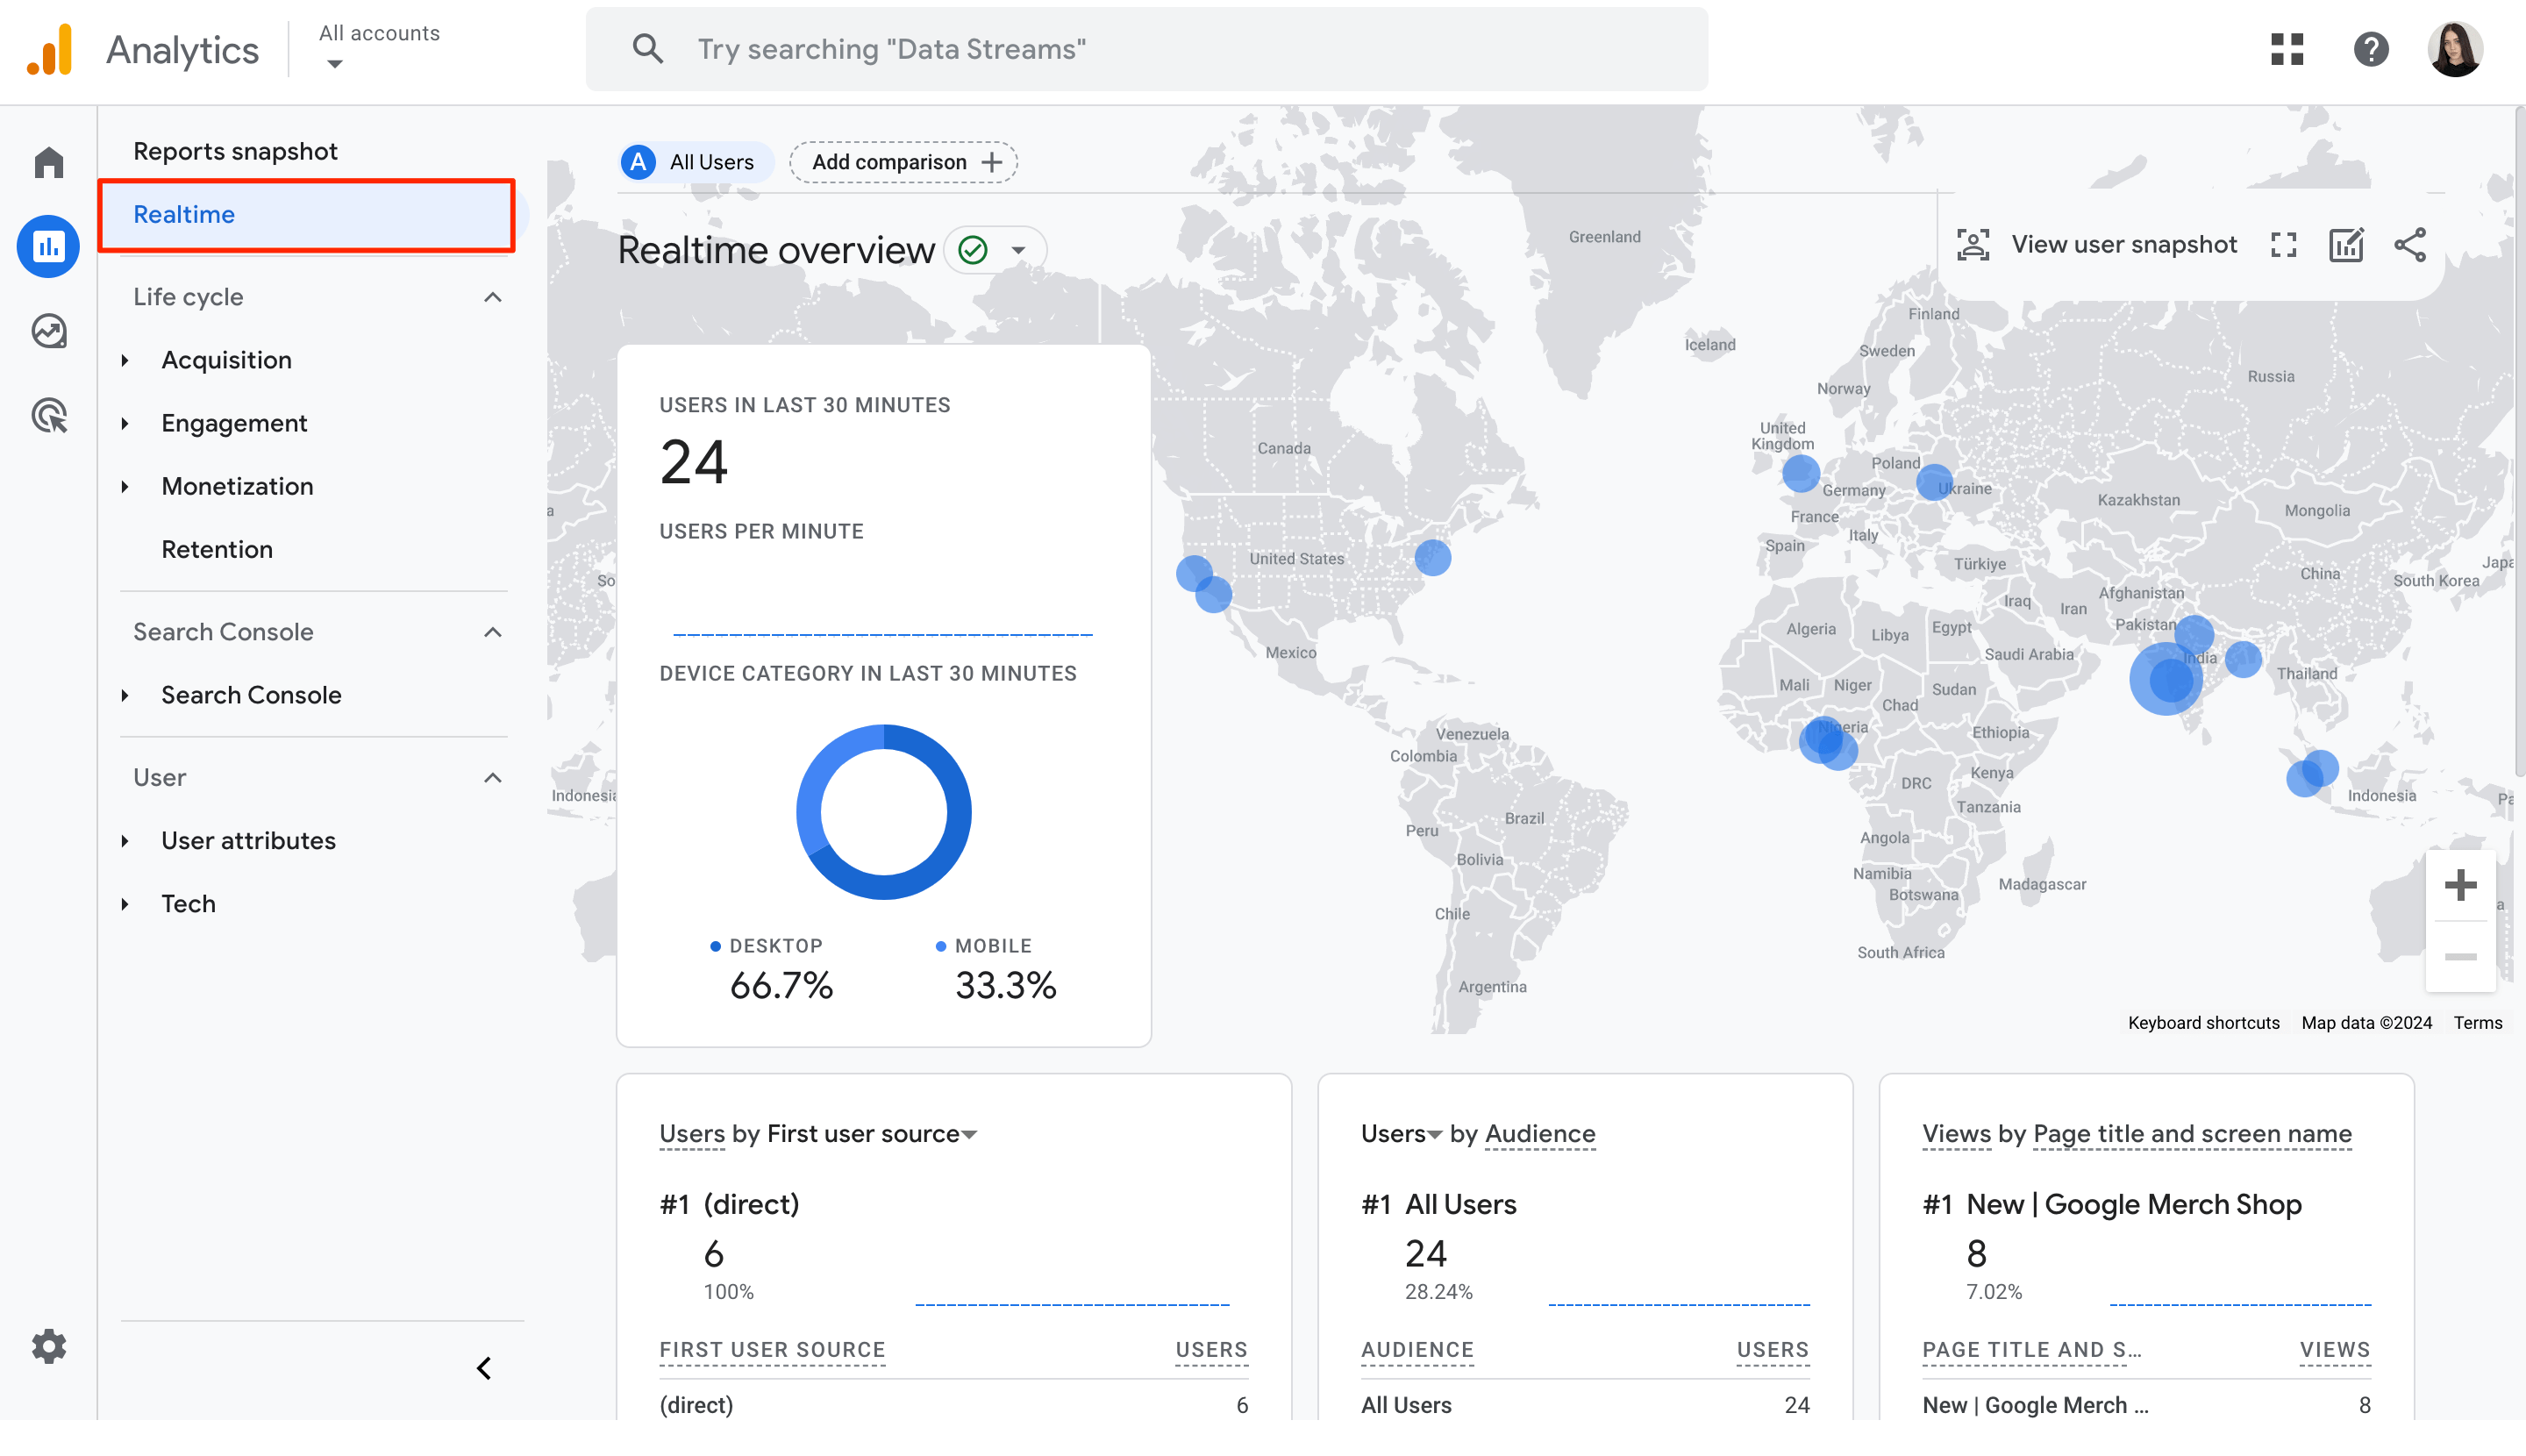
2. Realtime report
This report dives into real-time data (over the last 30 minutes) and includes details like user count, device category, traffic source, page views, conversions, and more. More specifically, you can compare custom segment comparisons and real-time performance side-by-side. Plus, this block gives you a snapshot of the events performed by users (in chronological order).
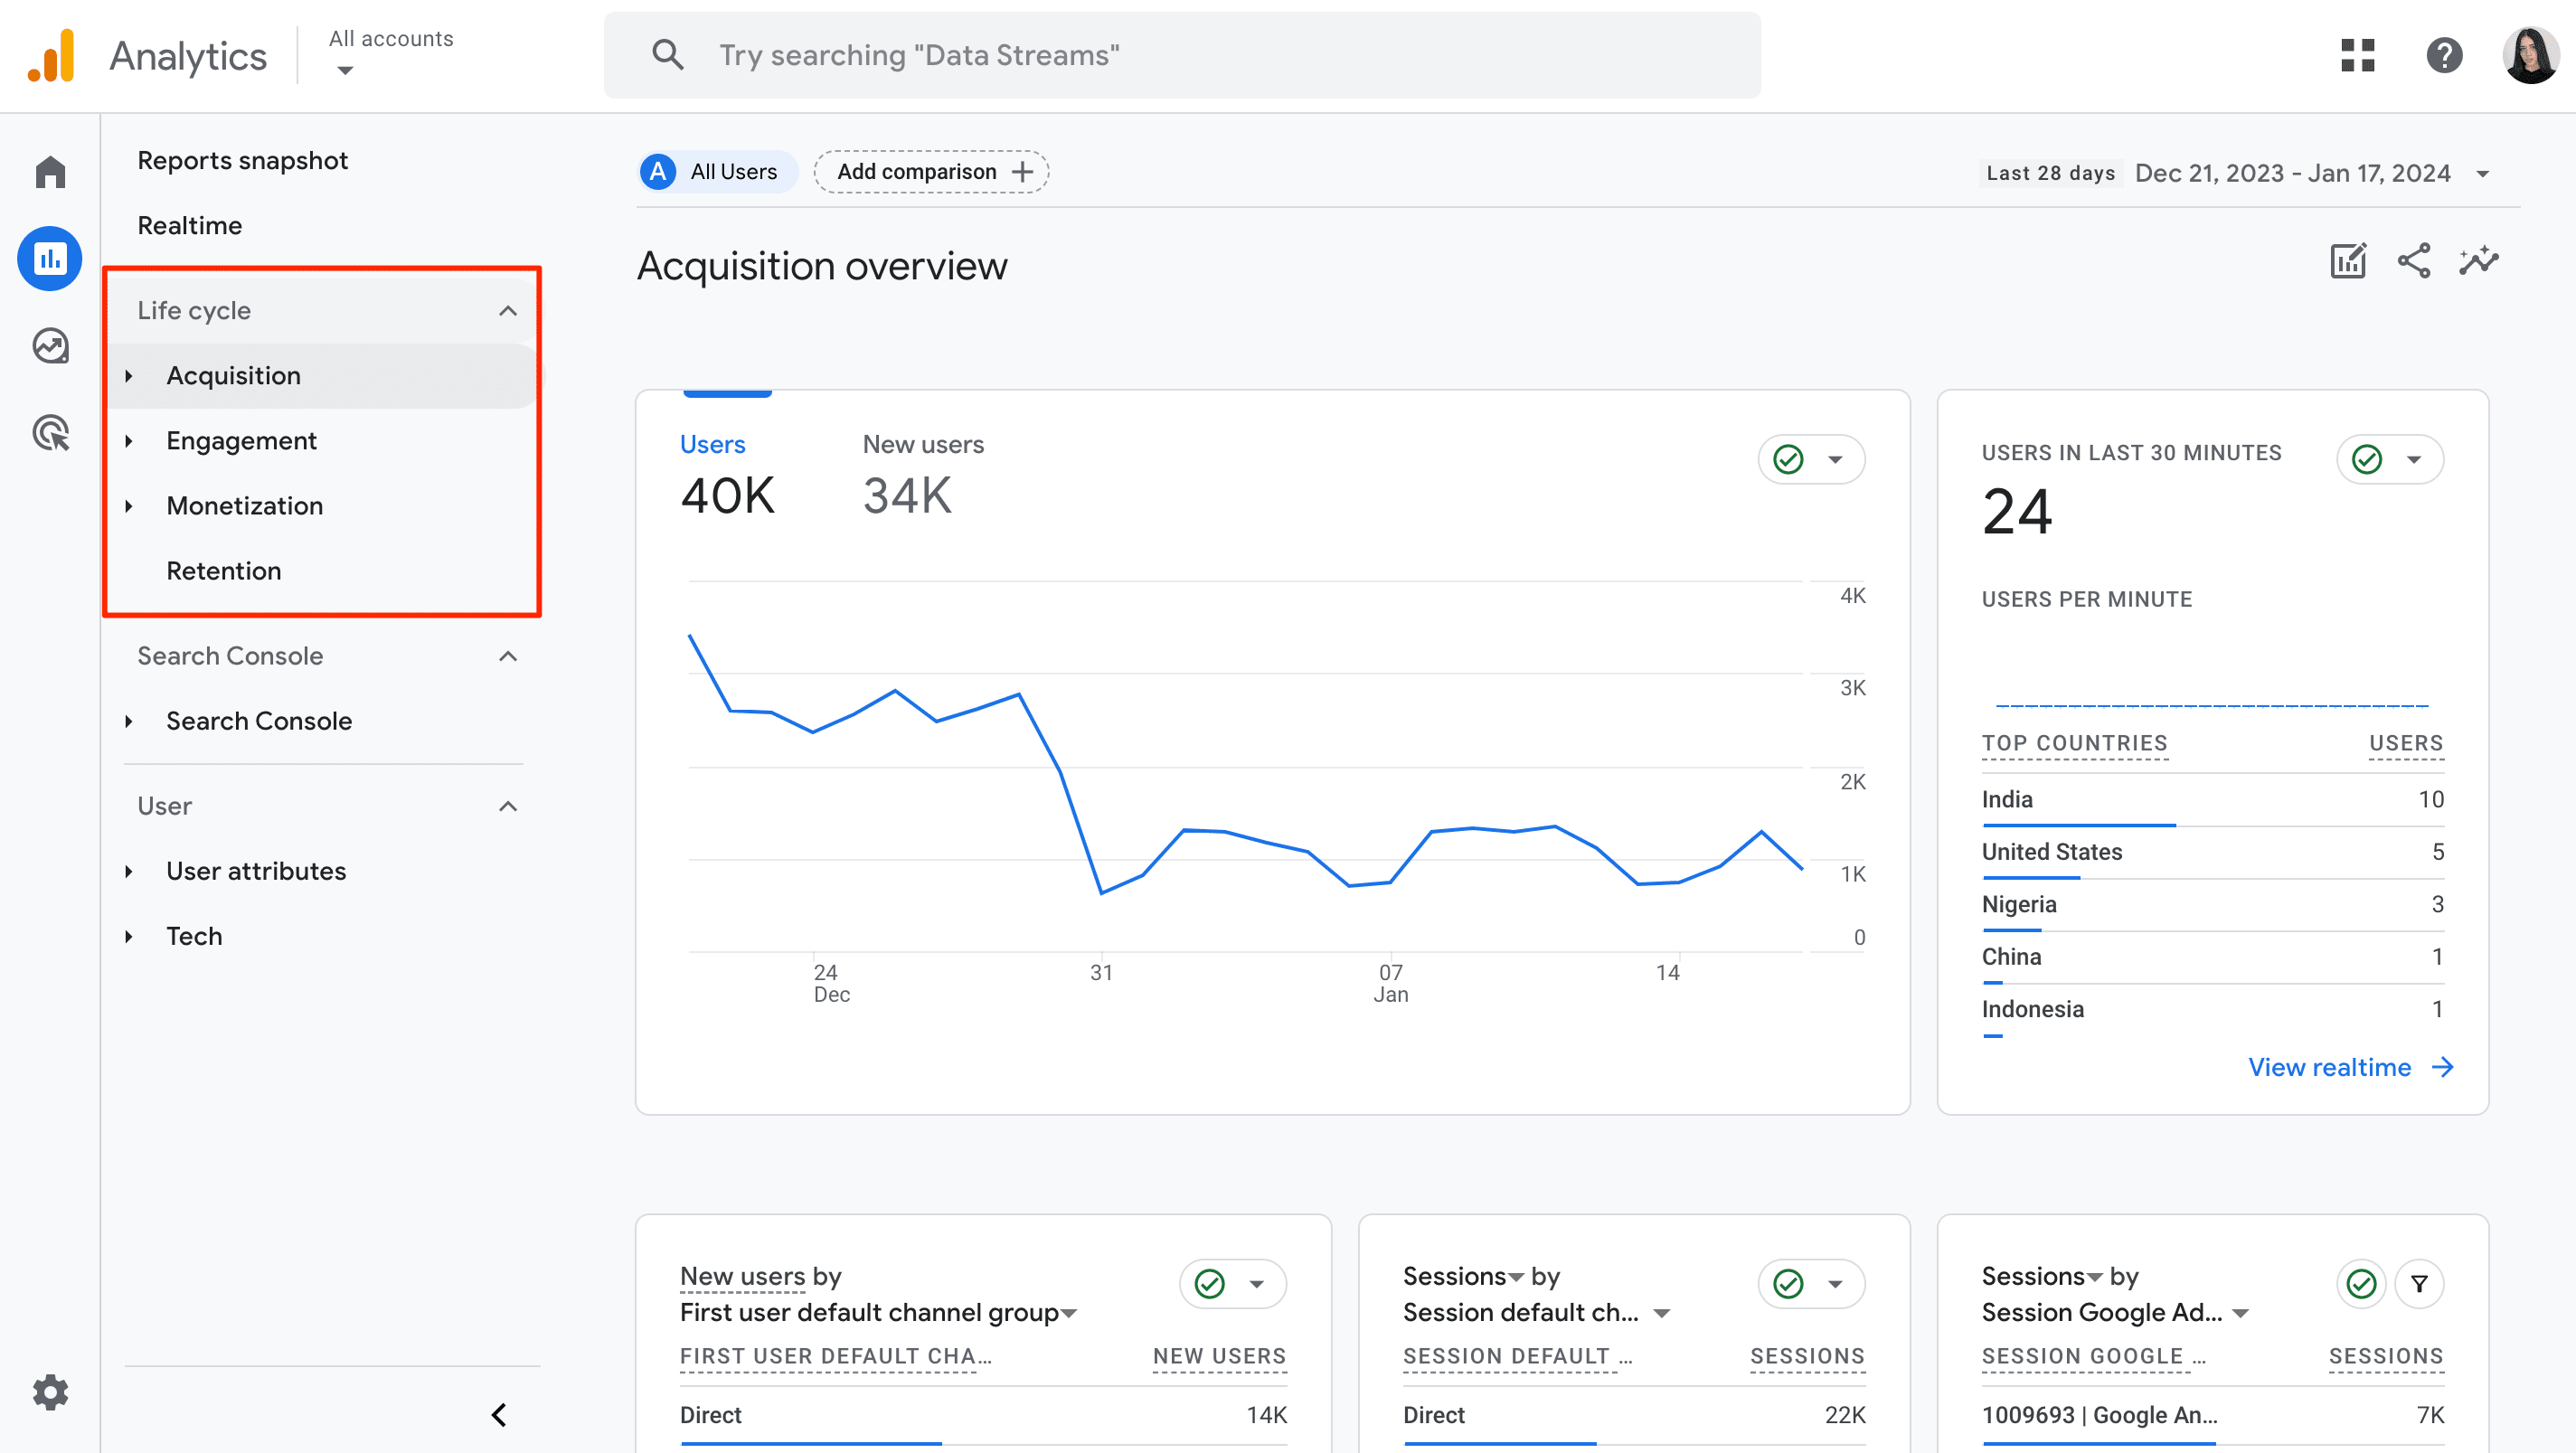
3. Life cycle reports
This set of reports is one of the most heavily monitored in GA4. These reports are divided into categories like Acquisition, Engagement, Monetization, and Retention. Analyzing the data from these reports gives you an understanding of all the intricacies of a user’s journey on a website. It also helps you categorize their interactions into different stages of the user lifecycle.
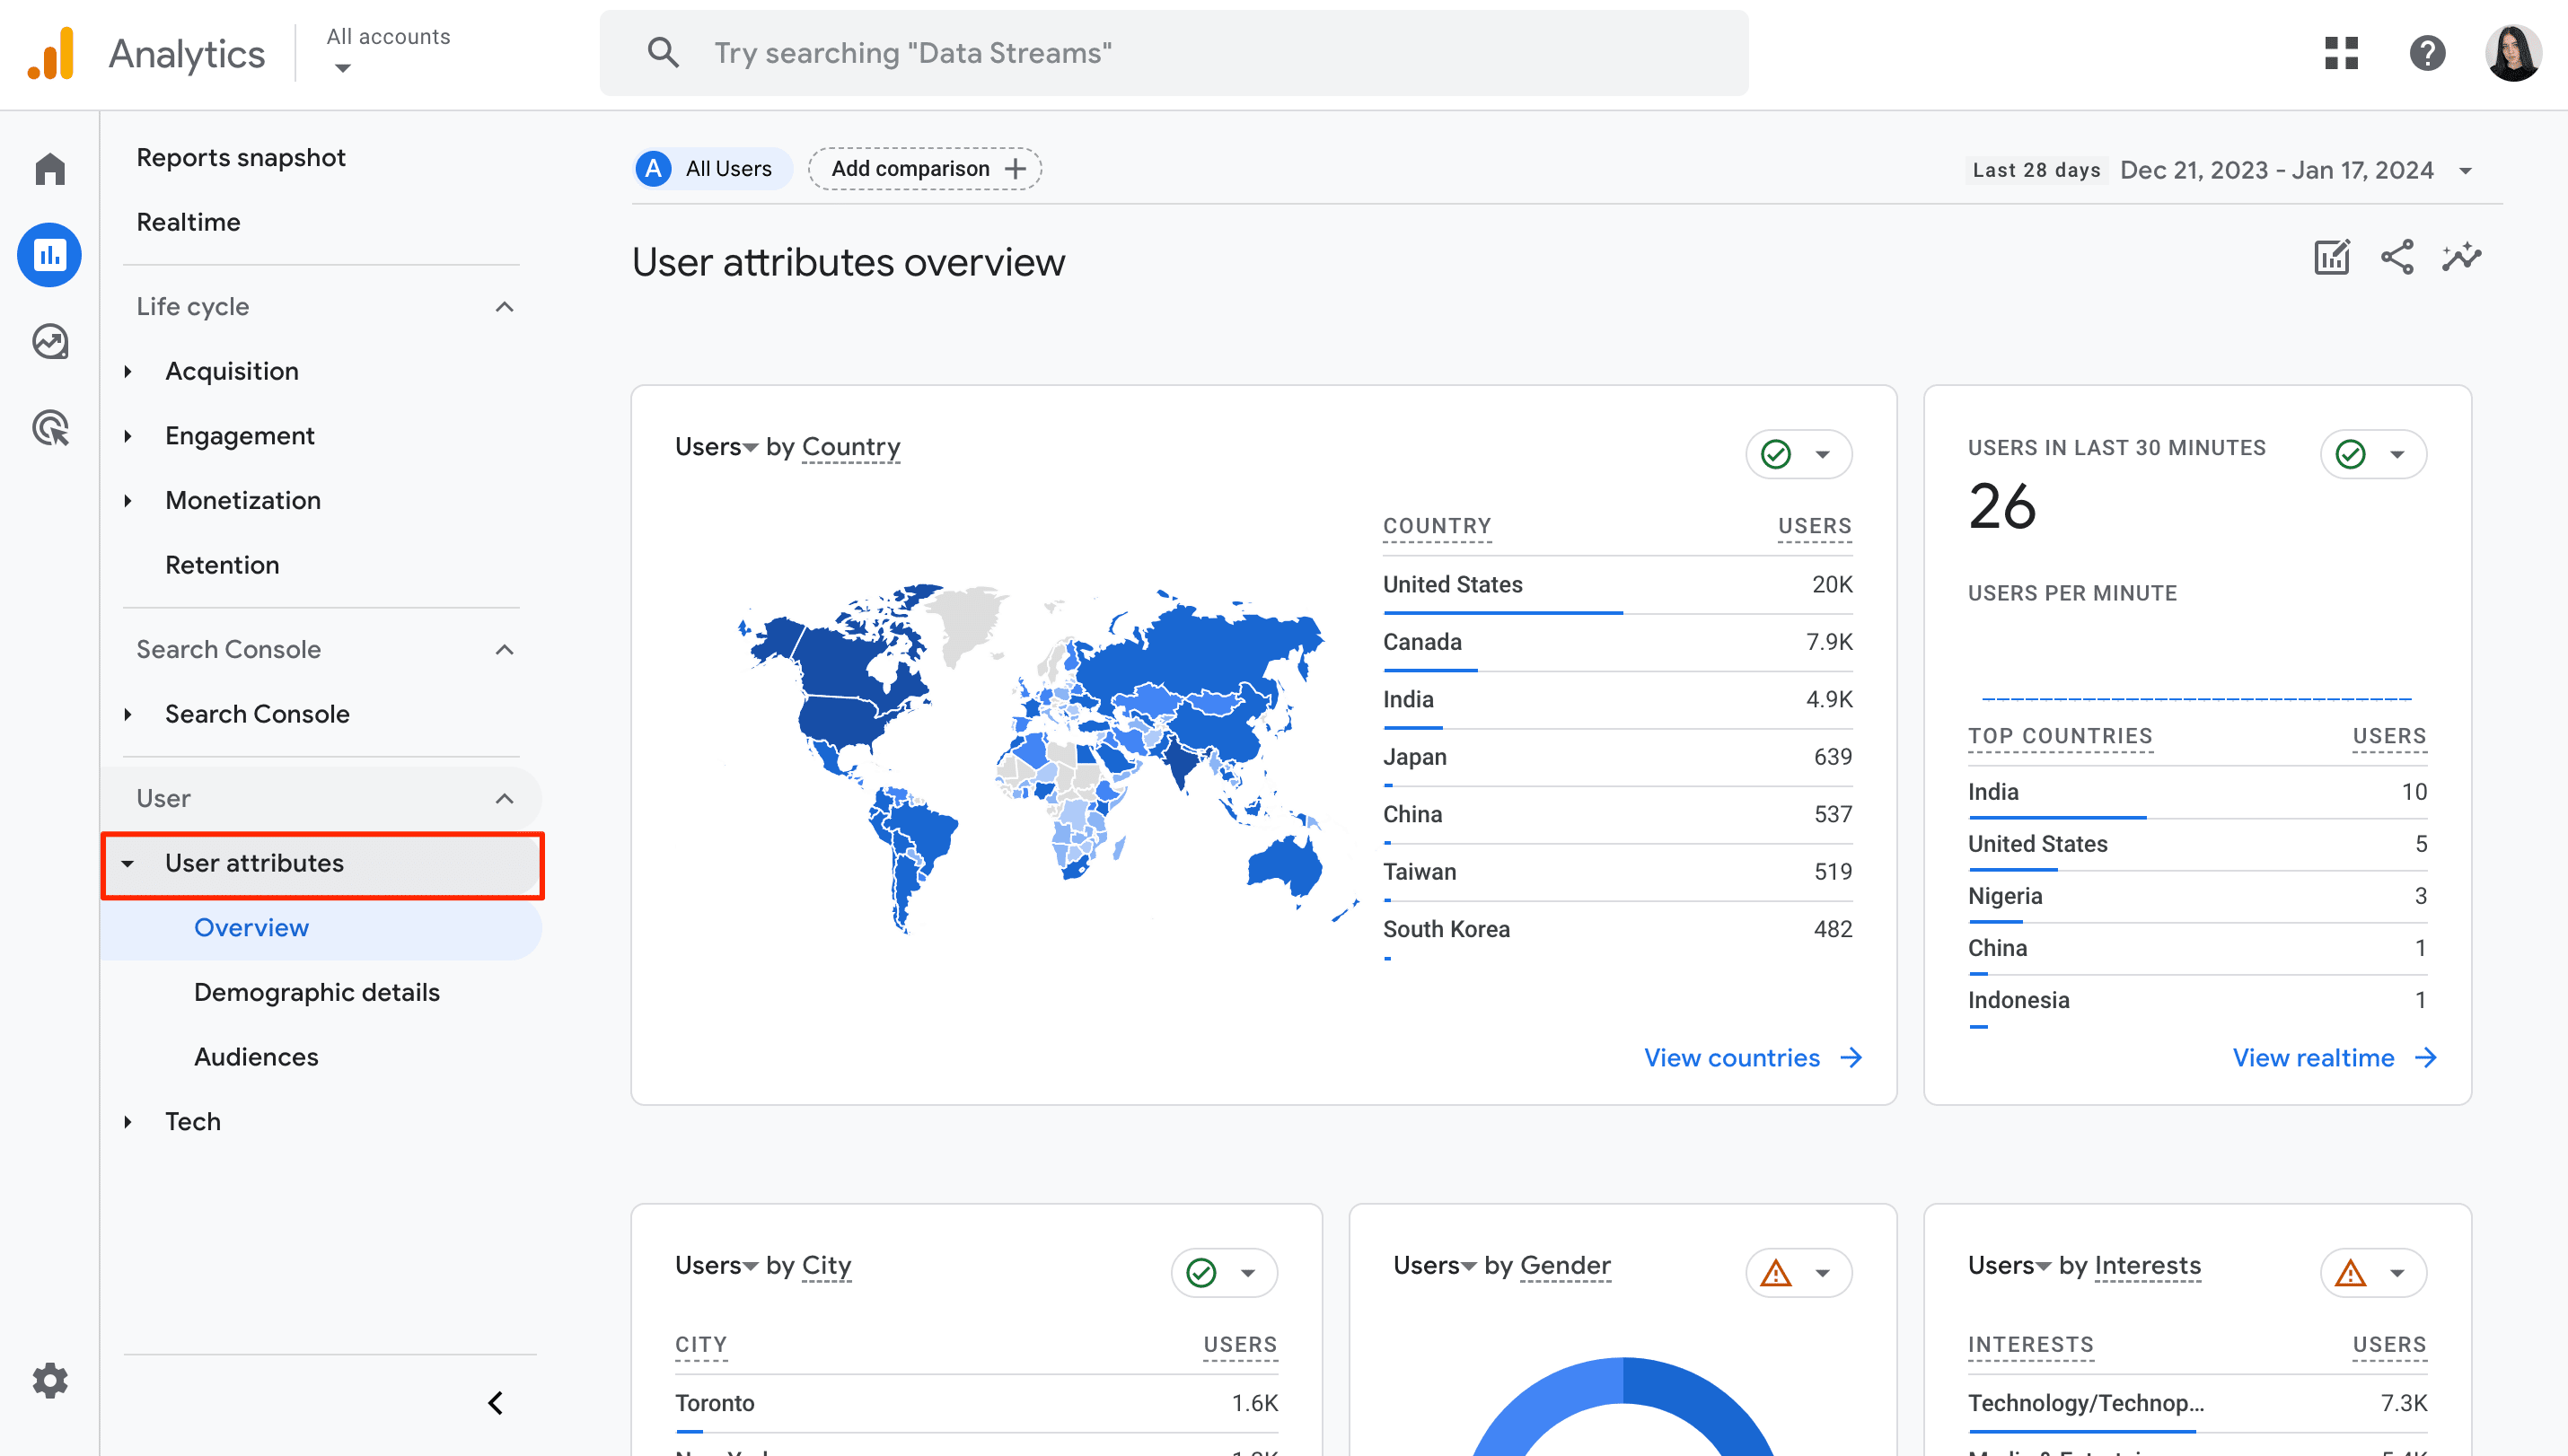
4. User reports
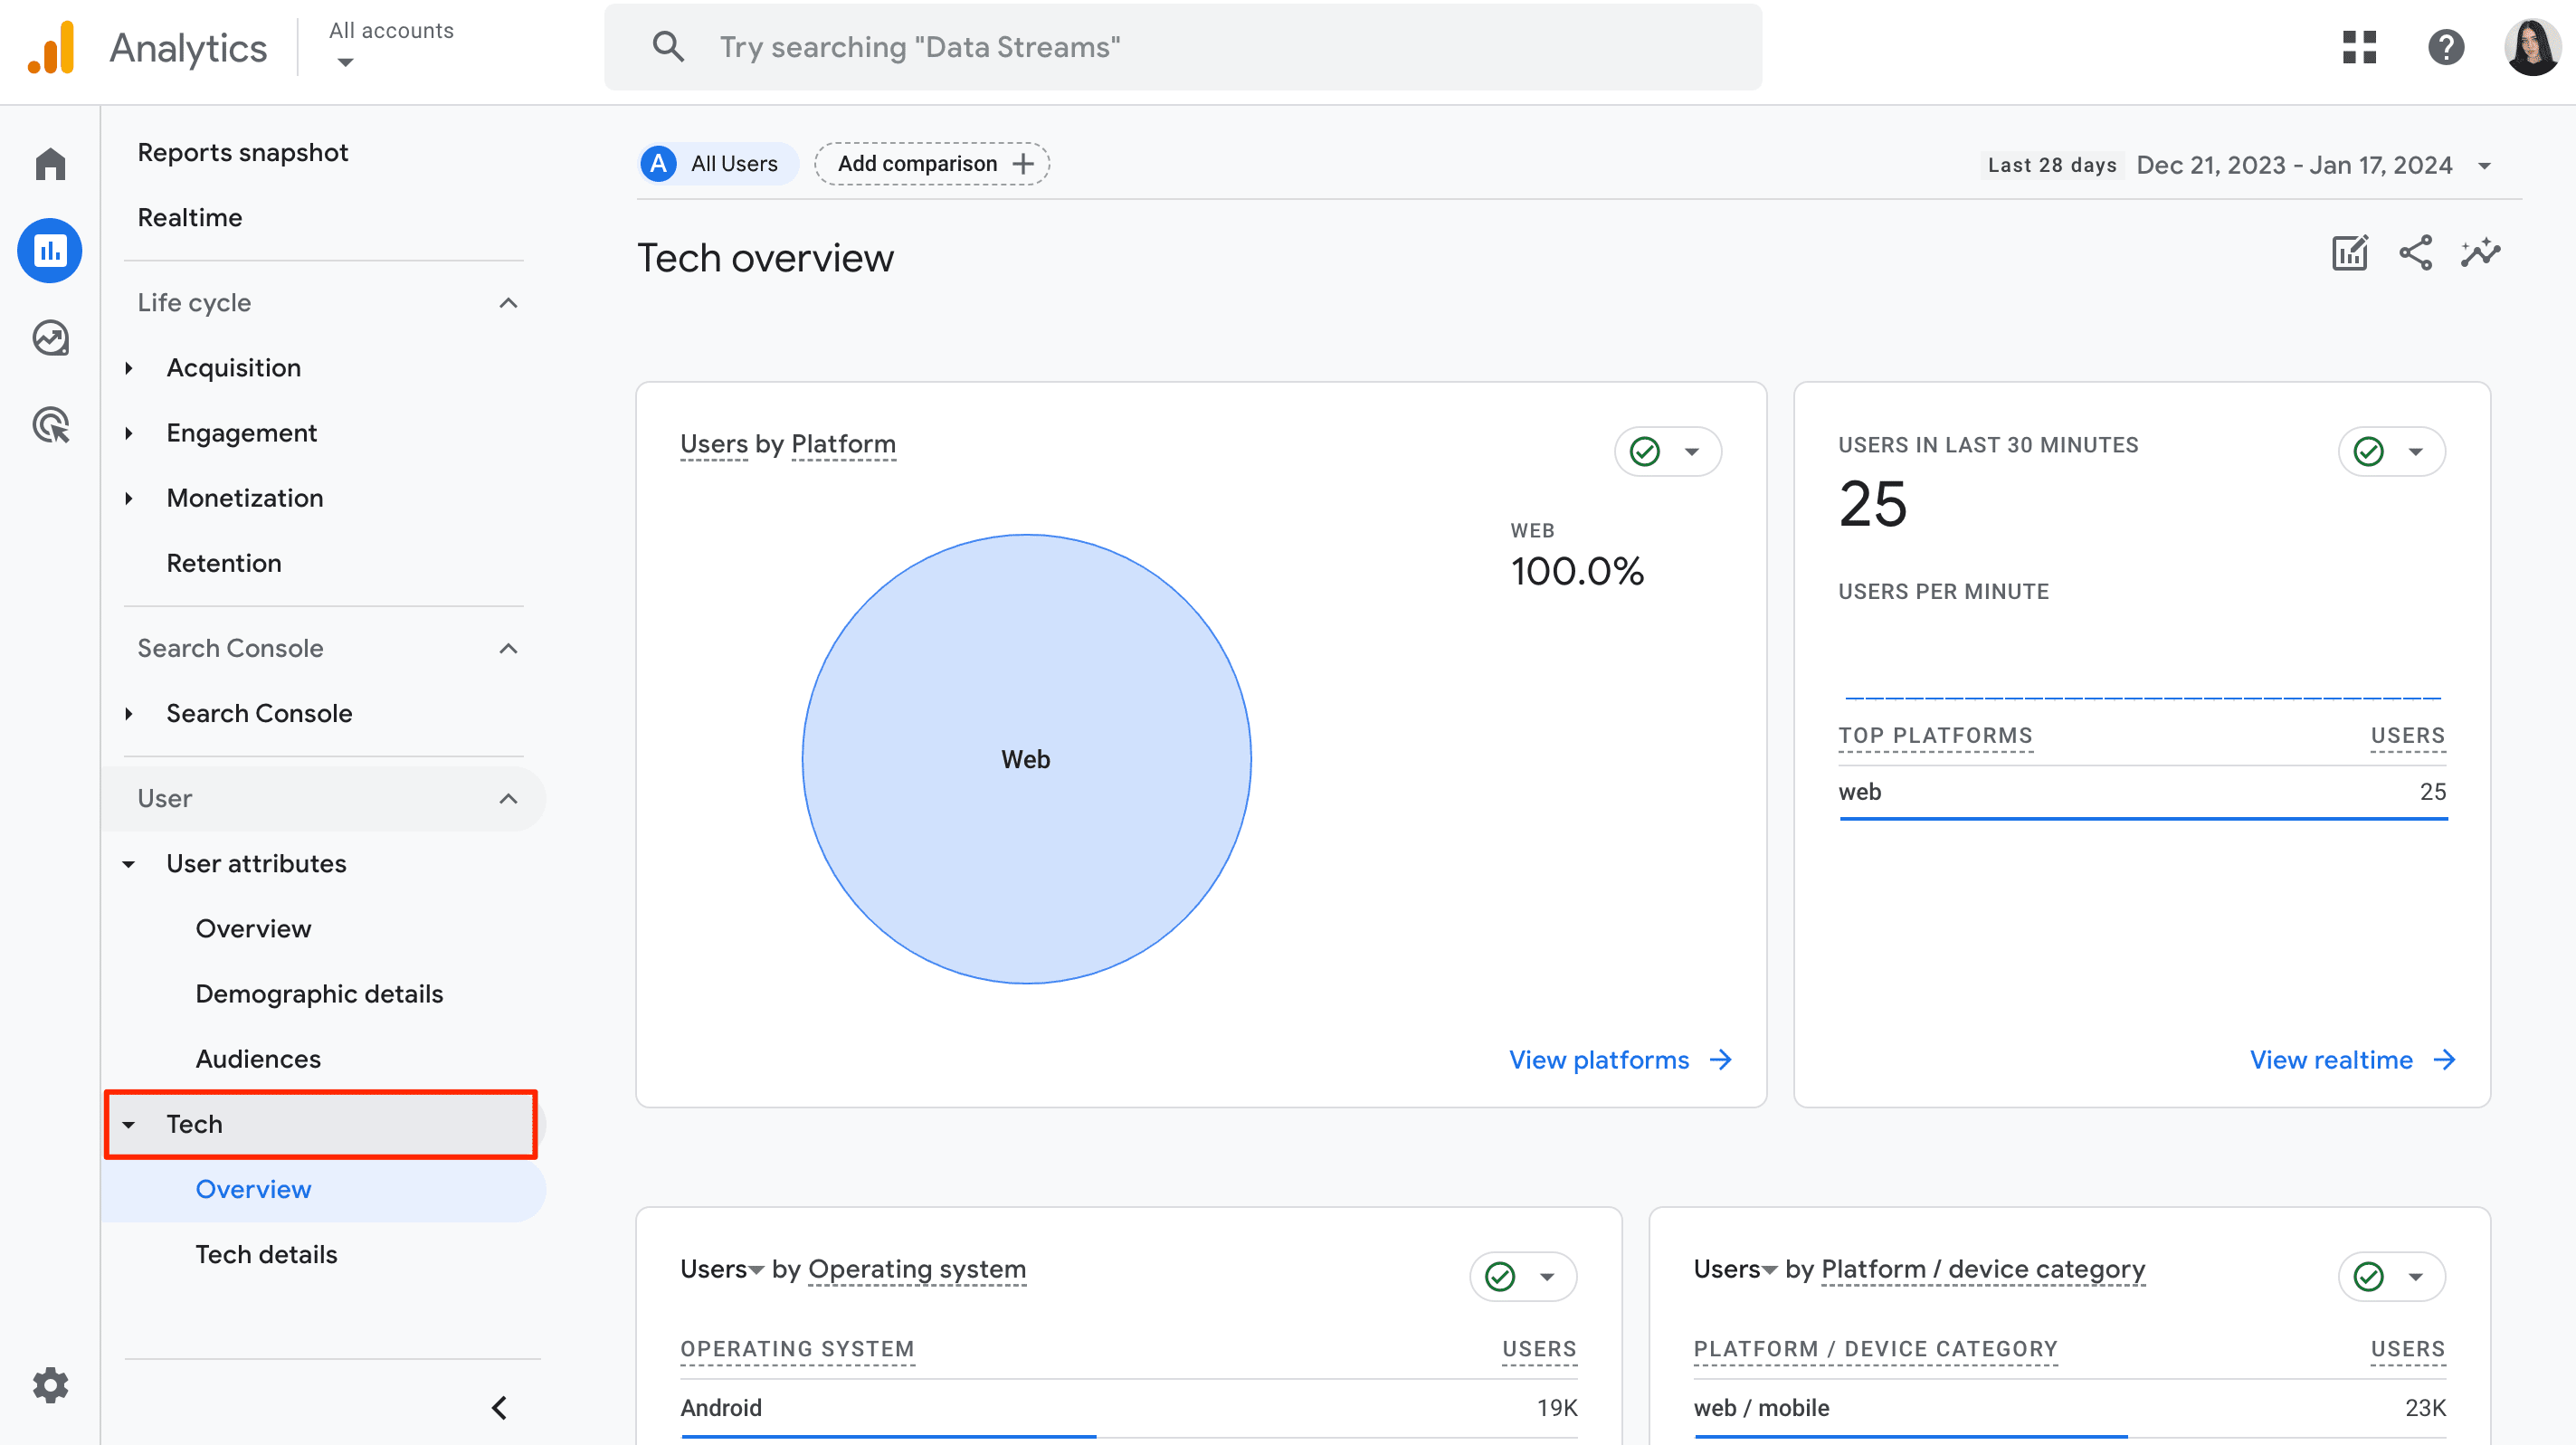
This block includes two reports; the User Attributes report and the Tech report.
The User Attributes report allows you to analyze user behavior based on country, city, language, gender, interests, and age. What’s more, you can track data like user count, new users, session count, views per session, average session duration, and total revenue for each audience segment.
You can use the Tech report to analyze your users relative to the platform they use, operating system, device category, browser, screen resolution, app version, and more. For each of these groups, you can also track GA4 ecommerce parameters, such as user count, new users, engaged sessions, engaged session rate, engaged sessions per user, average engagement time, and events.
Trended Funnels
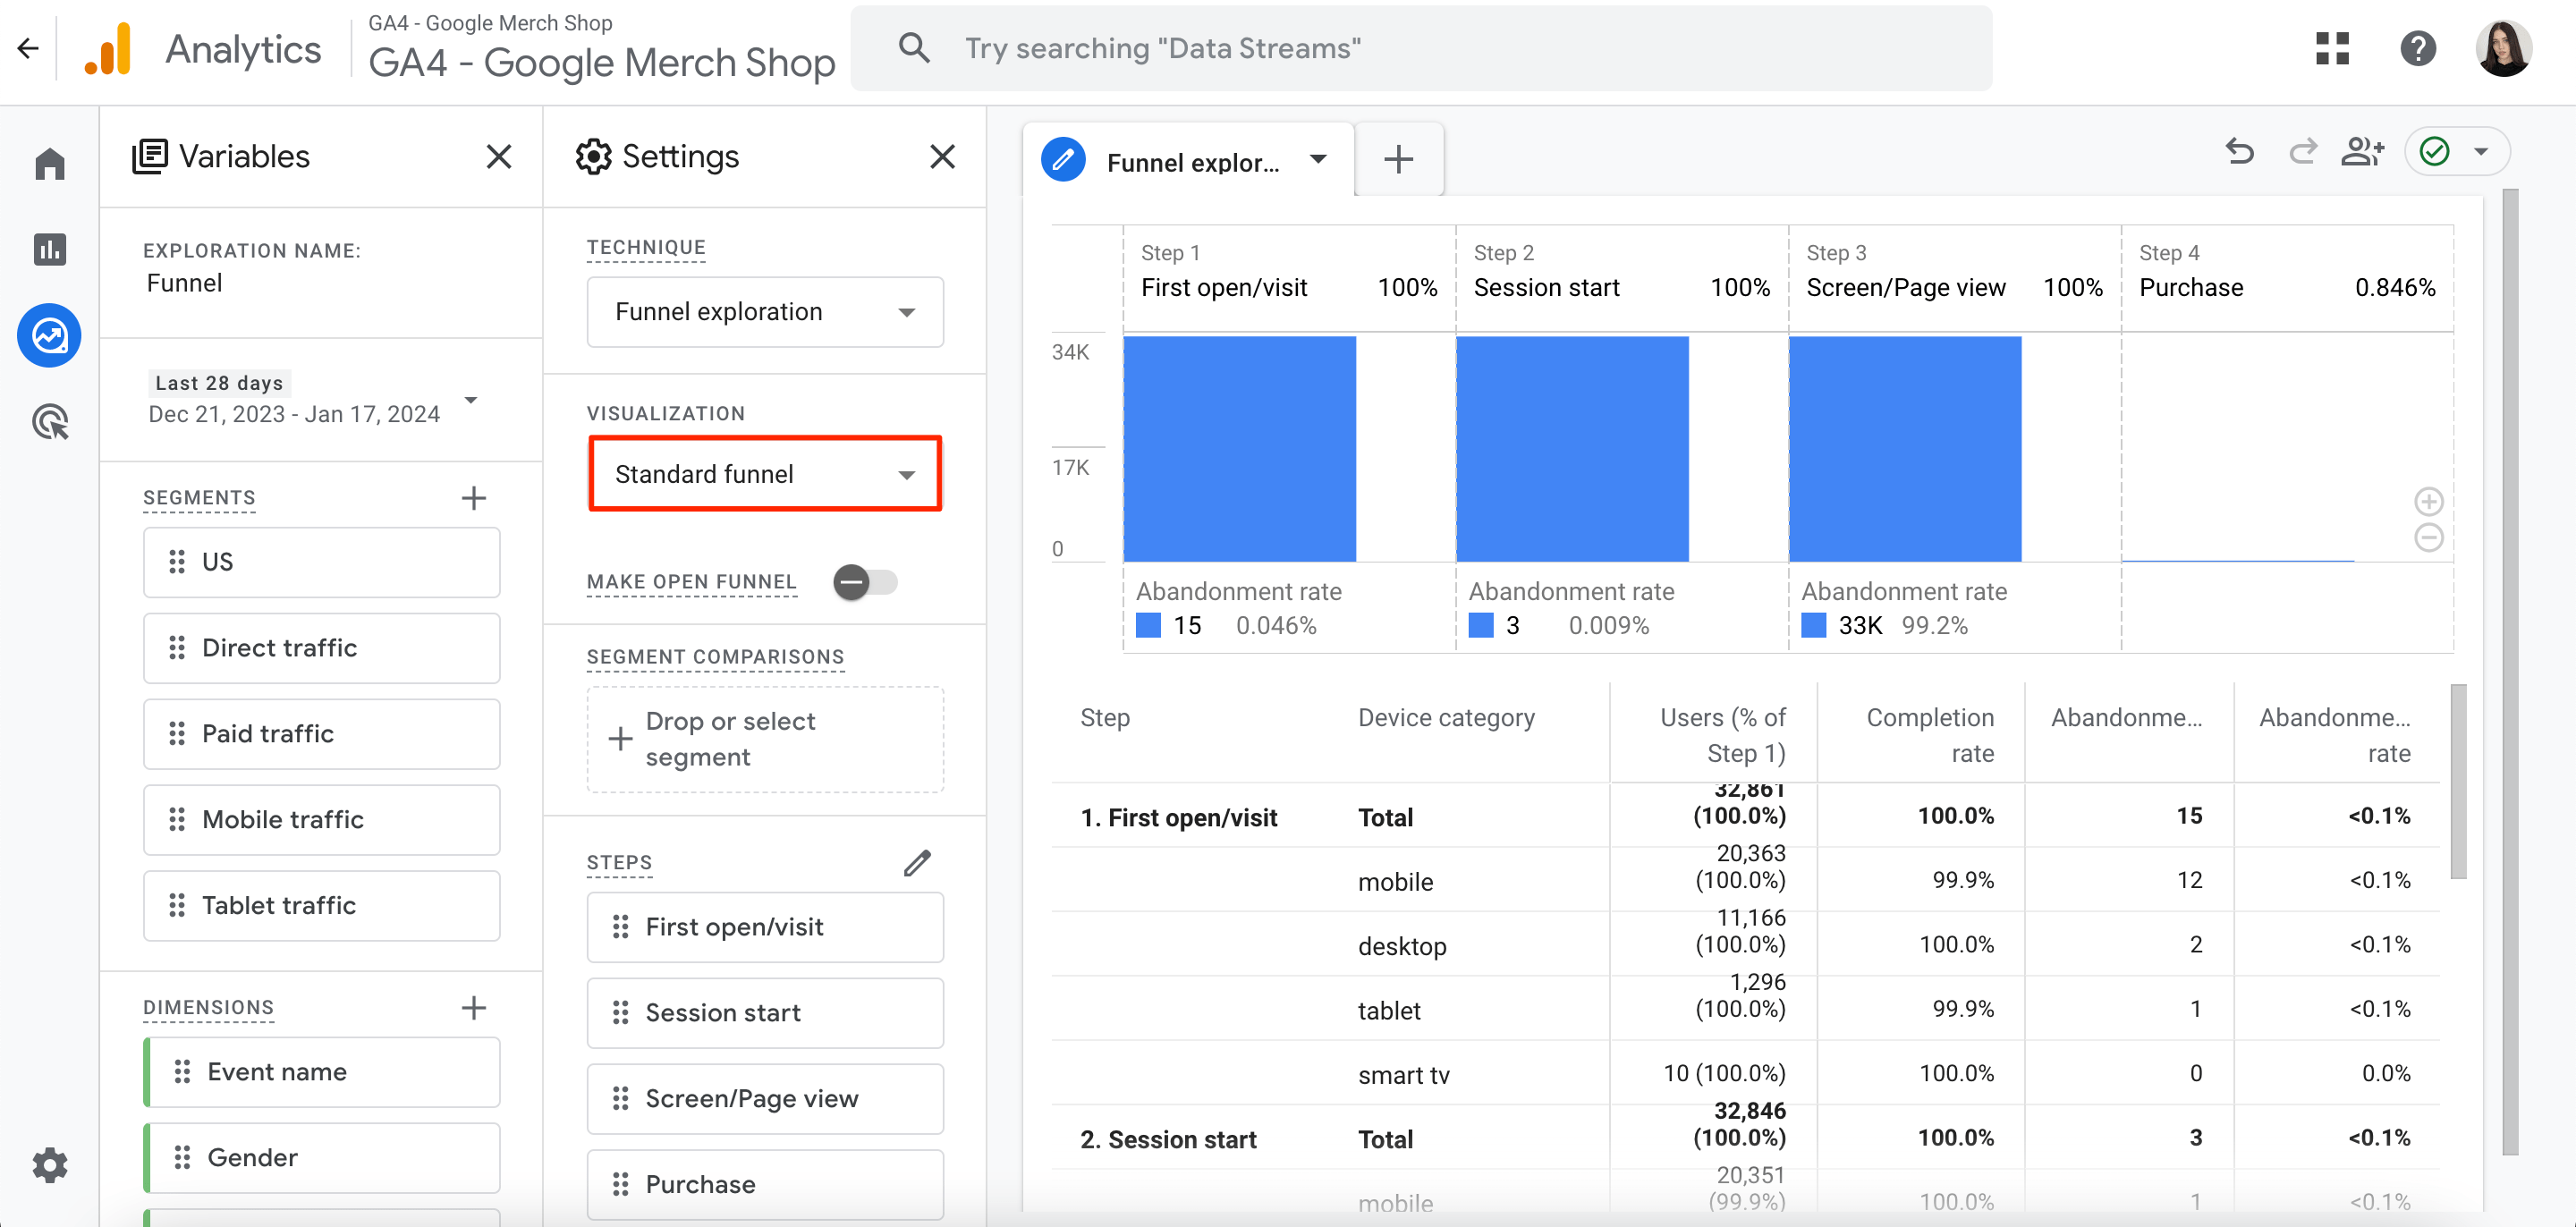
When you visualize data from your reports, you can take one of the two following paths: either through the standard funnel or the trended funnel. Trended funnels will generally be more valuable to you.
The standard funnel only outlines the number of people who completed a specific step. It also shows their drop-off rates.
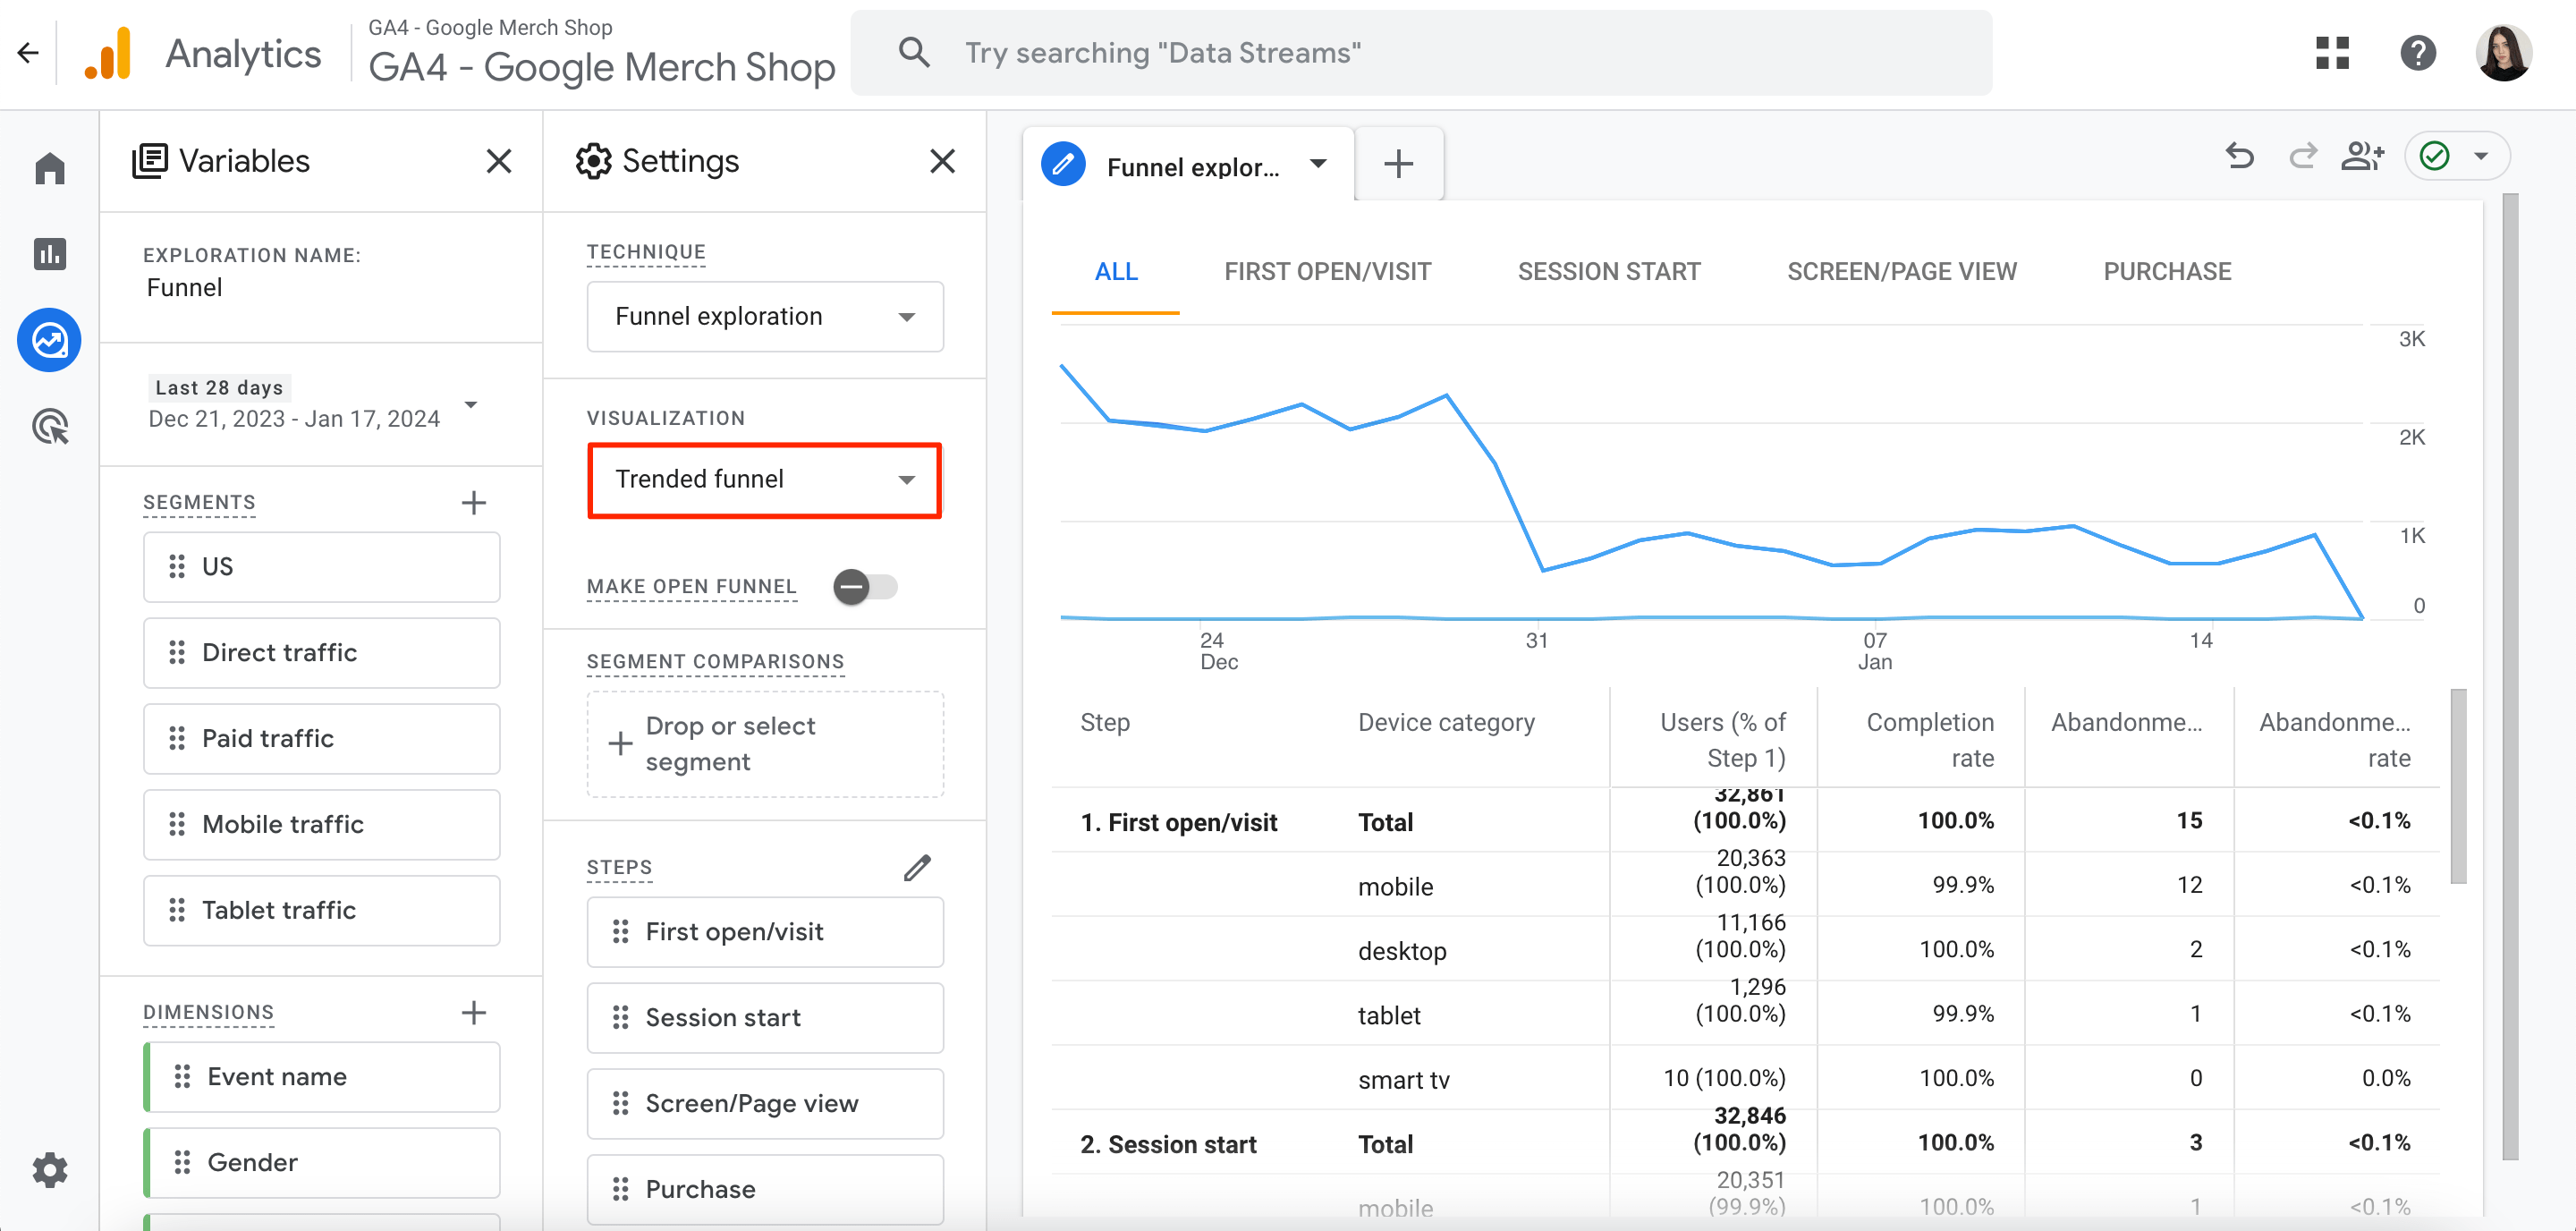
The trended funnel, on the other hand, shows each step of the funnel in the line chart. This makes it easy to see how they changed over time.
Open vs Closed Funnels
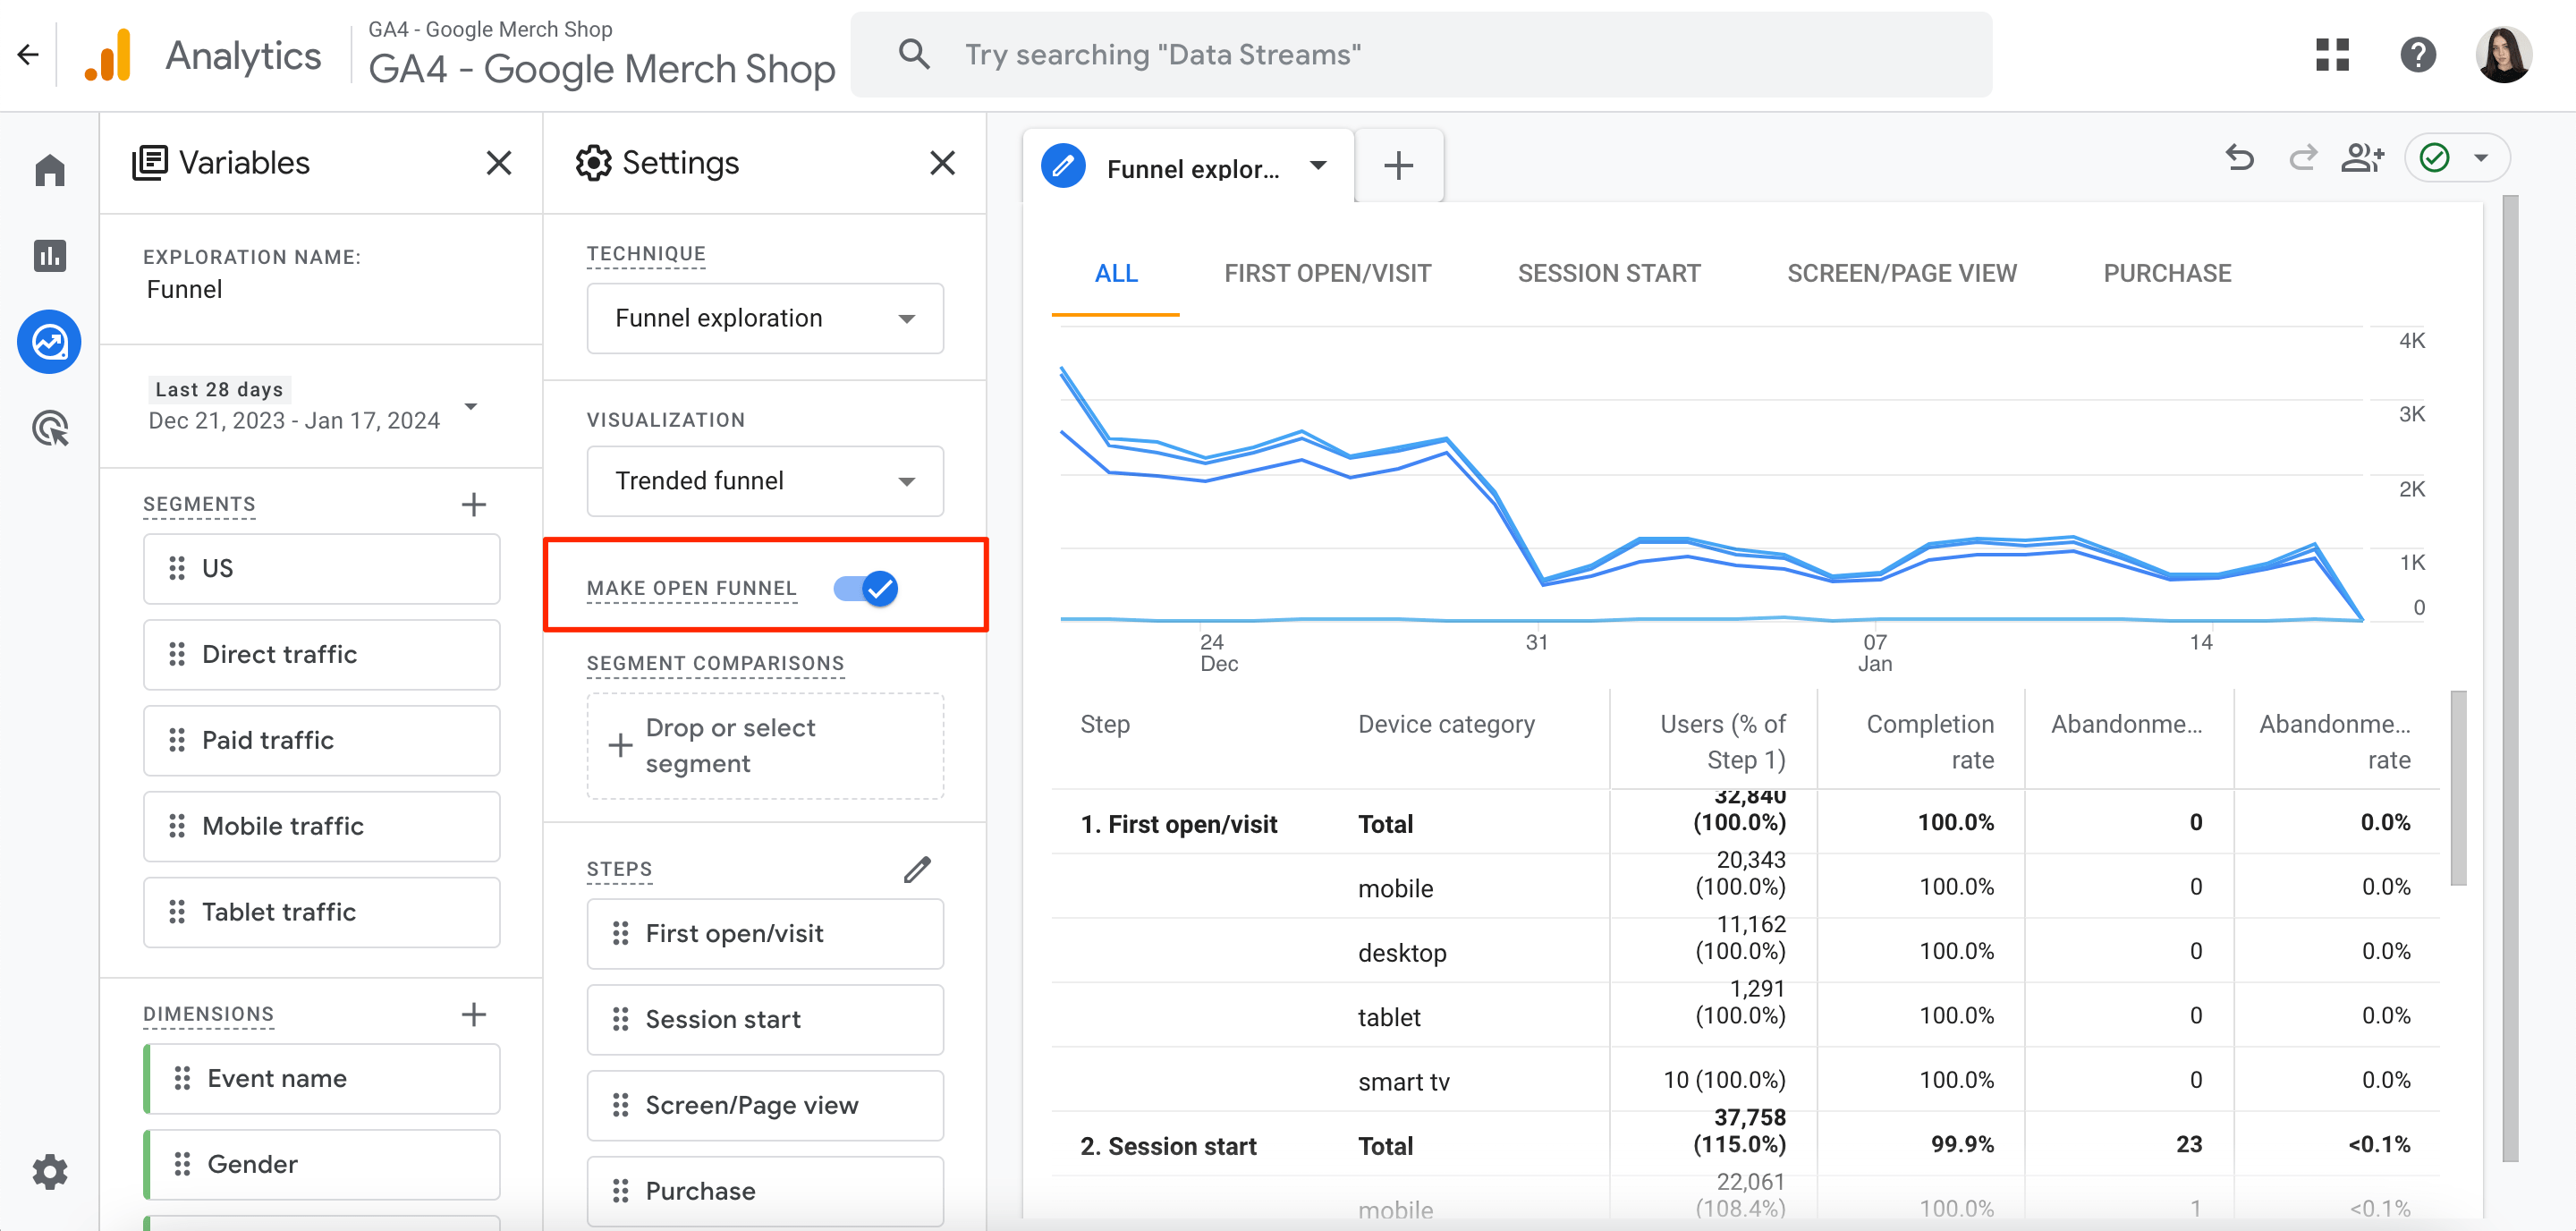
GA4 has closed funnels by default. If a visitor starts the funnel from the second step or beyond, they won’t be included in the funnel count. However, if you’re okay with visitors entering the funnel at any point, you can click the Make Open Funnel toggle to activate it.
New Audience Builder
One particularly noteworthy feature that many ecommerce businesses find useful is that GA4 offers the opportunity to dynamically generate audiences. Once you have a clear understanding of the audience you want to analyze, you can generate a data-rich report around it. This can be done by configuring conditions based on dimensions, metrics, and event data.
Note: It can take up to 24-48 hours to accumulate new users.
To create a new audience, follow these steps:
1. Navigate to Admin>Data Display>Audiences.
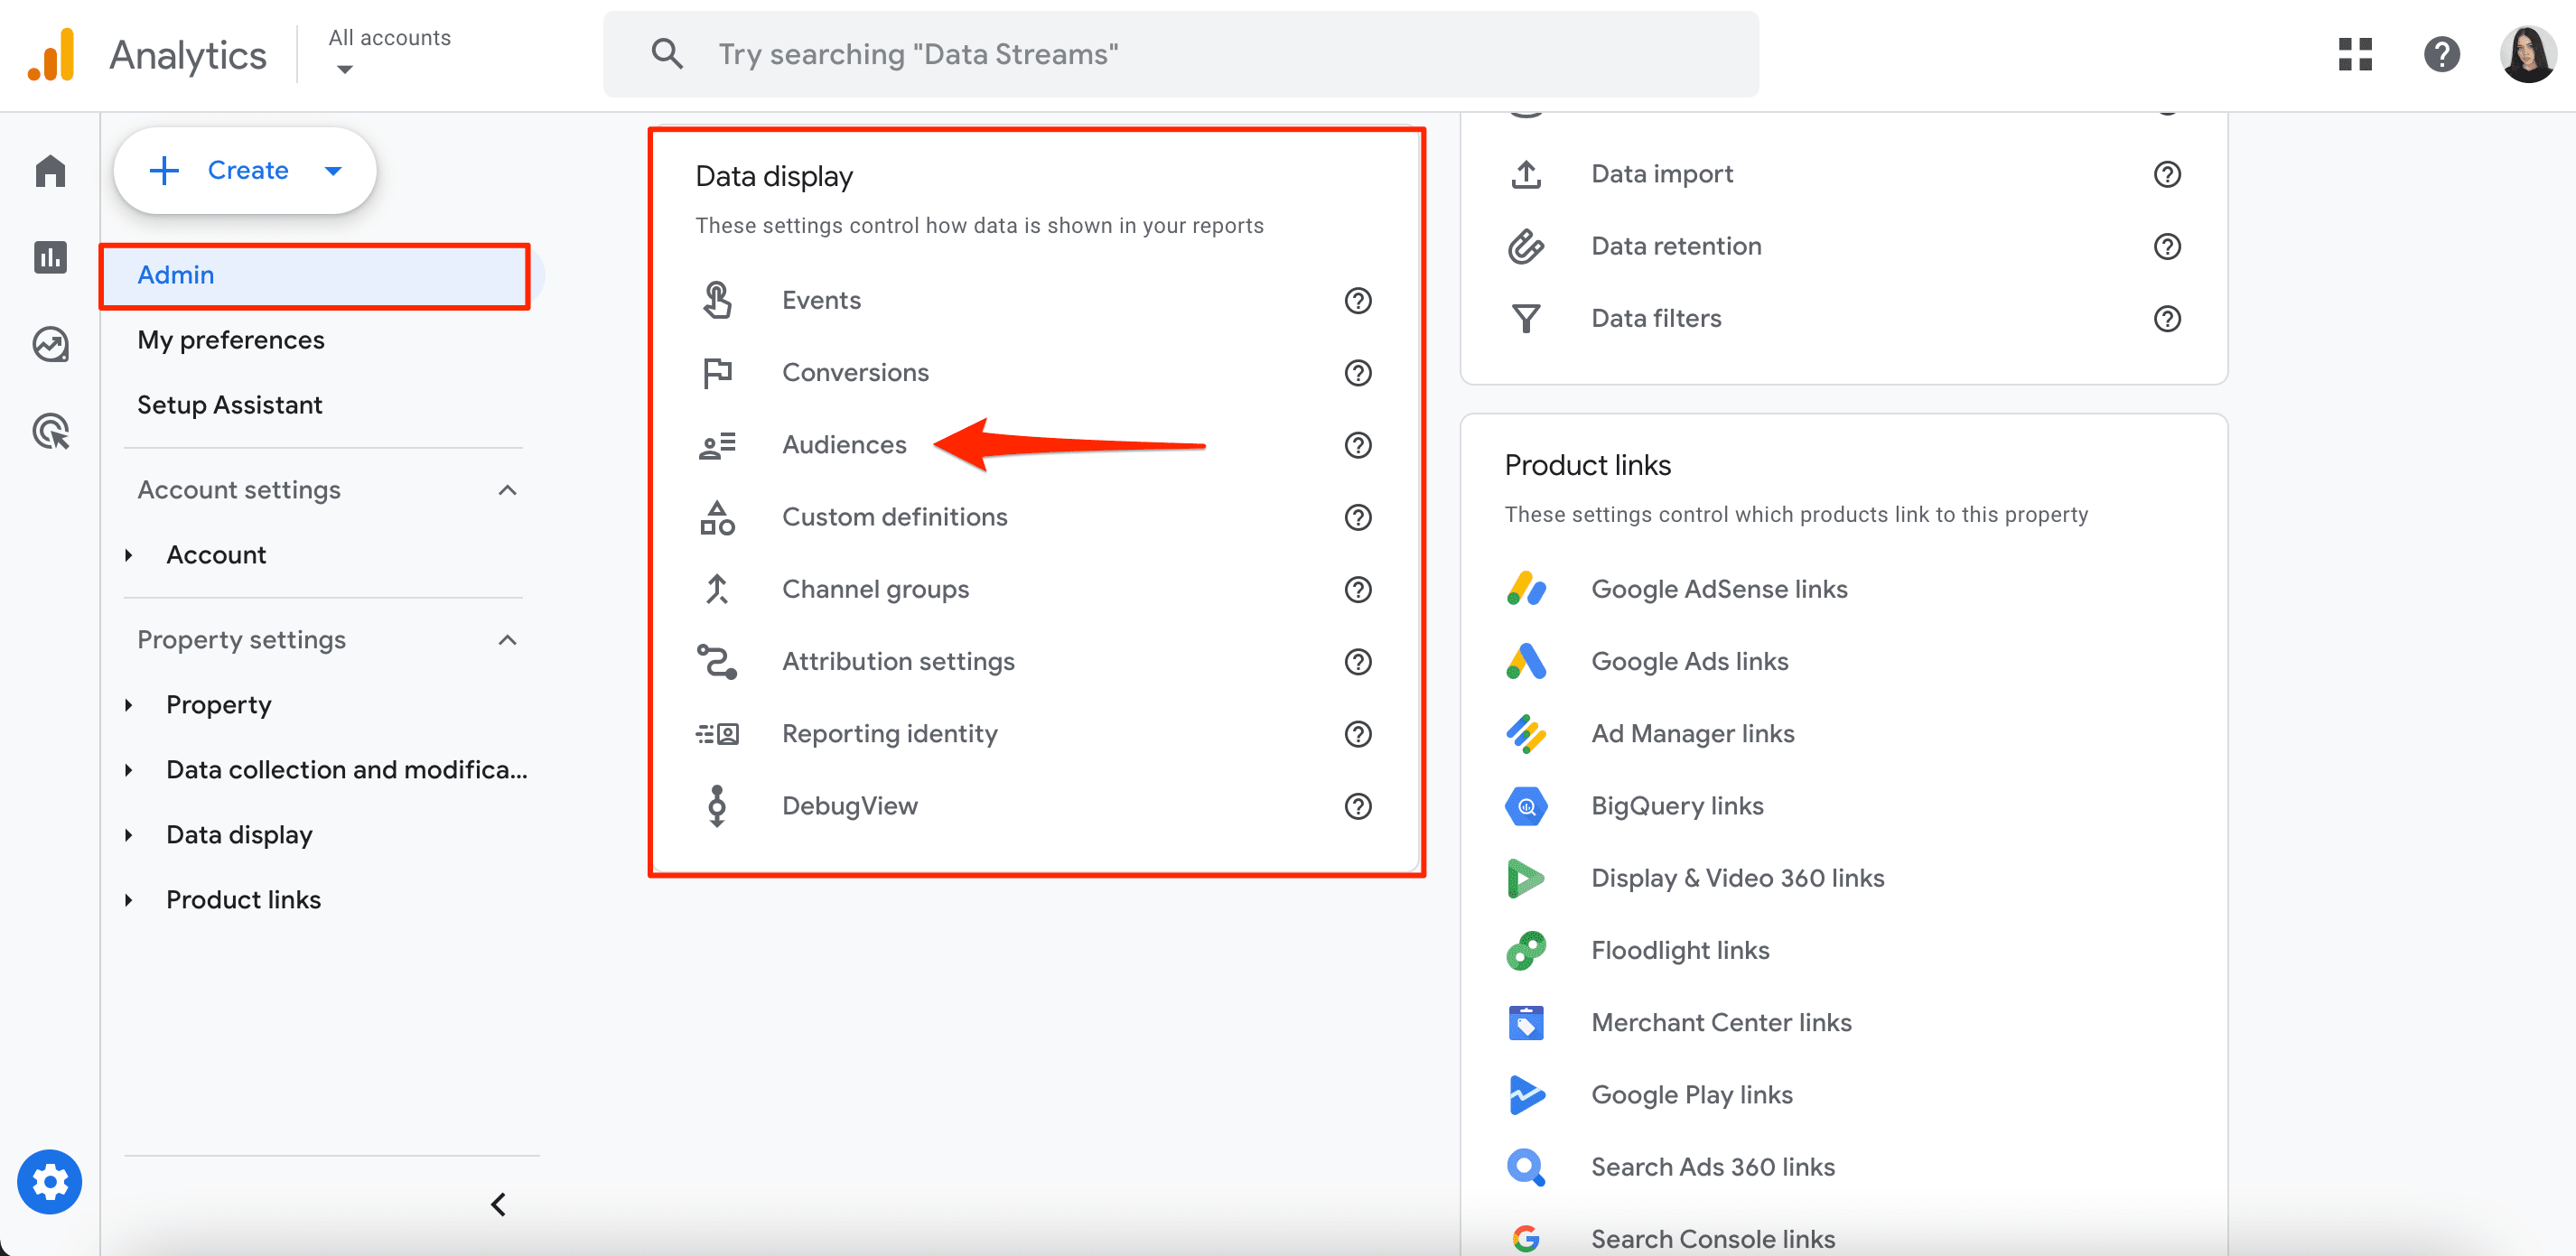
2. Select the New Audience option.

3. Select one of the available audience creation options:
- Create a new audience by defining all parameters on your own.
- Use a template and modify the existing parameters.
- Select a suggested audience.
New Ecommerce Predictive Audiences
A predictive audience is a type of GA4 audience with at least one condition that’s based on a predictive metric. Here is the complete list of metrics that you can build around your audiences:
- Likely 7-day purchasers
- Likely 7-day churning purchasers
- Likely 7-day churning users
- Likely first-time 7-day purchasers
- Predicted 28-day top spenders
Once you create a predictive audience in your GA4 property, it will automatically be available for use in all your connected advertising accounts. These accounts include Google Ads, Display & Video 360, and Search Ads 360.
To create predictive audiences, follow these simple steps:
1. Go to Admin>Data Display>Audiences.

2. Click New Audience.

To create the audience based on a suggested audience:
- Click Predictive under Suggested Audiences.
- Select one of the Ready to Use templates.
- Adjust the template according to your needs.
To create a custom audience with conditions based on predictive metrics:
- Click Create a Custom Audience.
- Enter a name and description for the audience.
- Click Add New Condition.
- Select one of the predictive metrics (e.g., LTV > 5 in any 7-day period).
If you decide to configure a custom range, the sliders will show you the number of people included and how likely they are to meet established conditions.
Monetization Report
The Monetization report offers an overview of your business’s online revenue. This report helps you explore details on ecommerce, subscription, and ad revenue.
More specifically, it provides answers to the following questions:
- What types of traffic generate the highest revenue?
- Which products/services contribute most to revenue?
- What is my customers’ average spending per order?
The Overview block tracks your total revenue, purchase revenue, and total ad revenue. It lets you compare specific groups of users or investigate specific events and conversions over time.
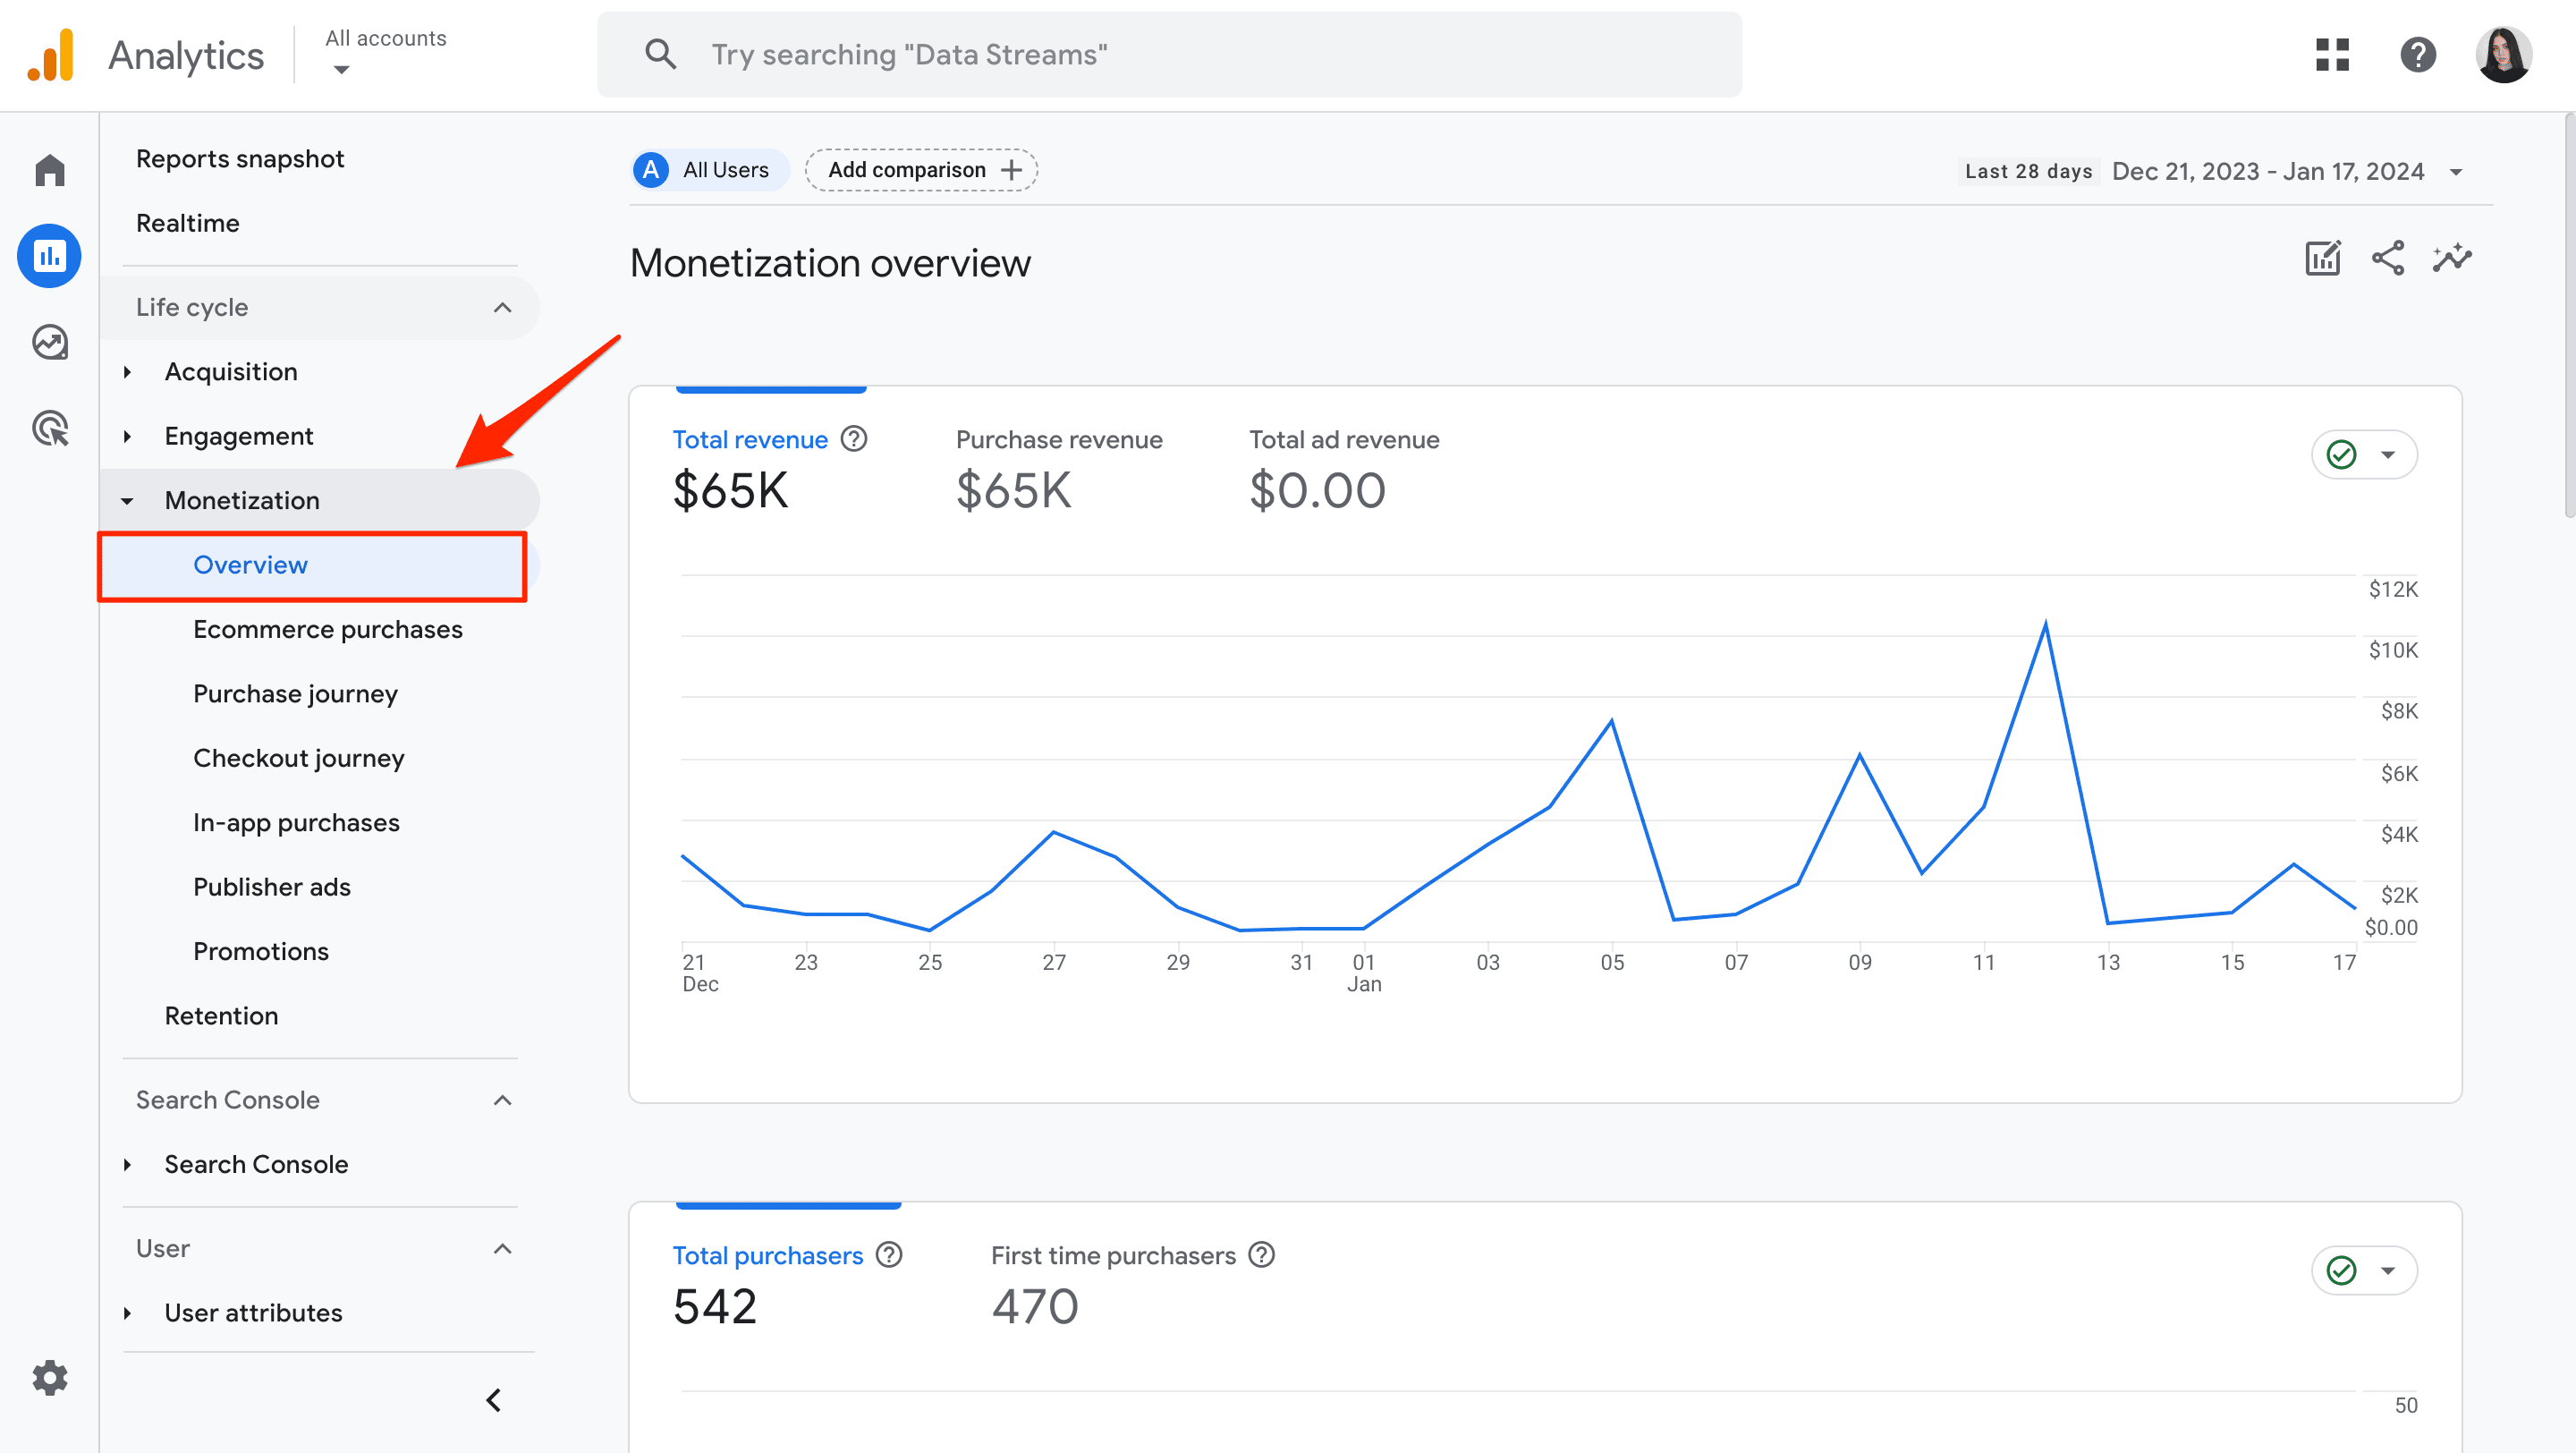
For instance, let’s say you want to look at the purchasing habits of your customers from New York. Clicking the Add Comparison button at the top of your report and then filling in your desired dimensions gives you an impression of how this audience contributed to your total revenue.
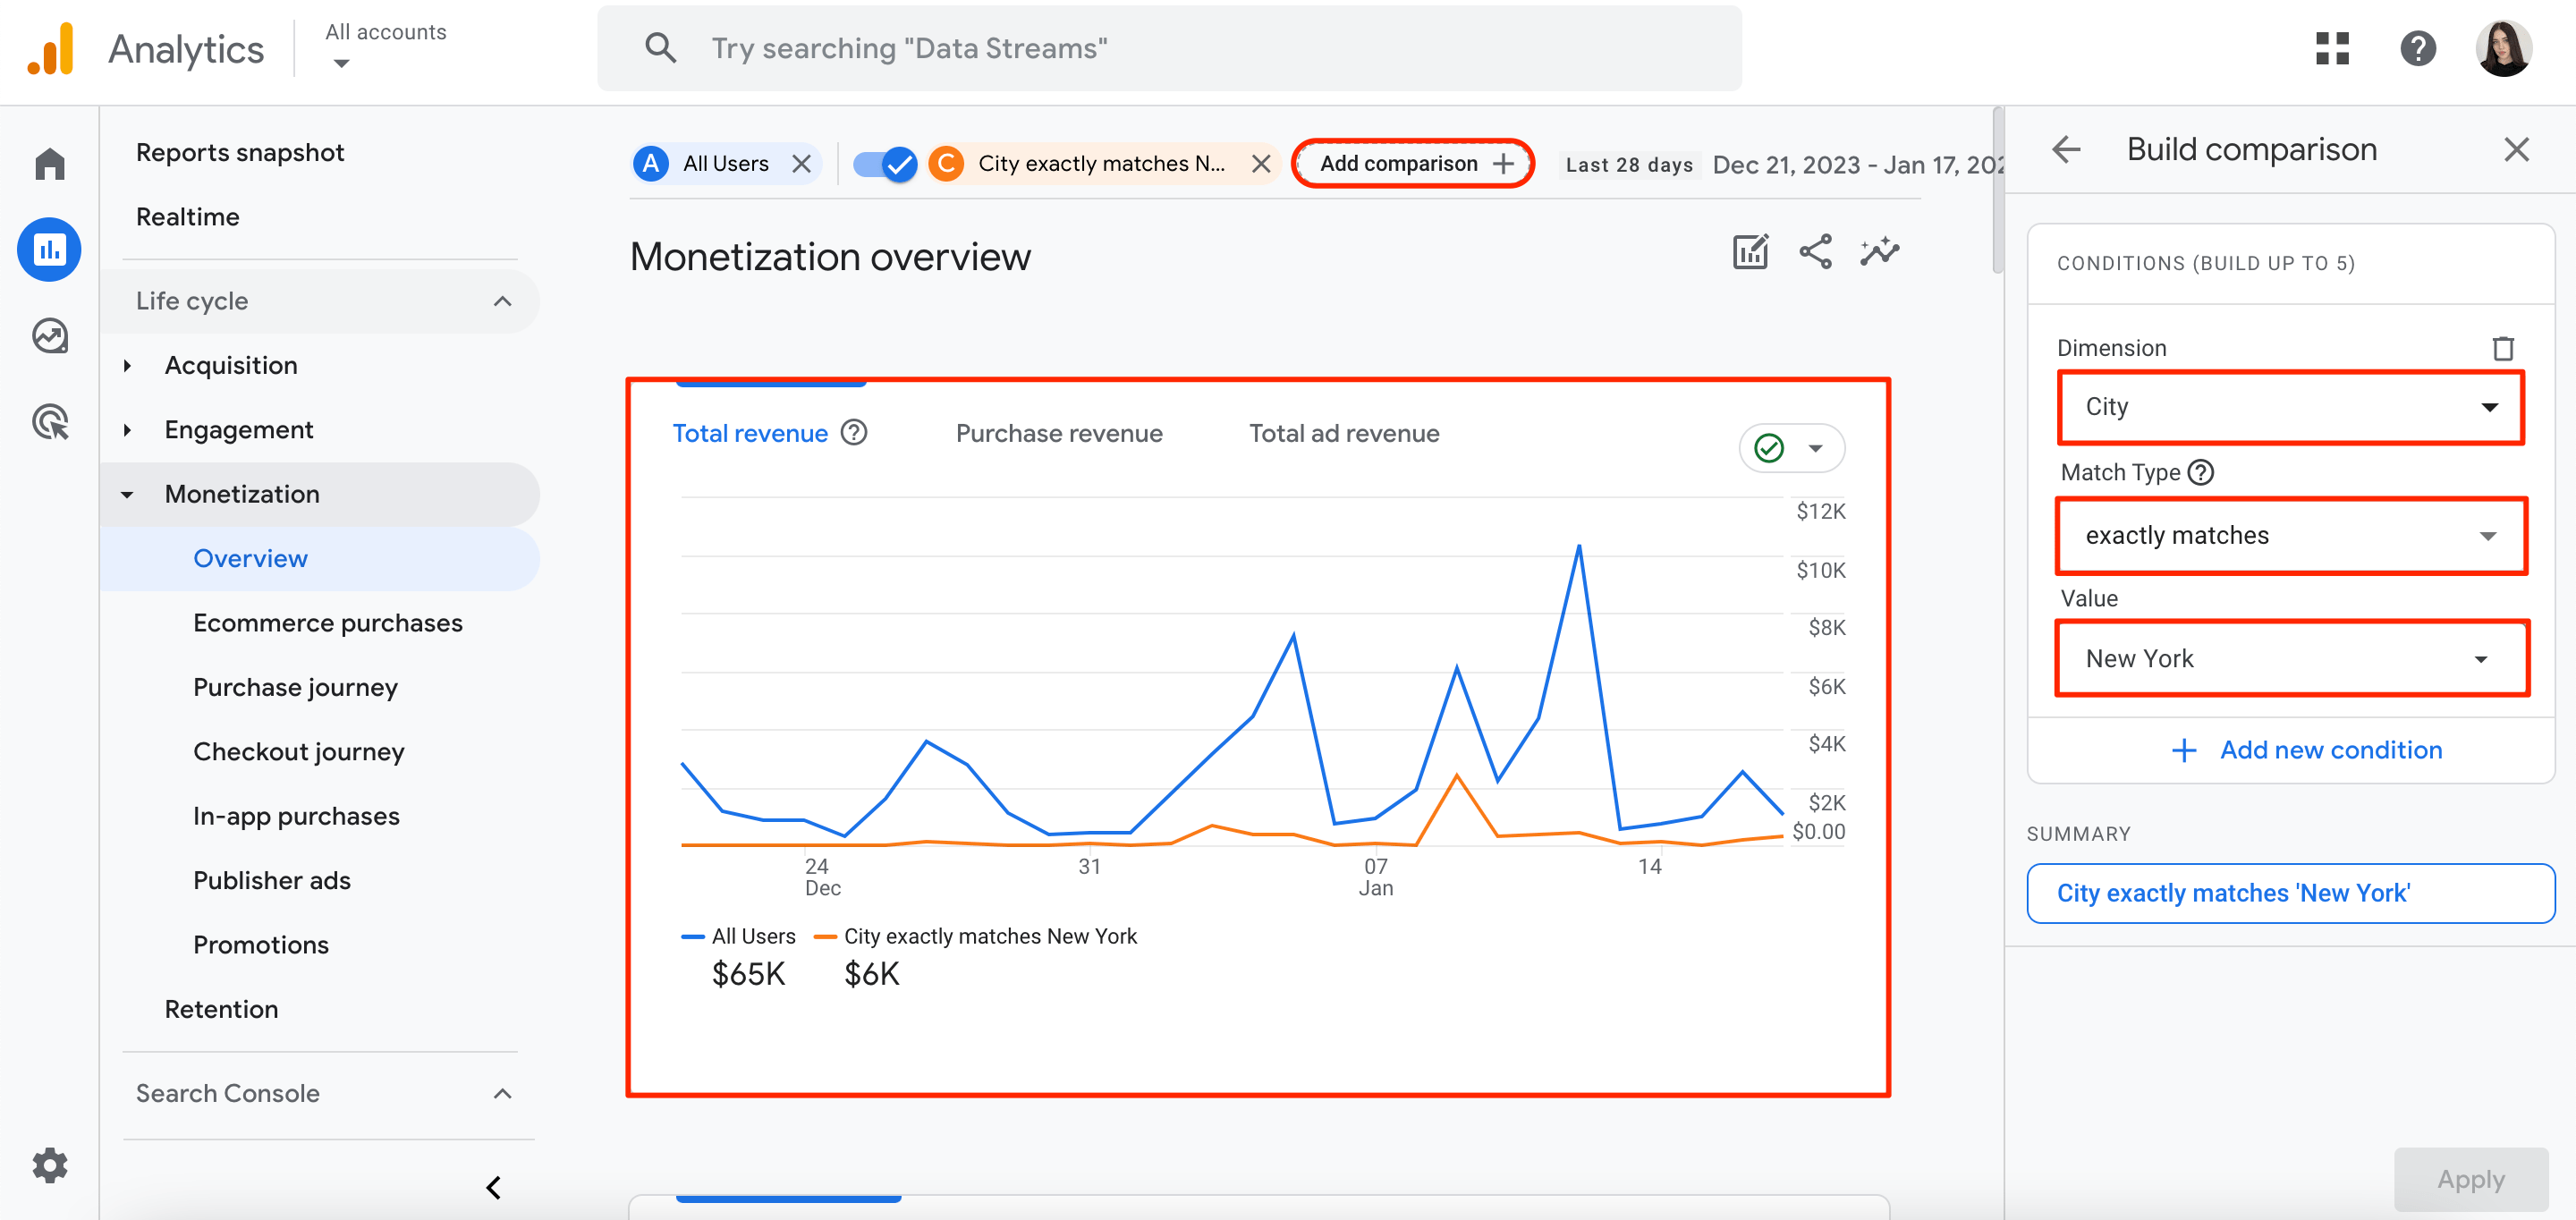
Beyond the Overview report, you can take a look at the Ecommerce Purchases report to see the products/services you sell on your ecommerce store.
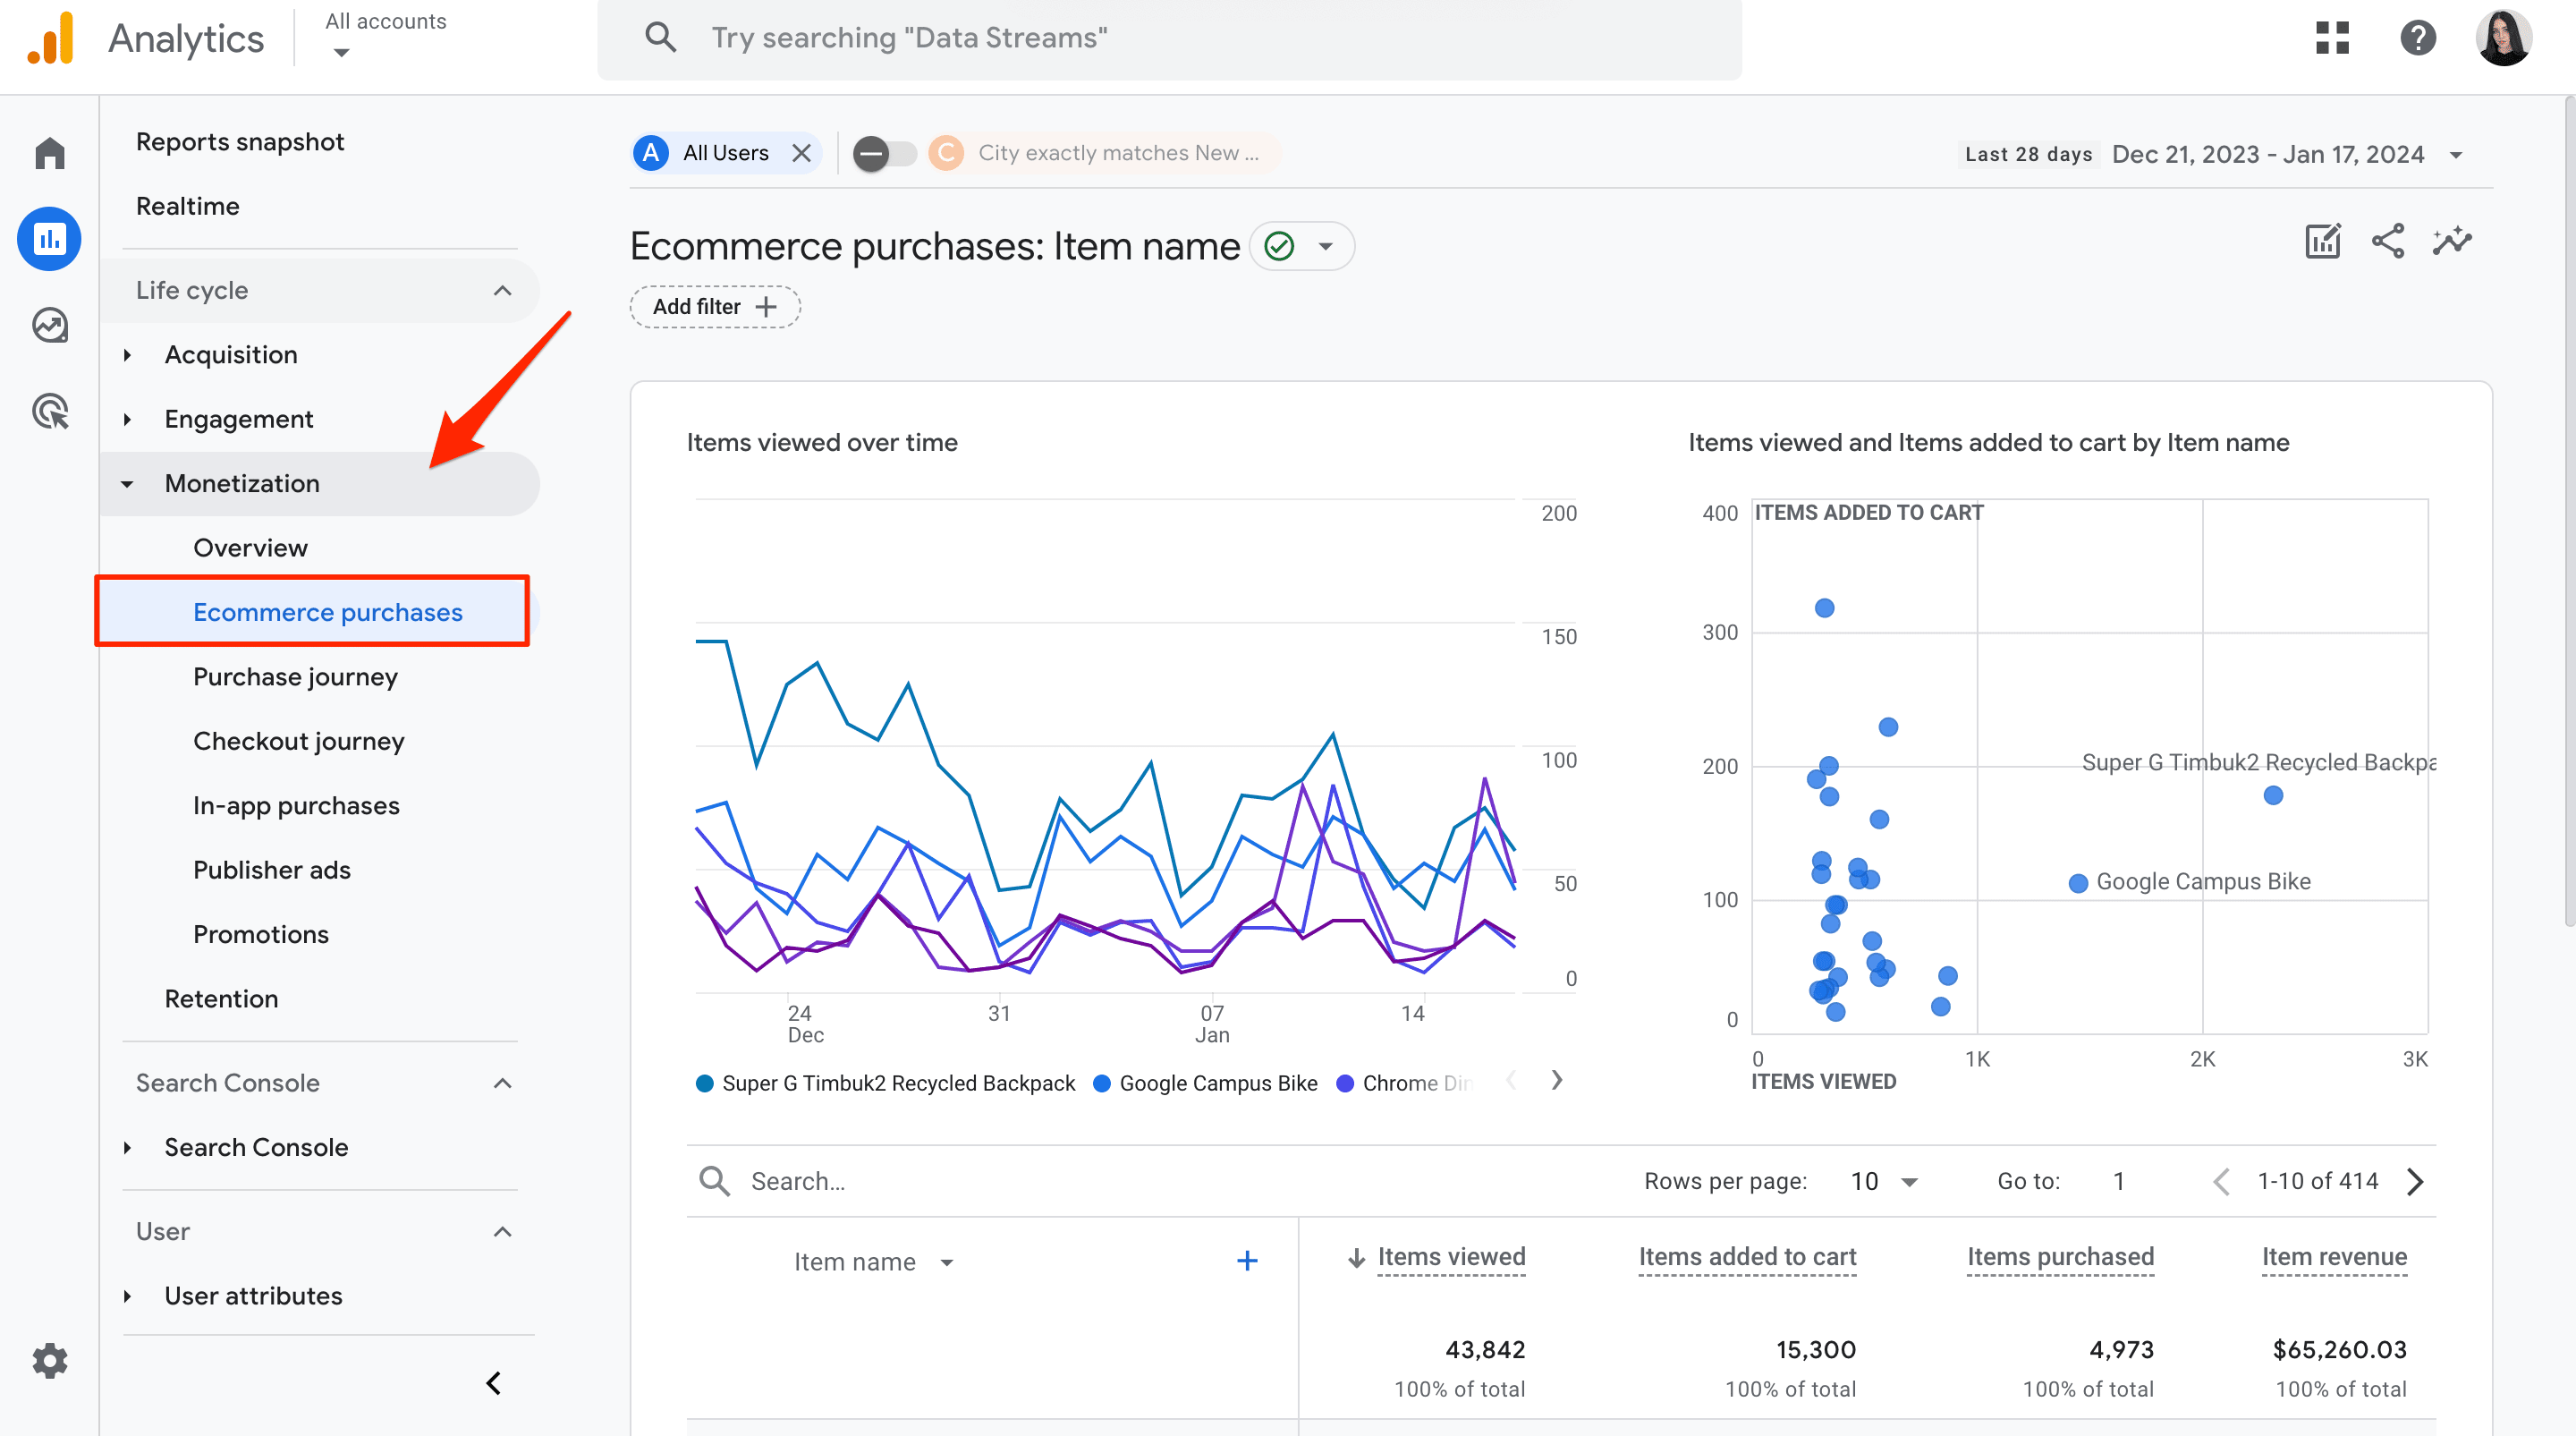
Still, GA4 ecommerce events are not collected automatically. To collect valuable information, you’ll first need to configure ecommerce events (e.g., add_to_cart and purchase) on your website or mobile app.
Retention Report
The Retention report is a pre-generated summary report that showcases user retention on your website or app. It tells you how long users stay on your site or app after they first join, as well as the percentage of users who revisit each day during their first 42 days.
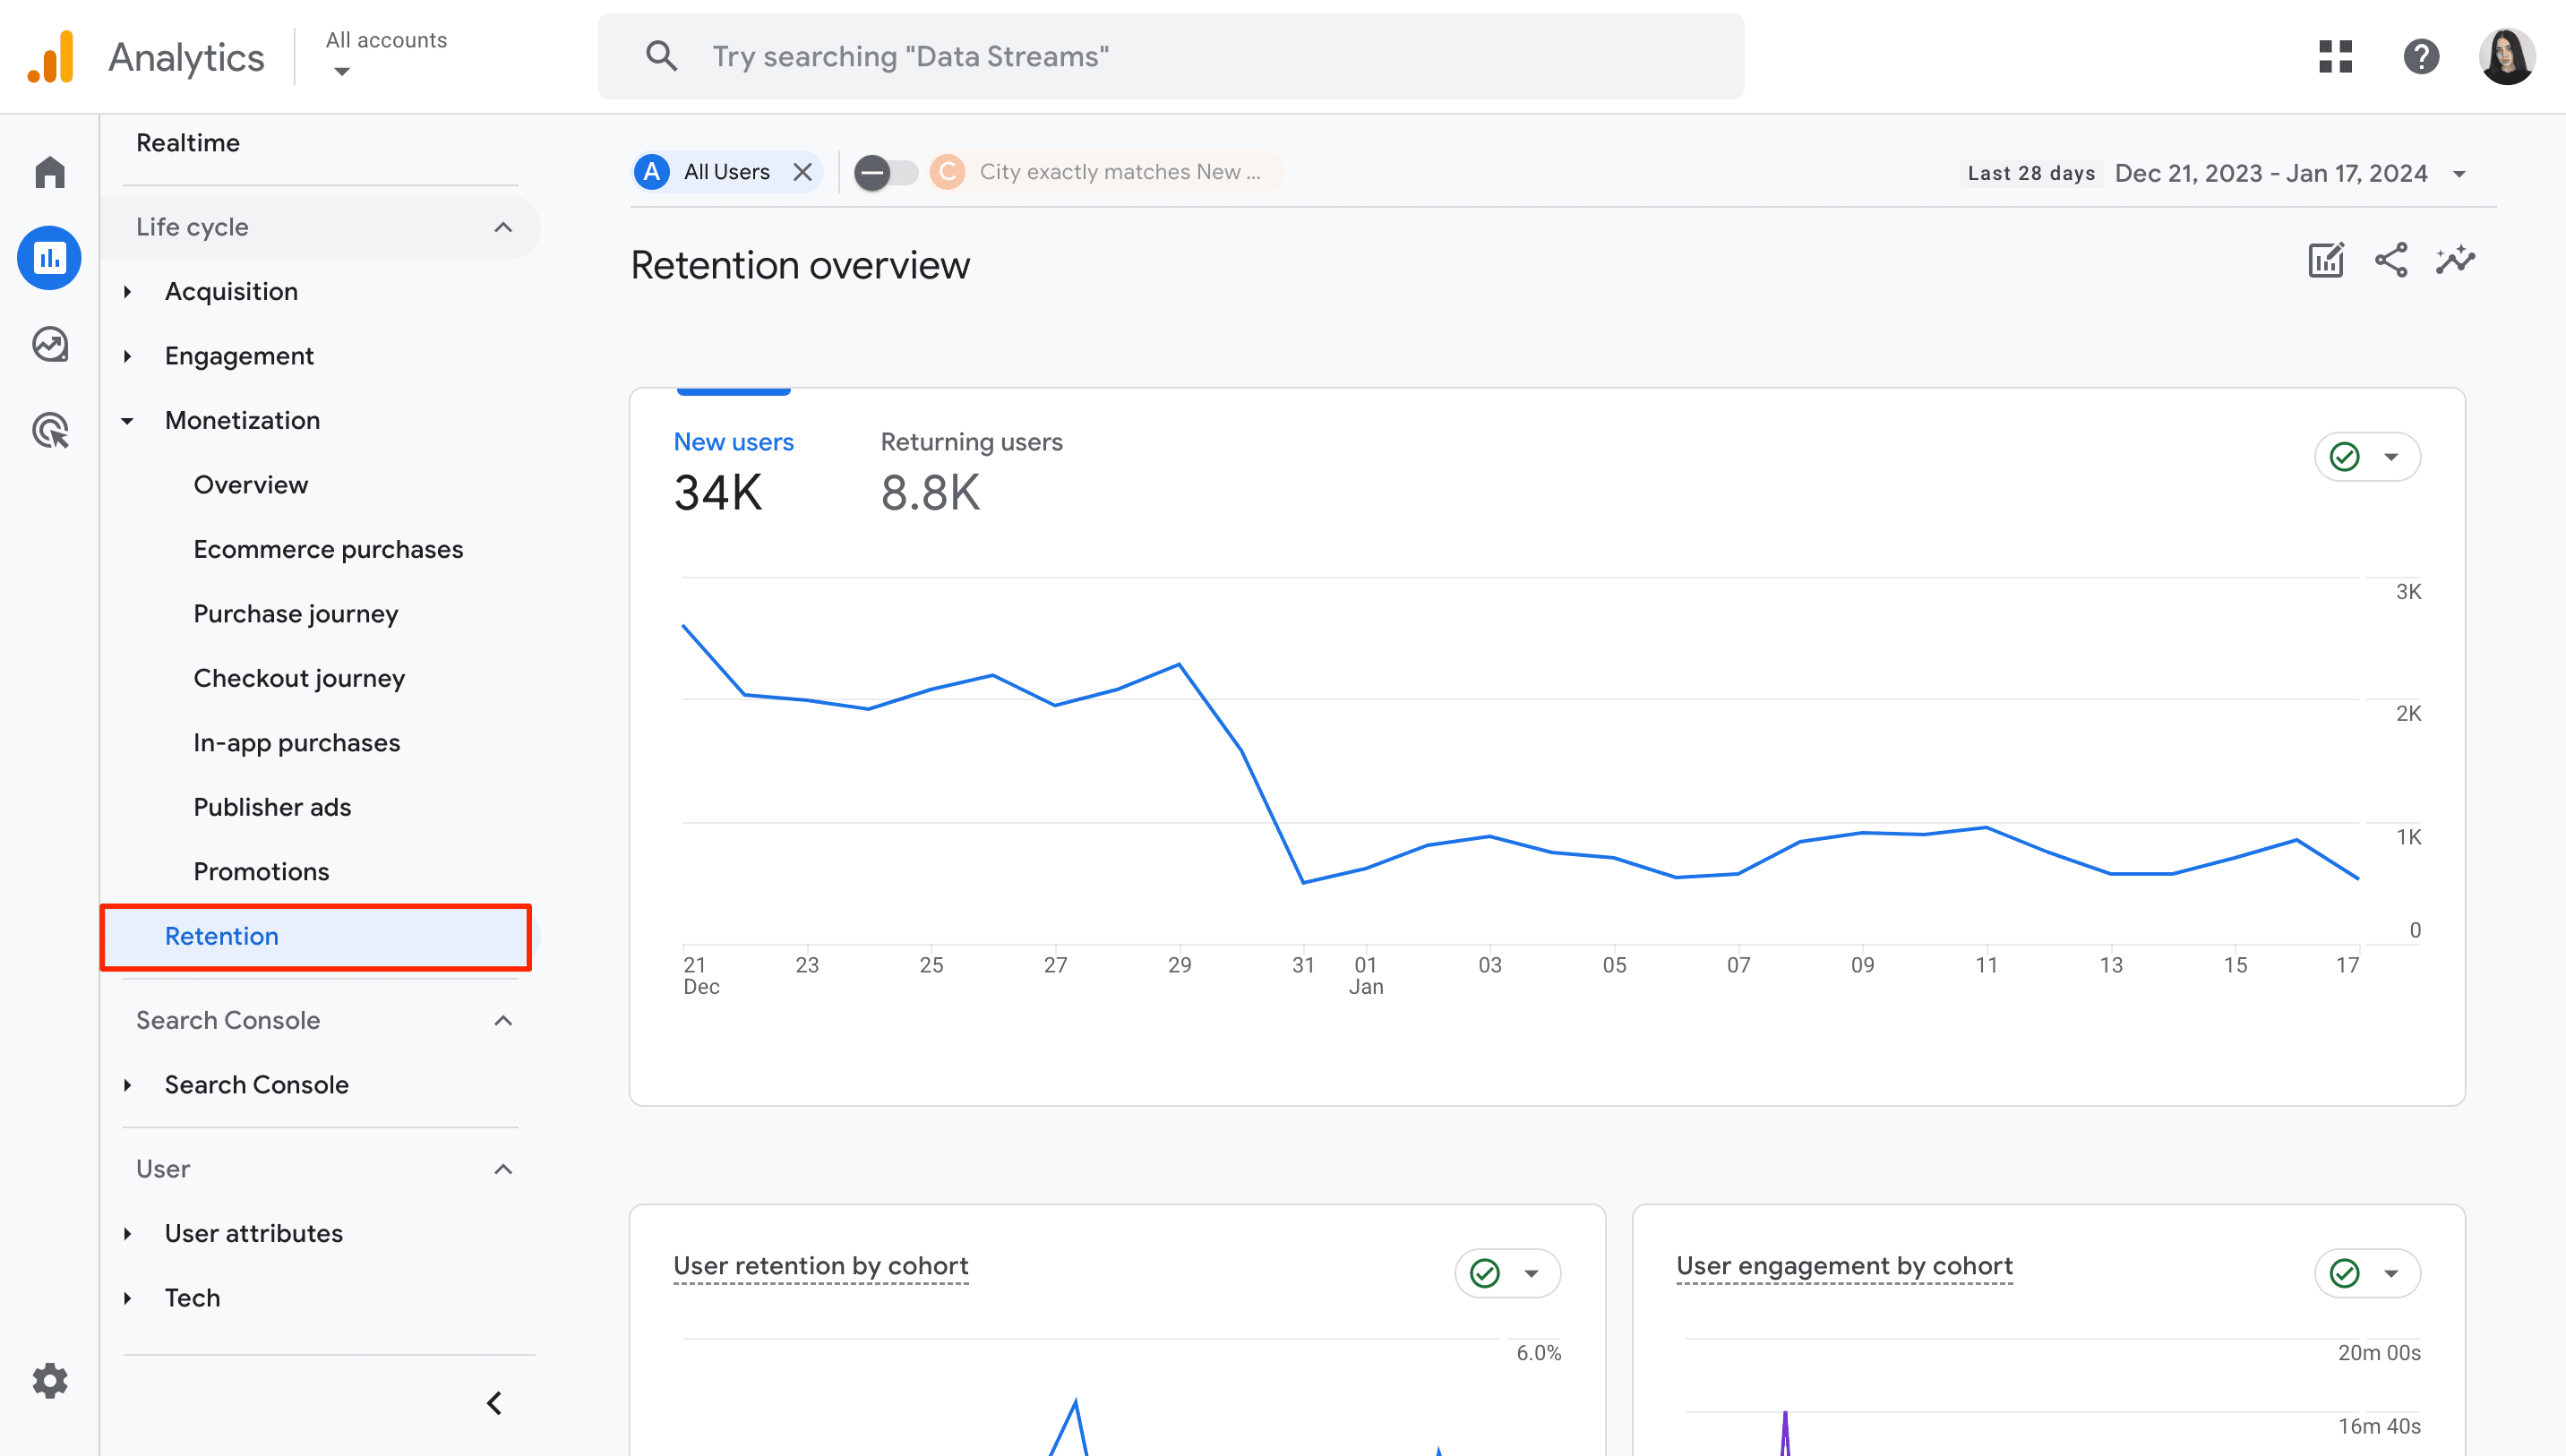
The Google Analytics 4 ecommerce parameters included in this report comprise the following: new users, returning users, user retention by cohort, user engagement by cohort, user retention, user engagement, and lifetime value.
User Report: Demographic Characteristics
The Demographic Details within the User Attributes block report is a summary of the key information on individuals who visit your website or app. It provides insights into the user’s language, interests, location, age, and gender.
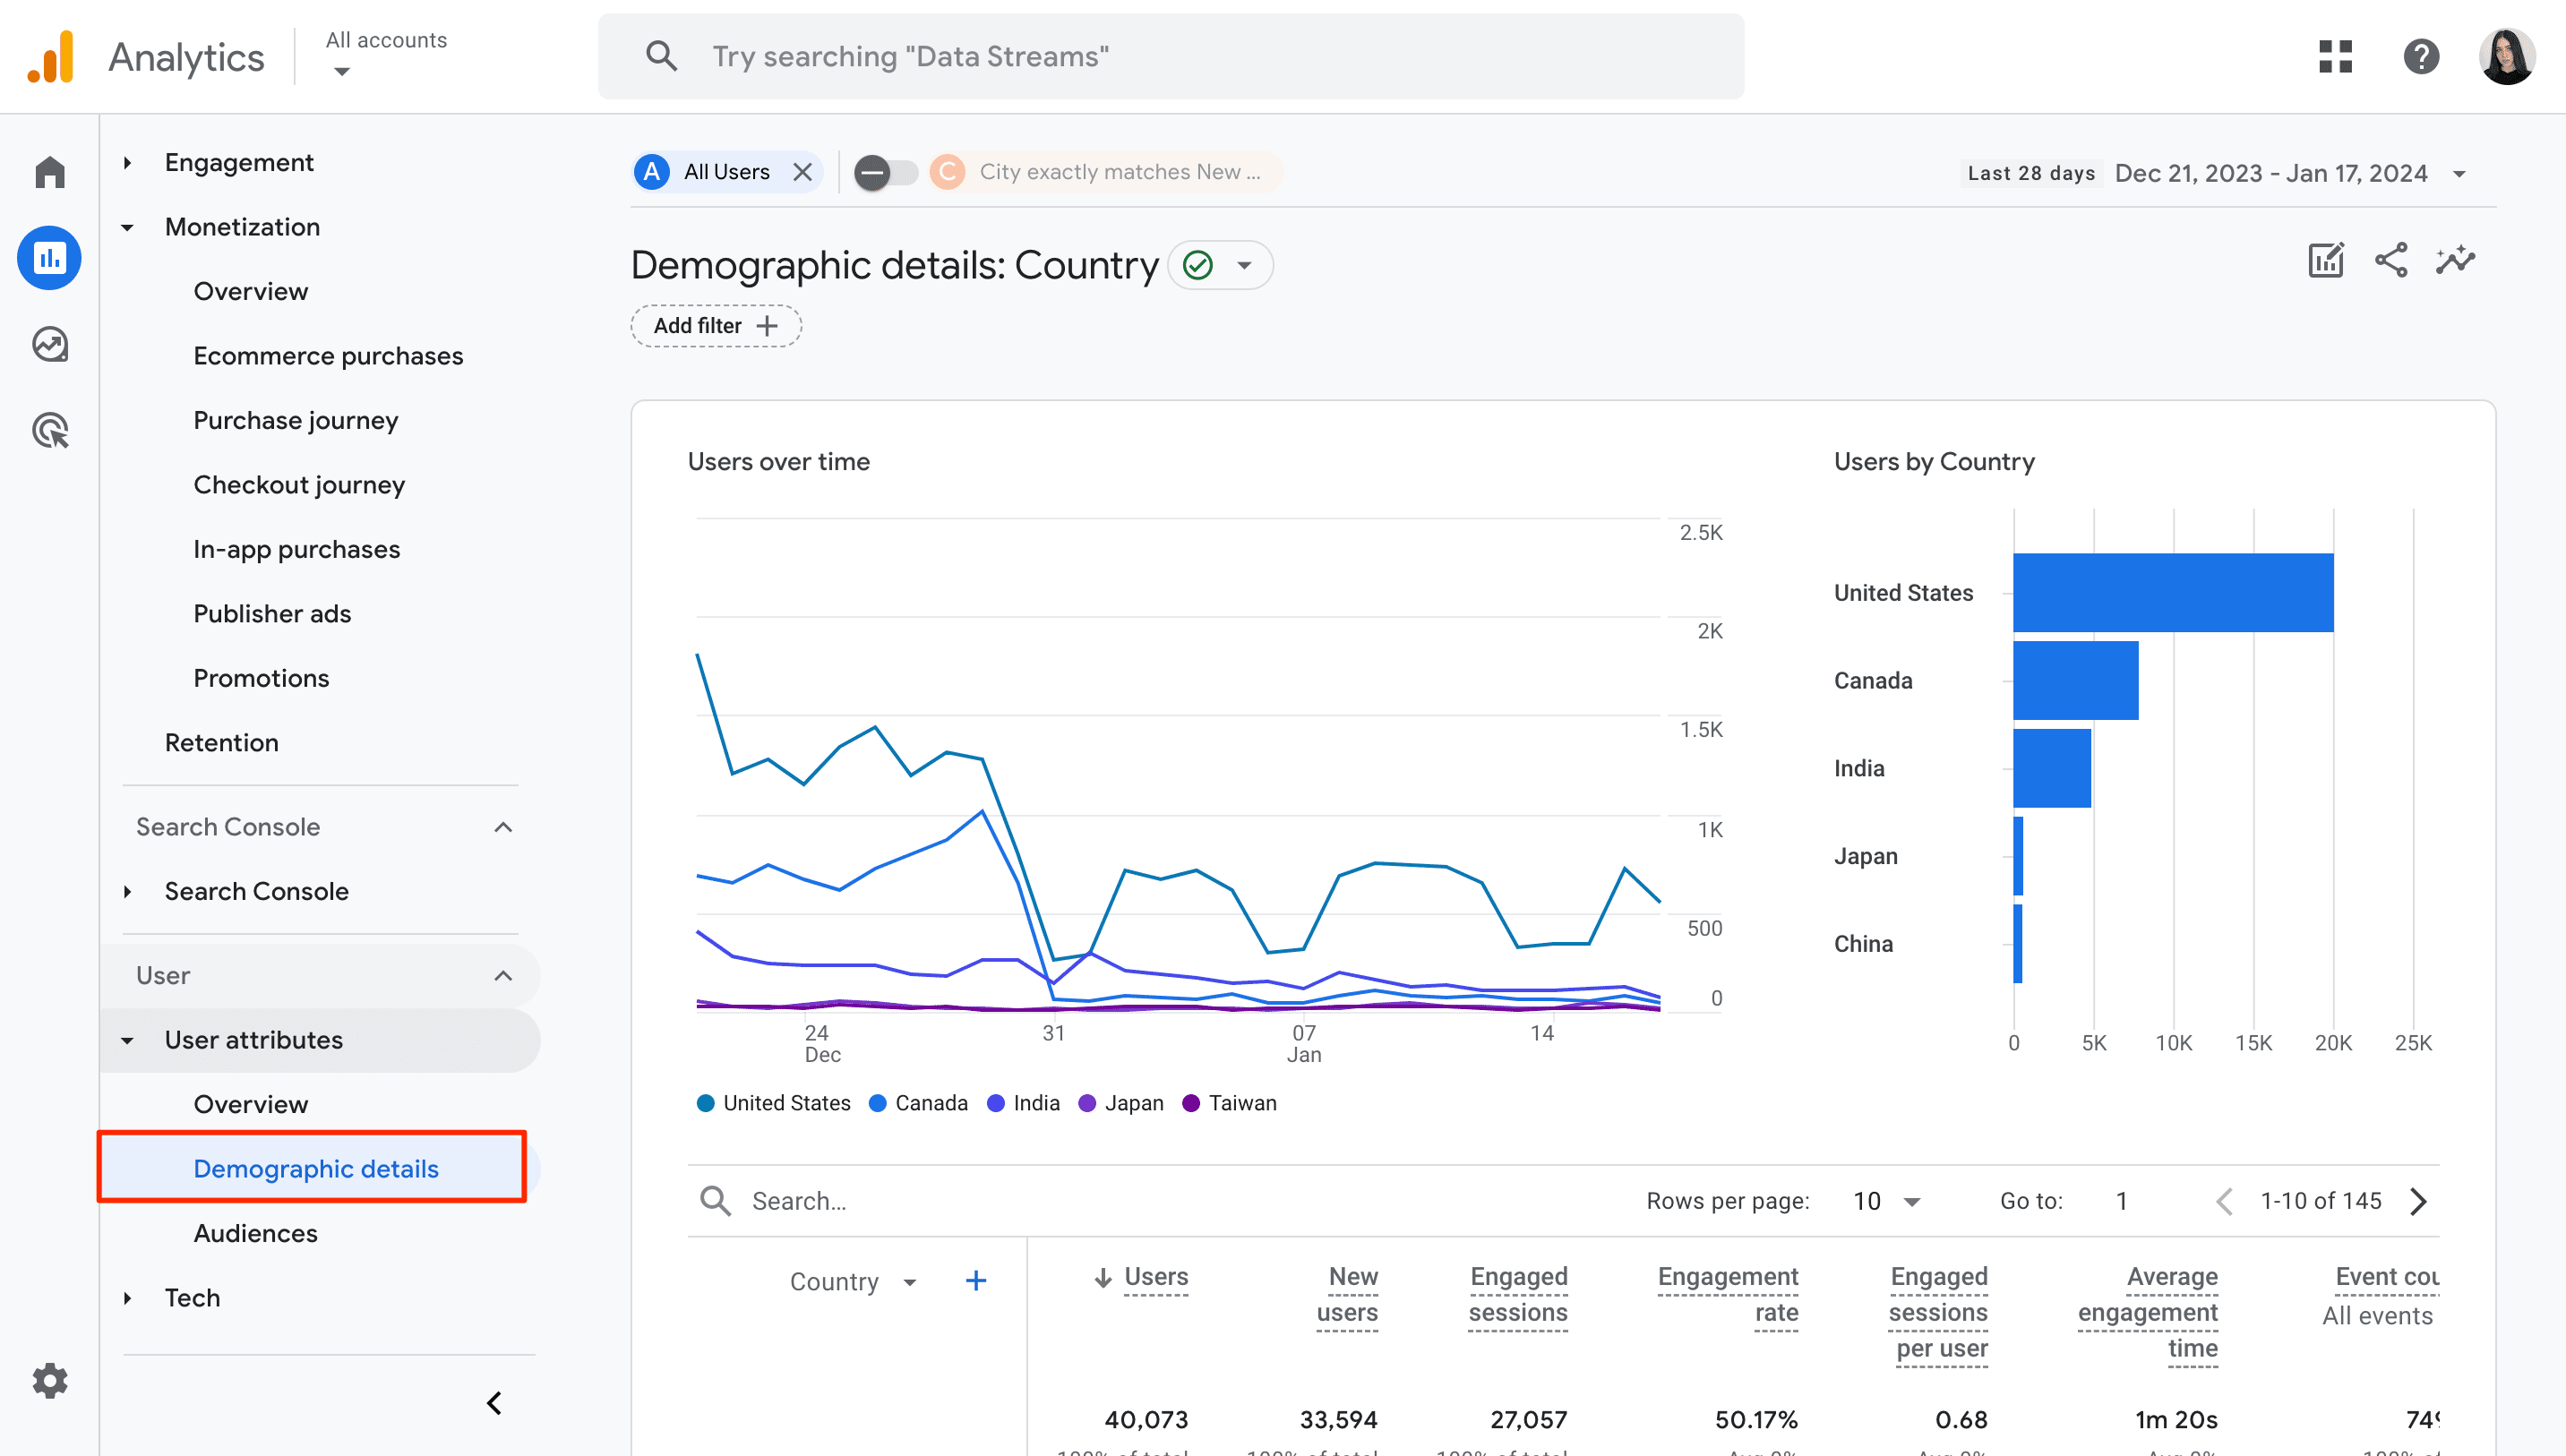
This report can be useful for the following ecommerce purposes:
- Tailoring campaigns based on user demographics.
- Adjusting offerings to match user interests.
- Optimizing the platform for specific demographic groups.
- Implementing language and region-specific tactics.
- Allocating budget efficiently by targeting relevant audiences.
- Creating personalized content for better interactions.
- Ensuring data collection adheres to privacy standards.
To enhance your ecommerce strategy, consider integrating GA4 data with reliable SEO tools, especially ones that offer more advanced features. This will enable you to check website traffic, analyze competitor websites, and get insights into aspects like keyword research, backlink analysis, traffic forecast, and more. By combining both internal and external insights, you can build a robust framework around your ecommerce business.
The Explore Section
Standard GA4 reports provide unbeatable insights into your website traffic. However, to answer complex questions and access more in-depth analytical techniques that aren’t available in standard reports, you can use Explorations.
Exploratory Analysis
Exploratory analysis lets you perform tasks like creating customized customer segments, performing ad-hoc analysis, and identifying untapped marketing opportunities. To create this report, click the Explore section in the left-hand navigation menu.
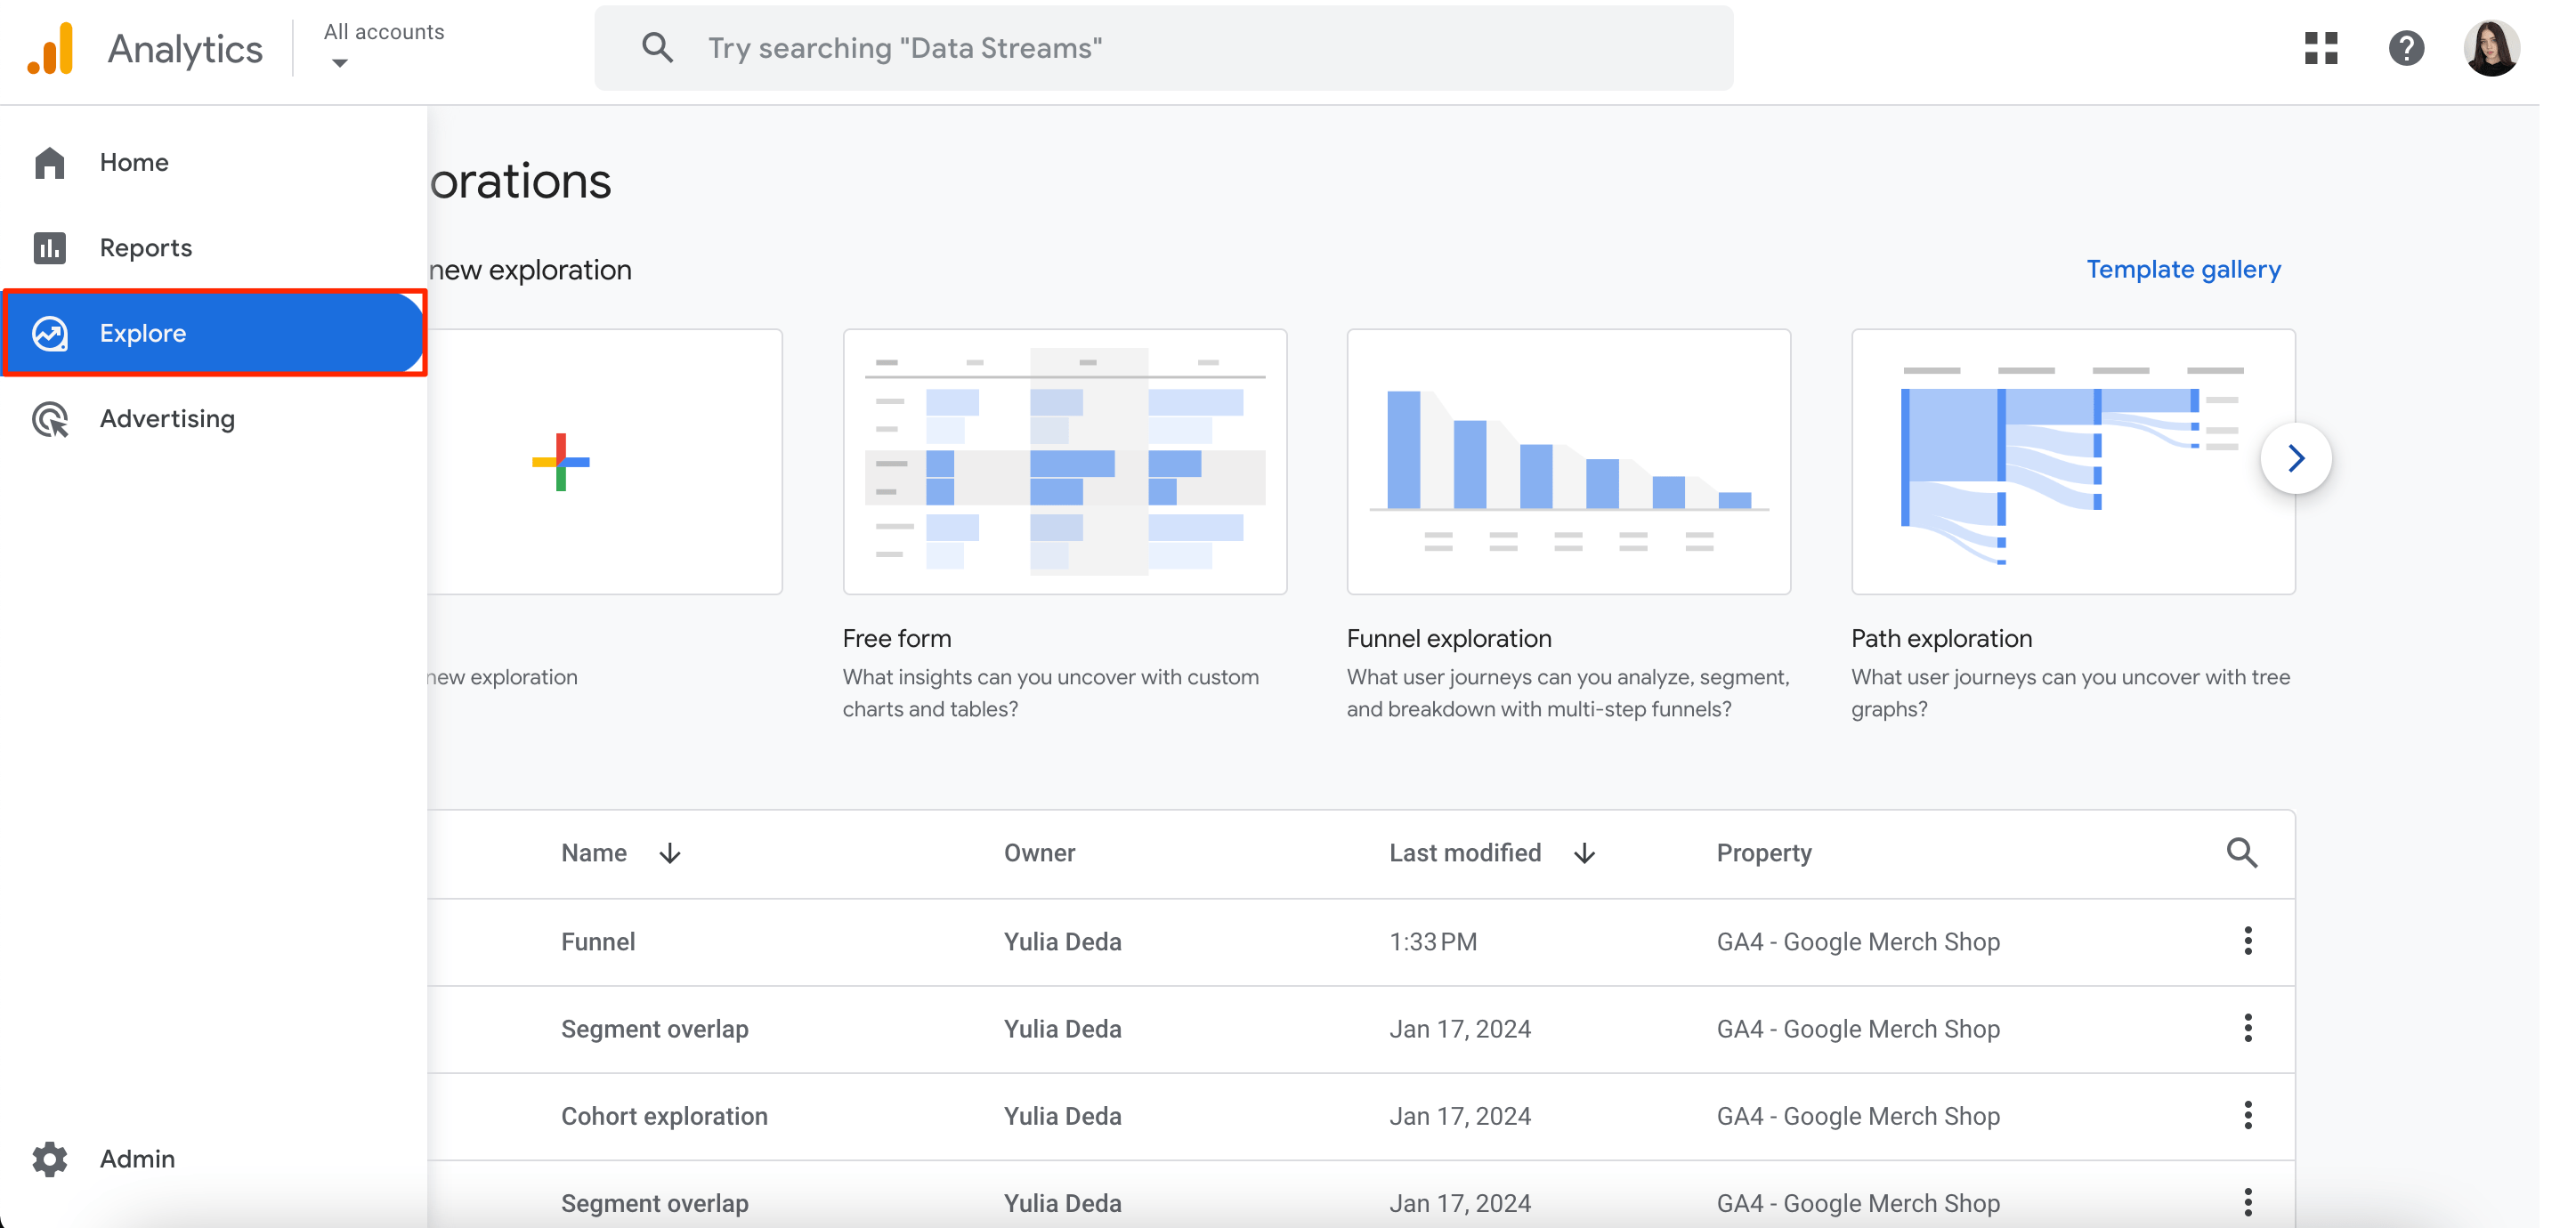
It’s time to select the most suitable technique for your report. This could be:
- Free-form exploration (creating custom charts and tables)
- Cohort exploration (studying grouped user behavior patterns)
- Funnel exploration (analyzing step-by-step user conversion)
- Segment overlap report (identifying shared characteristics across segments)
- User exploration report (in-depth analysis of individual user journeys)
- Path exploration report (examining sequential user interaction paths)
- User lifetime report (tracking user engagement over time)
Let’s use the funnel exploration technique as an example. When you open this report, you will find a panel on the left with different dimensions, metrics, and segments that you may use for exploration. You can also change the timeframe of the exploration.
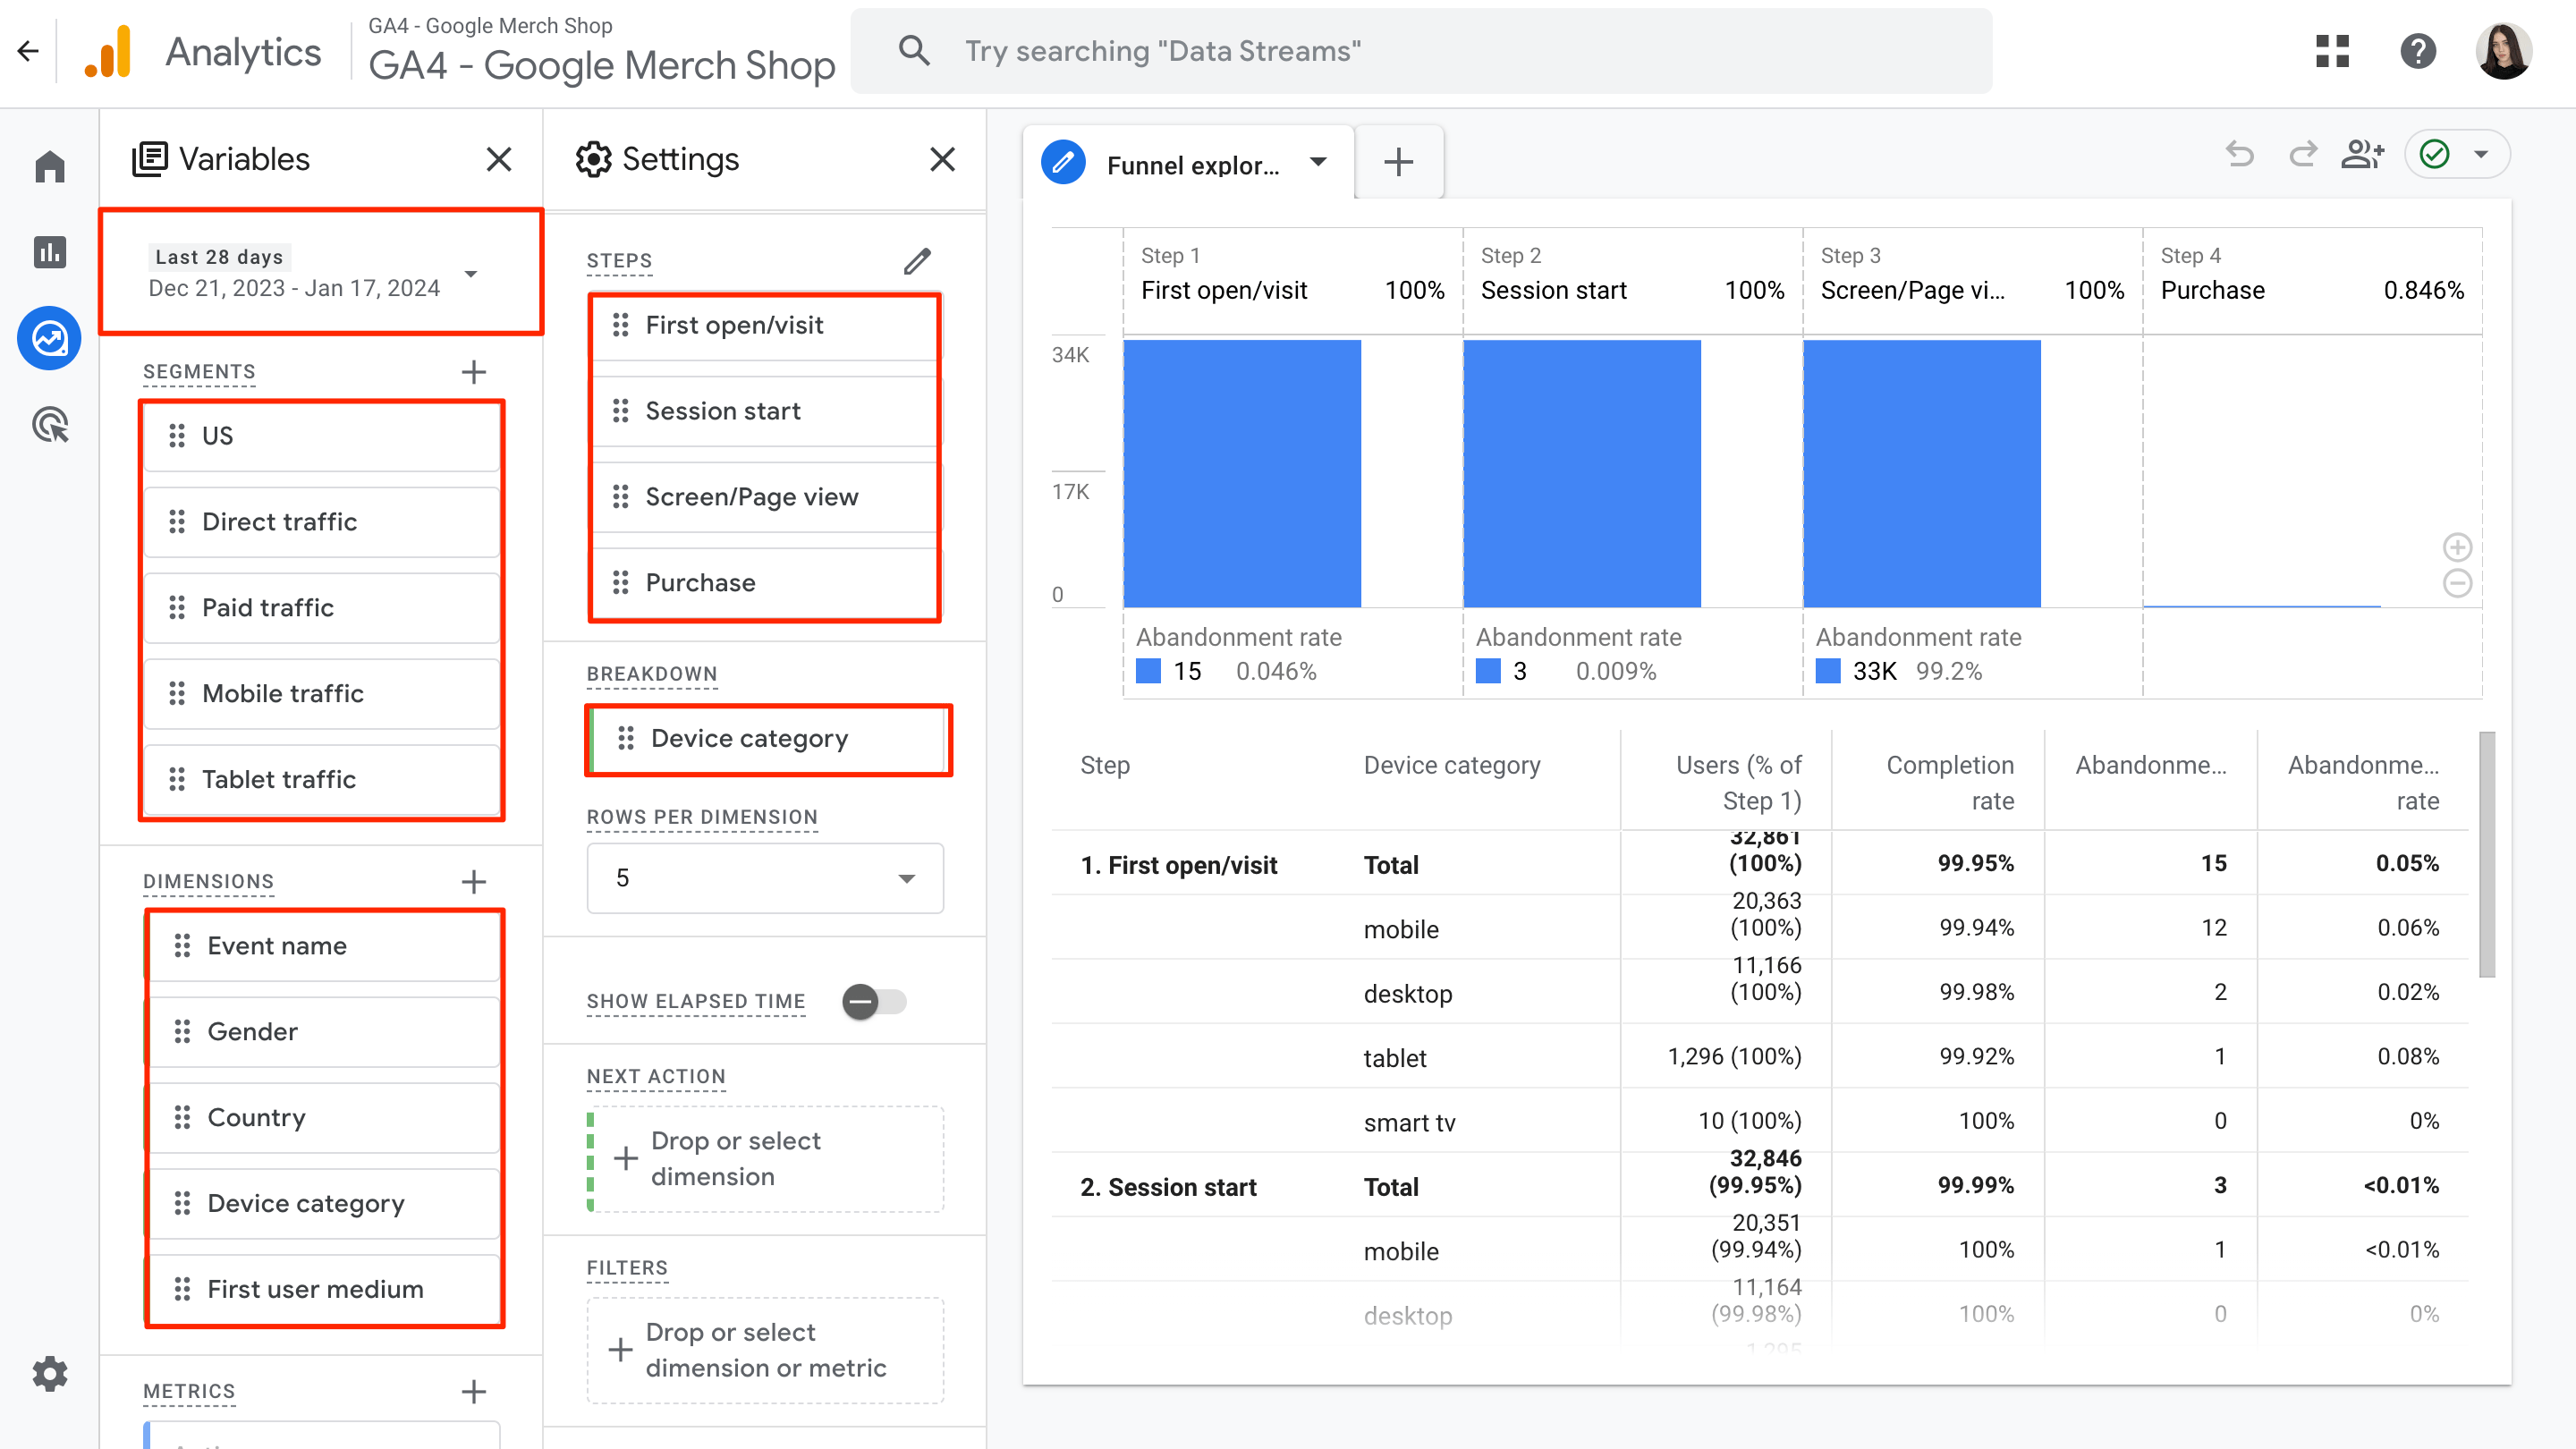
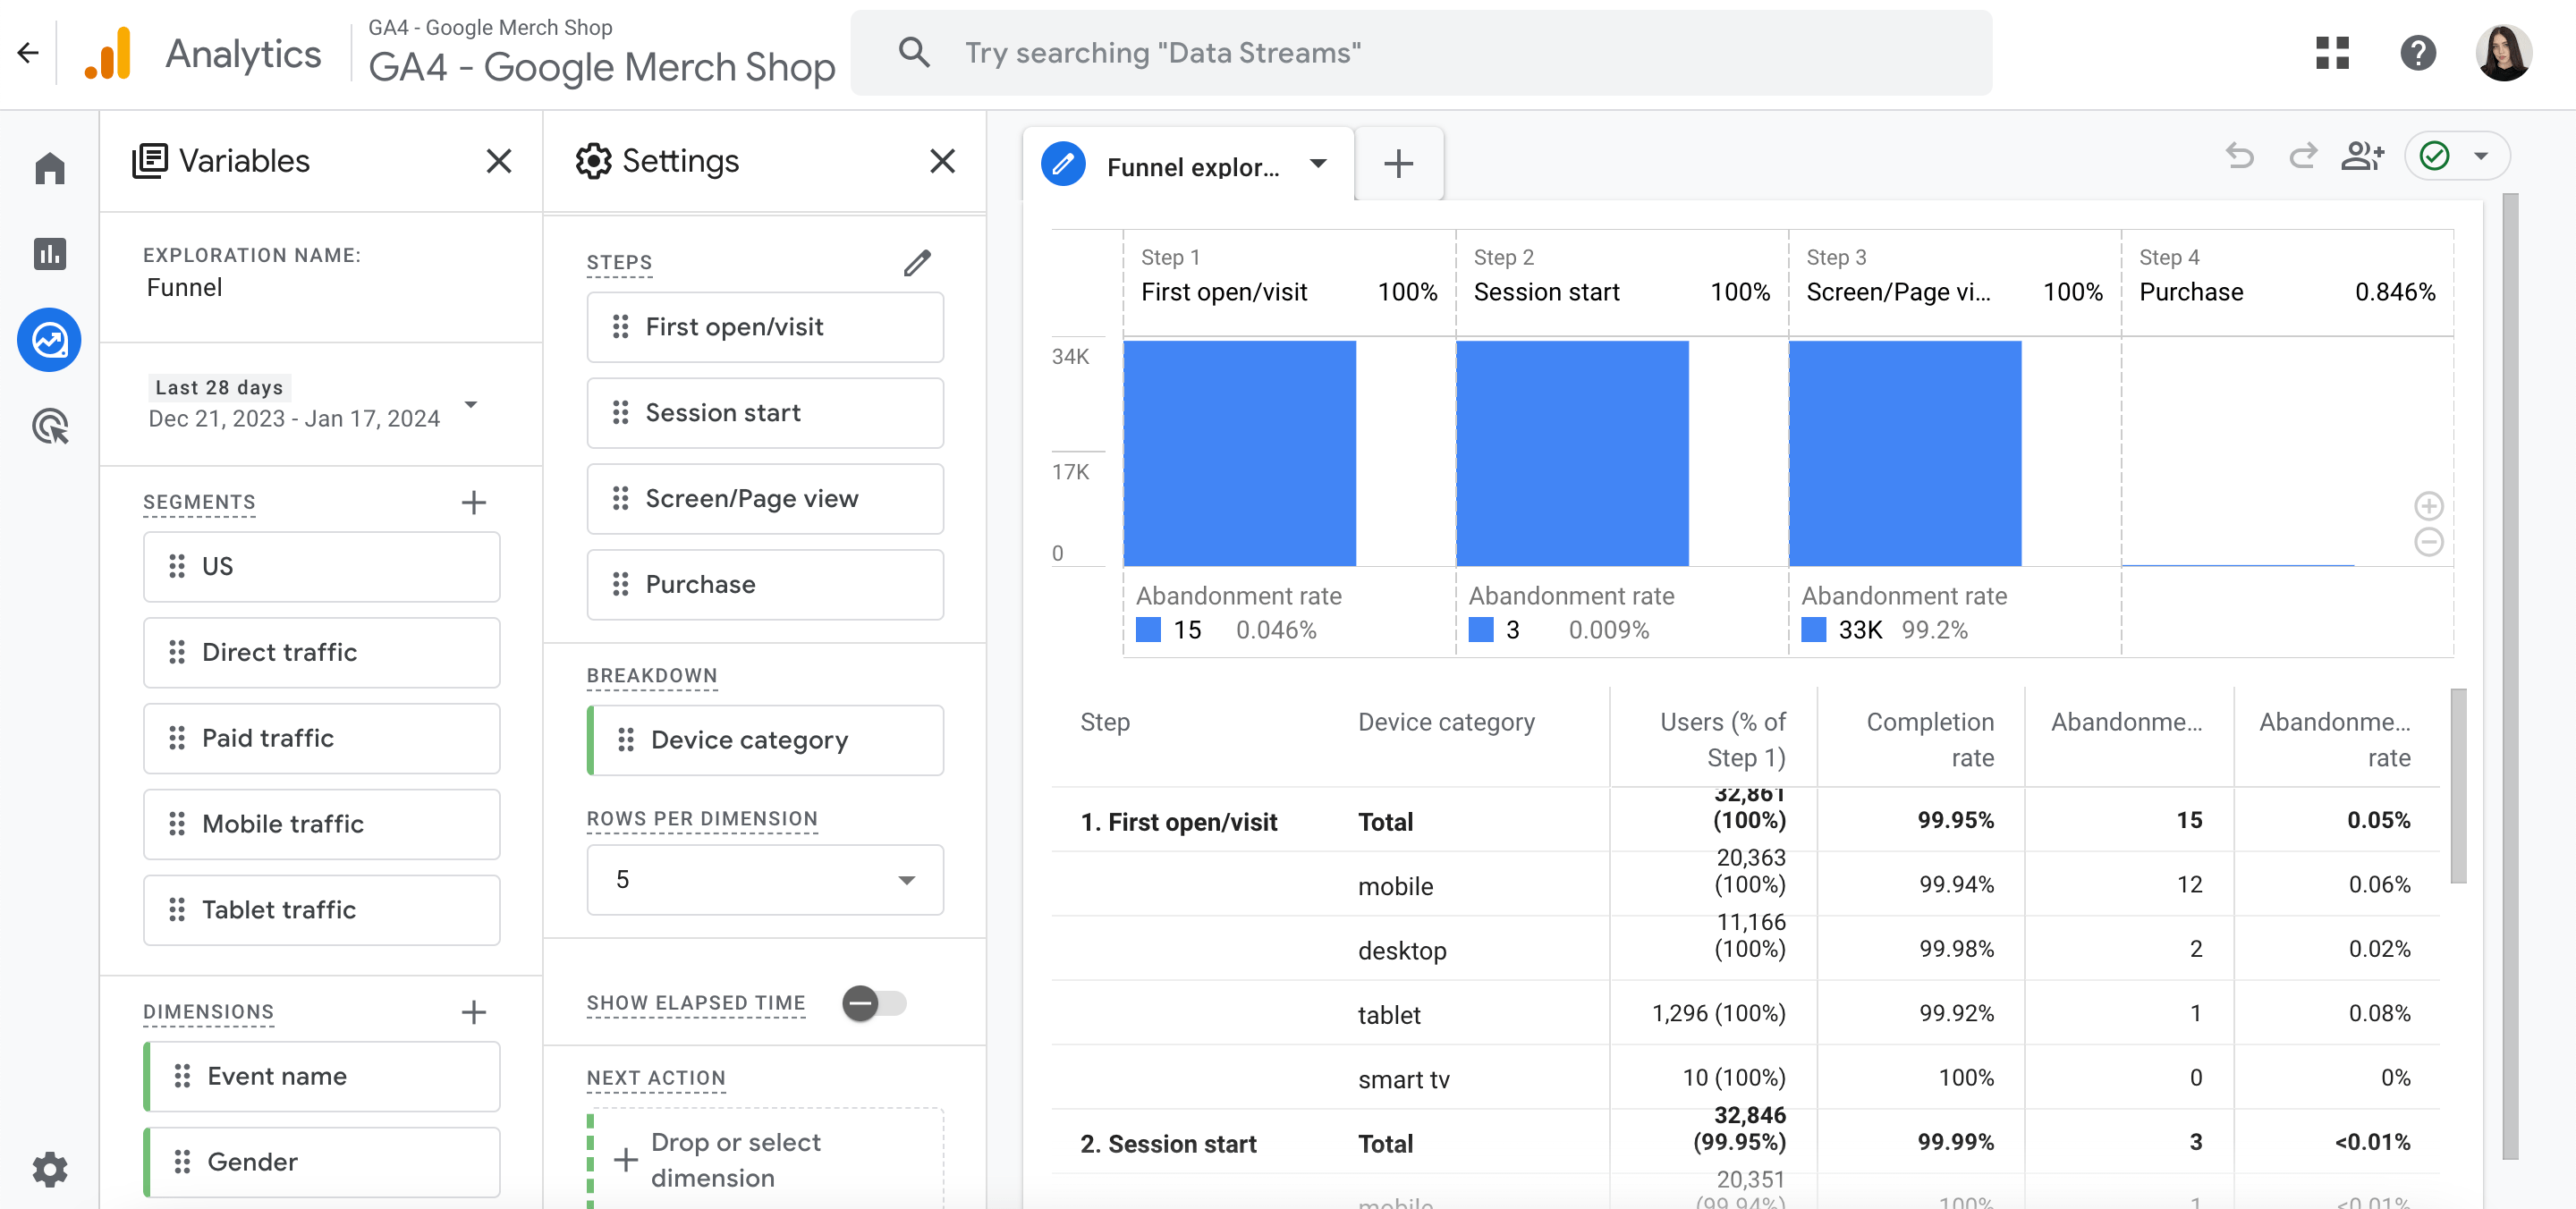
This is where you can see your website’s abandonment rate and where users drop off during the purchasing process. The tool also lets you divide these users by device type.
By identifying the stages at which people abandon tasks prematurely or make purchase adjustments, you can find new ways to increase the number of people who complete a purchase.
Segment Overlaps
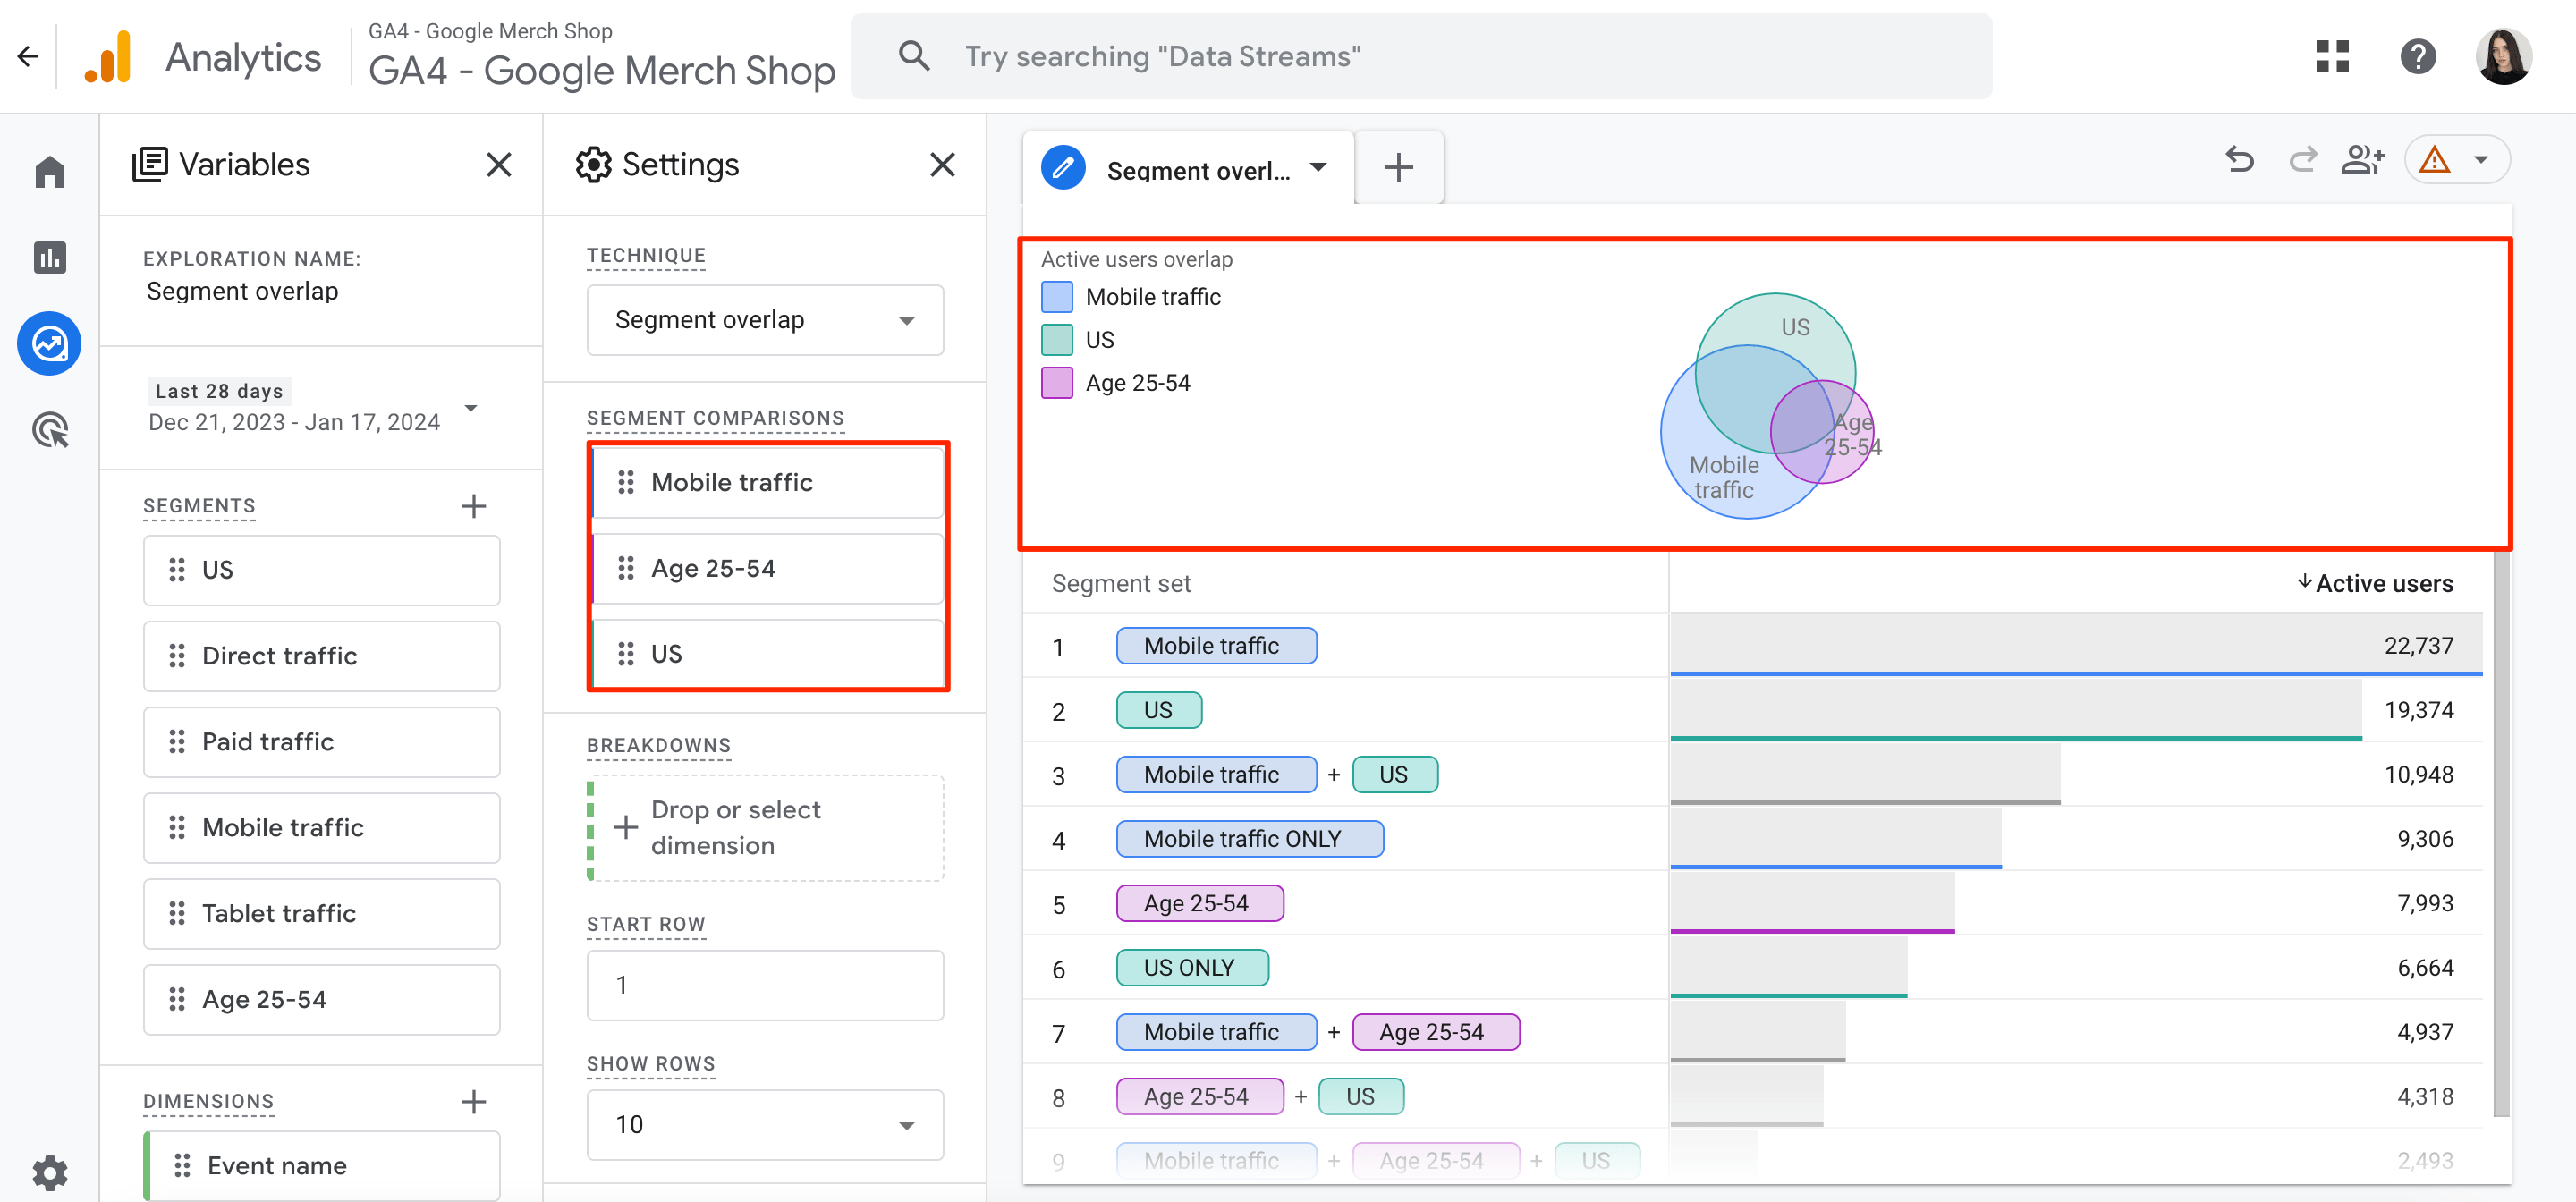
This approach allows you to compare up to three user segments and examine the overlap and connections between them. You can then use this information to personalize your marketing to specific groups and investigate their behavior further in later reports.
The example below of a ‘segment overlap exploration’ looks at the intersection of the Mobile Traffic, US Users, and Users Aged 25-54:
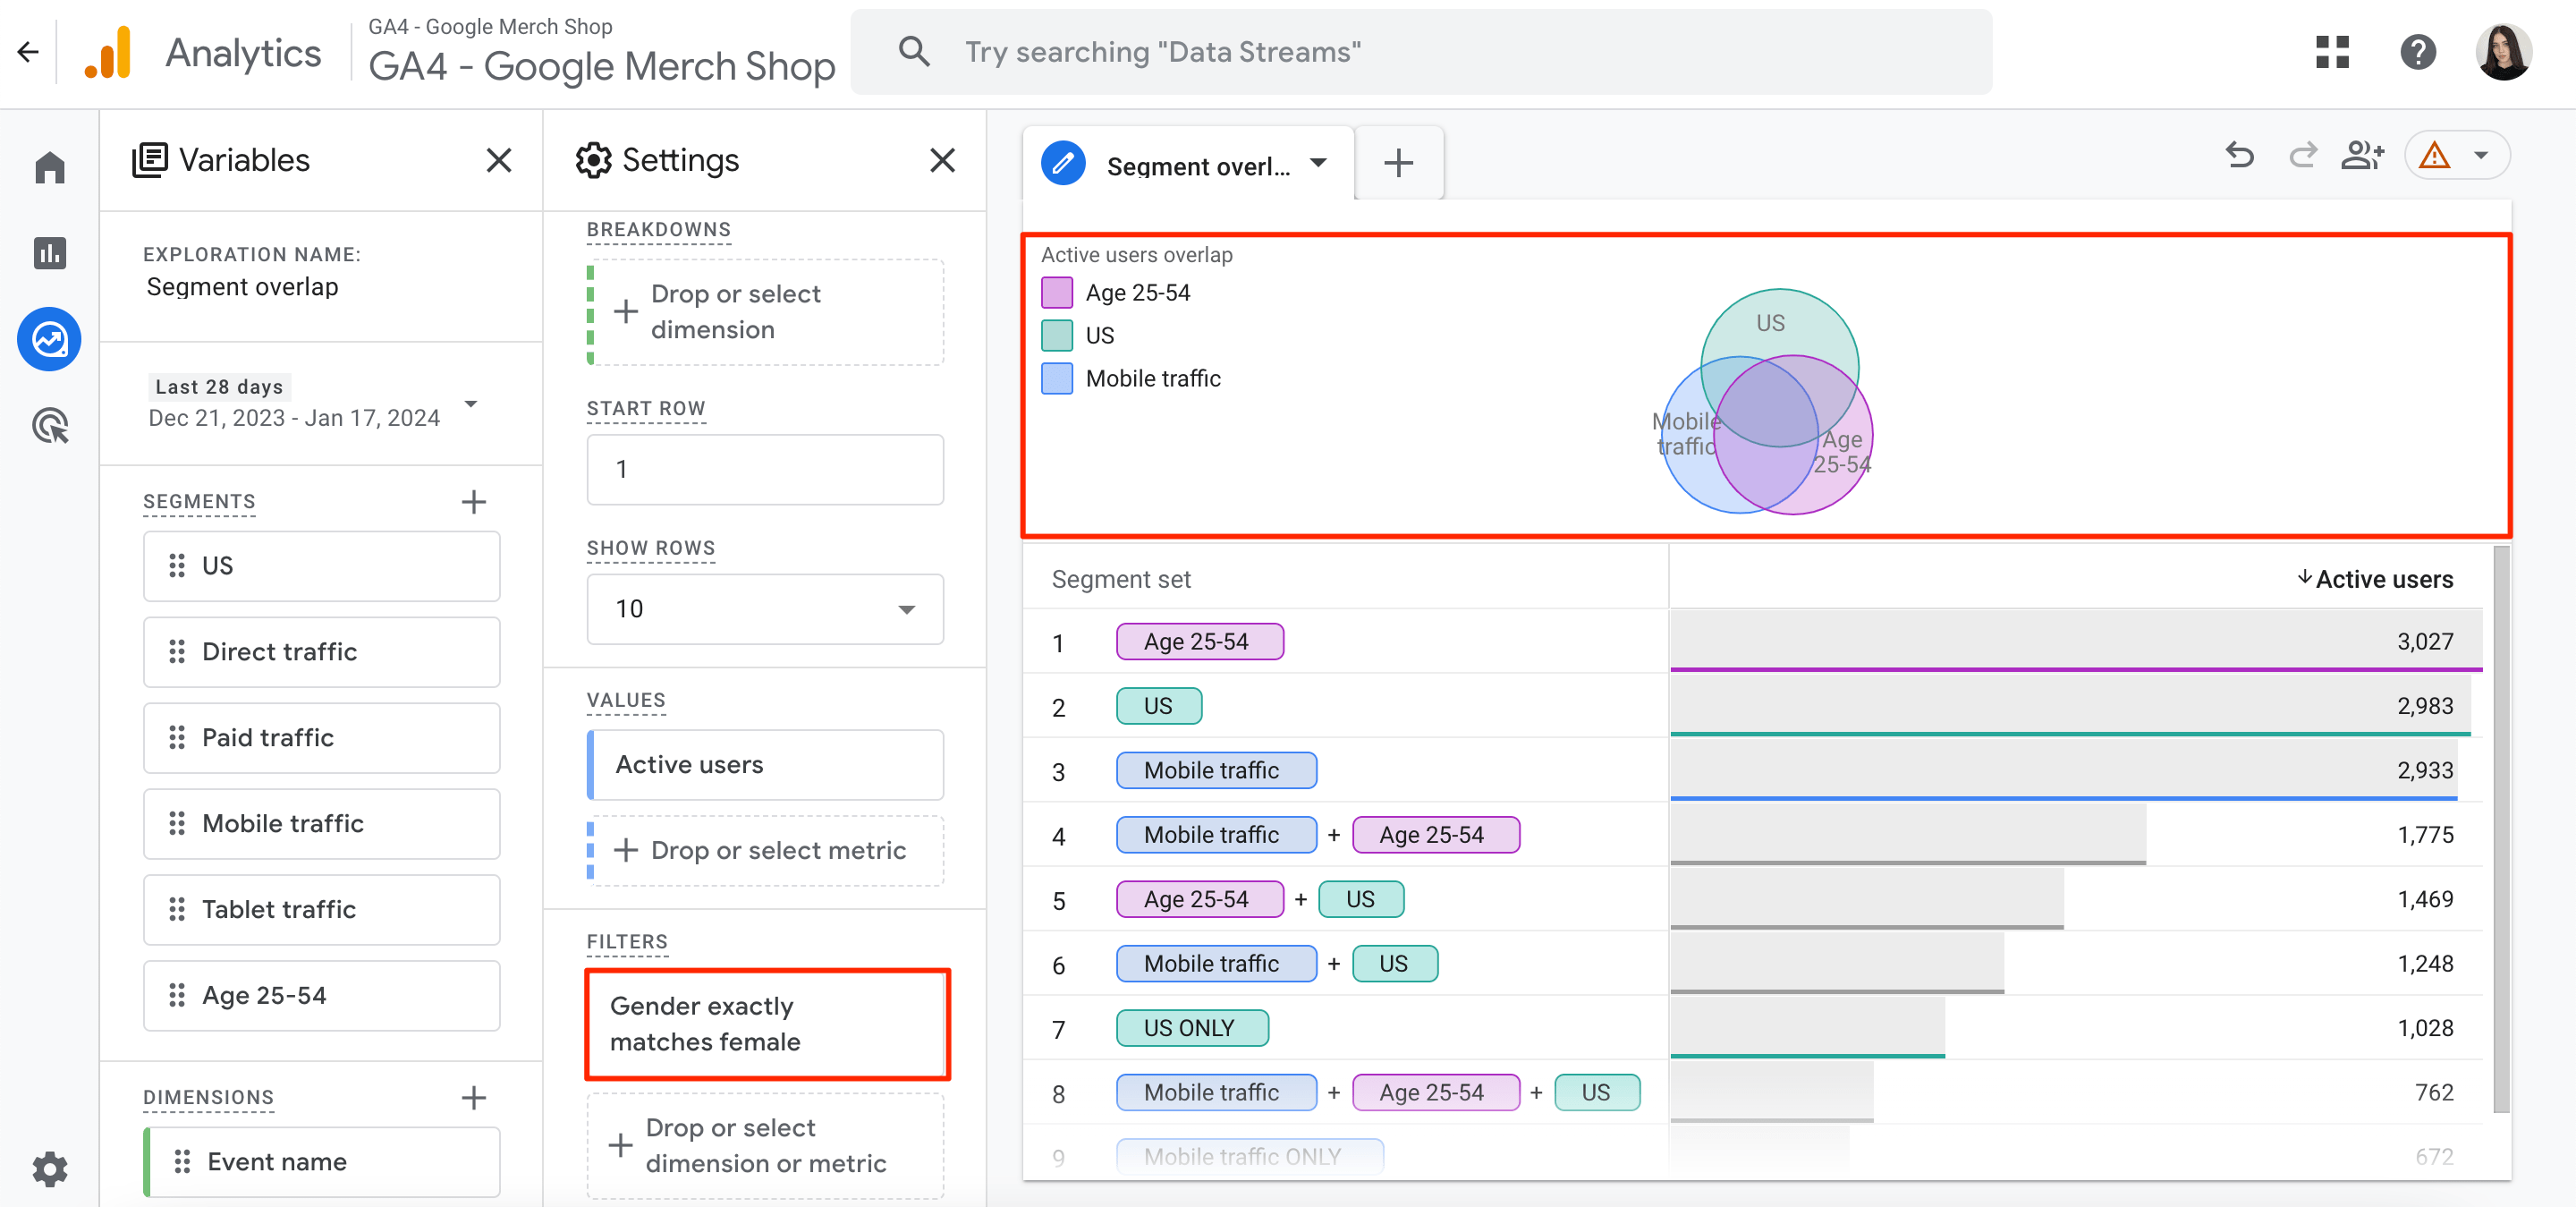
To refine the data, you can add filters. For instance, you can filter out your results by gender. This is how our diagram would look if we added the filter where gender exactly matches female:
Cohort Exploration
Imagine your users grouped by common features such as signup date. Cohort exploration then analyzes how each group acts (like browsing, buying, or churning) on your platform over time.
To create and configure a cohort exploration report, follow these steps:
1. Go to the Explore section and select Cohort Exploration from the available templates.
2. Set up the report settings, such as the report name and desired date range.
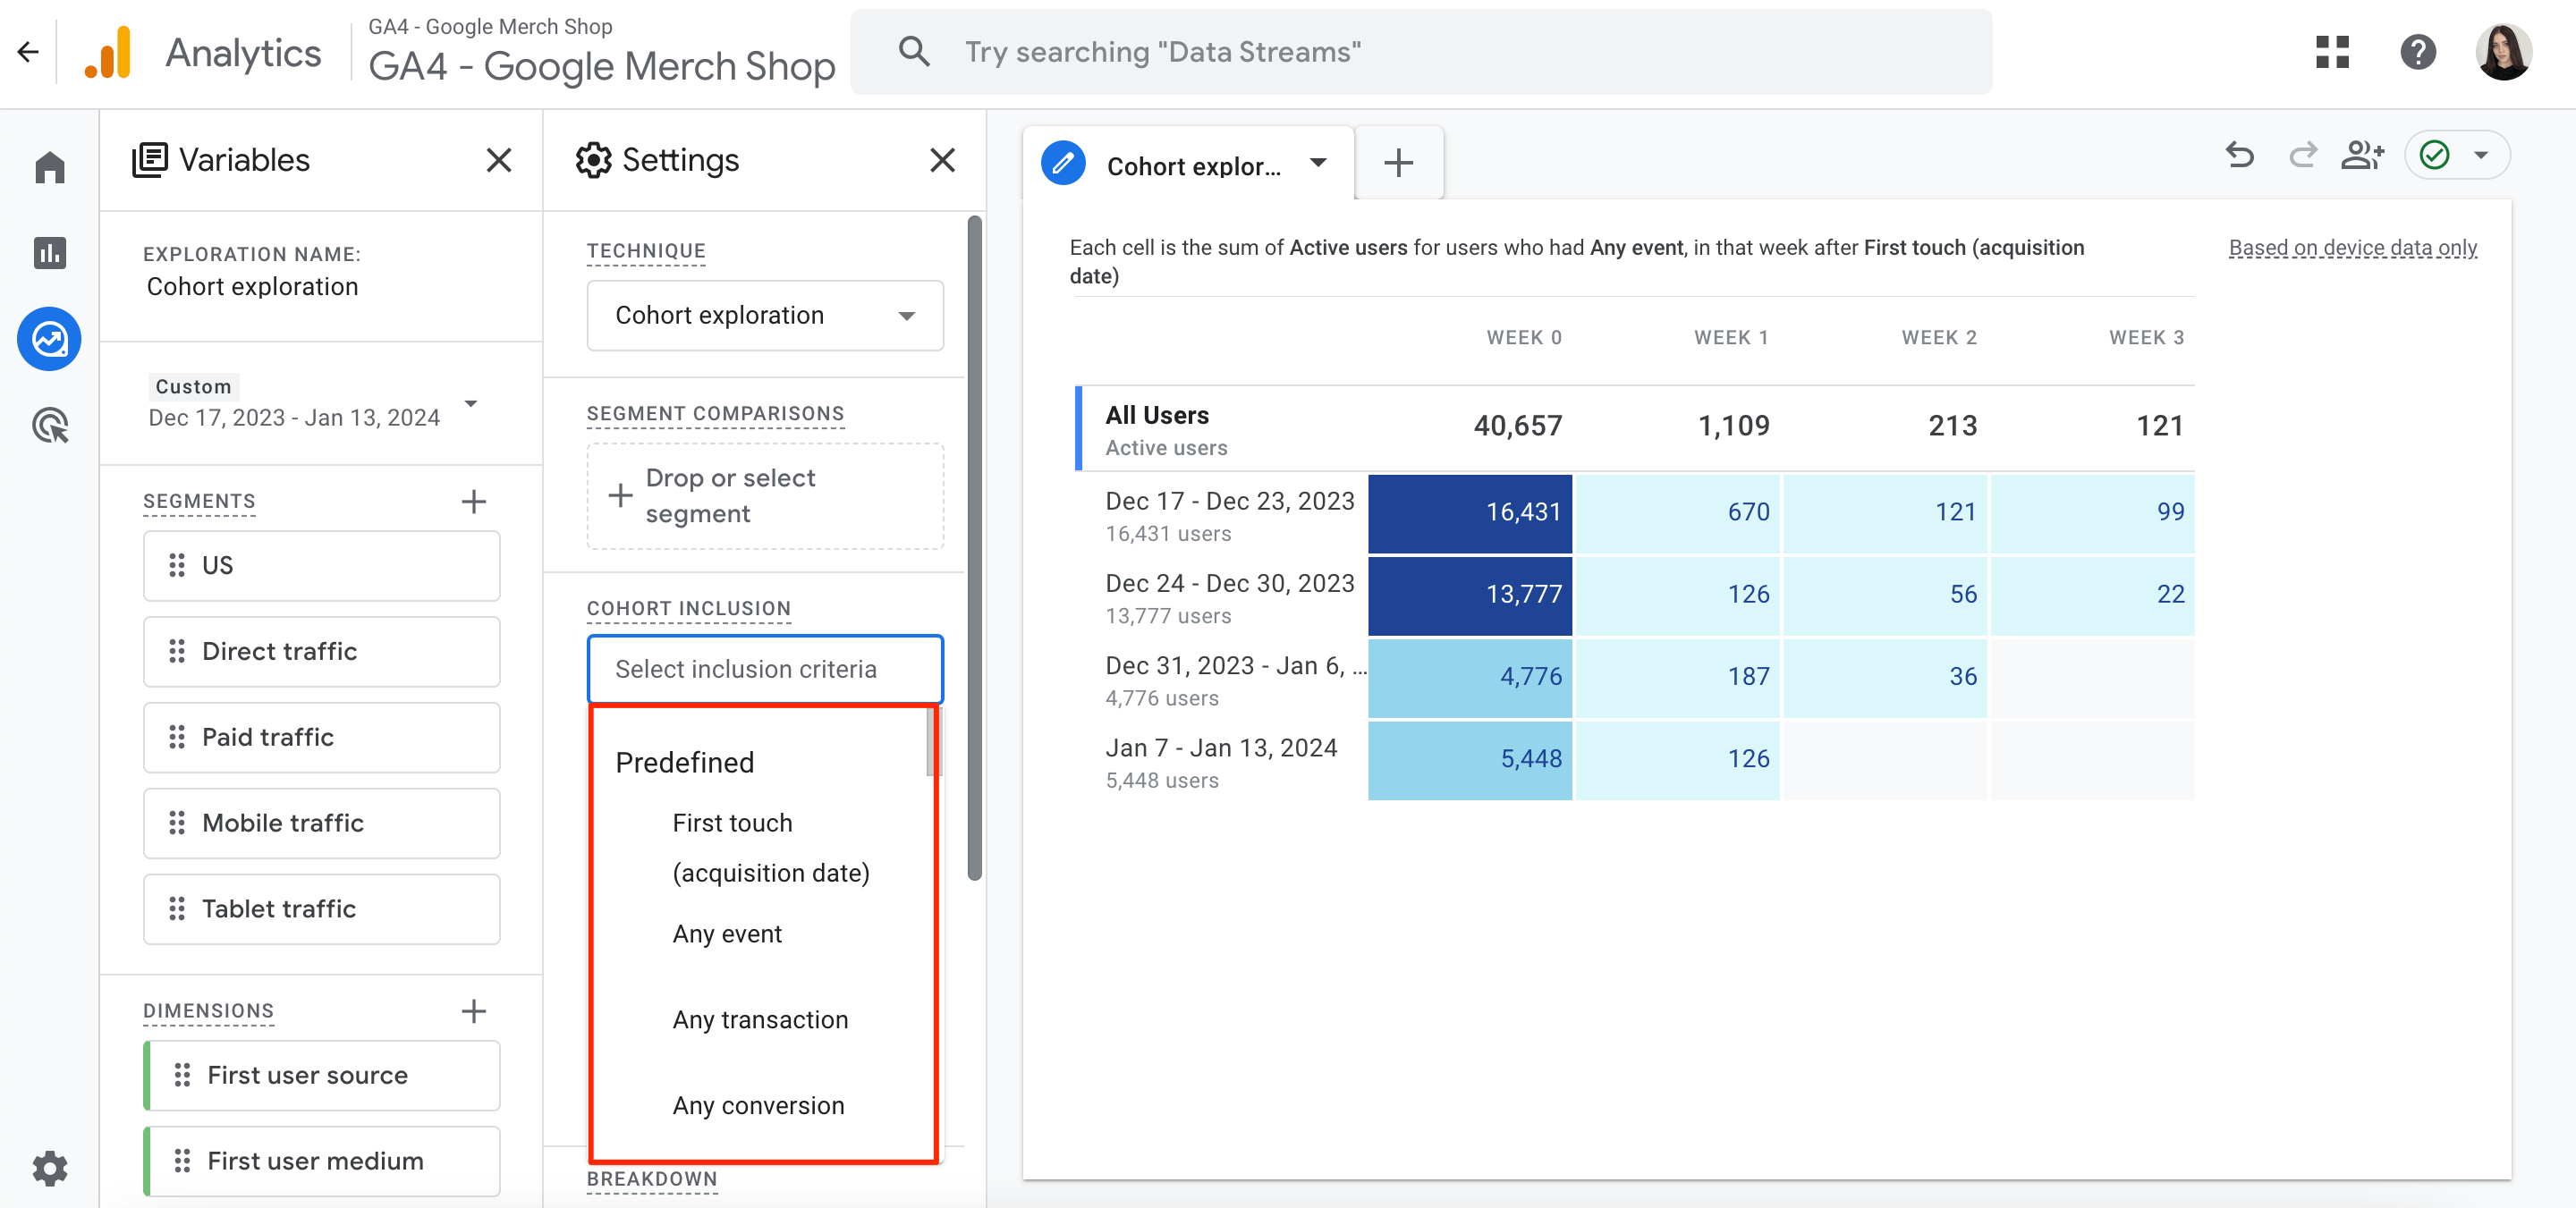
3. In the Cohort Inclusion section, choose one of the following options: First Touch, Any Event, Any Transaction, or Any Conversion. This allows you to control when users are included in the cohorts.
4. Customize your report by configuring the user return window, data grouping (day, week, month), and cohort calculation setting.
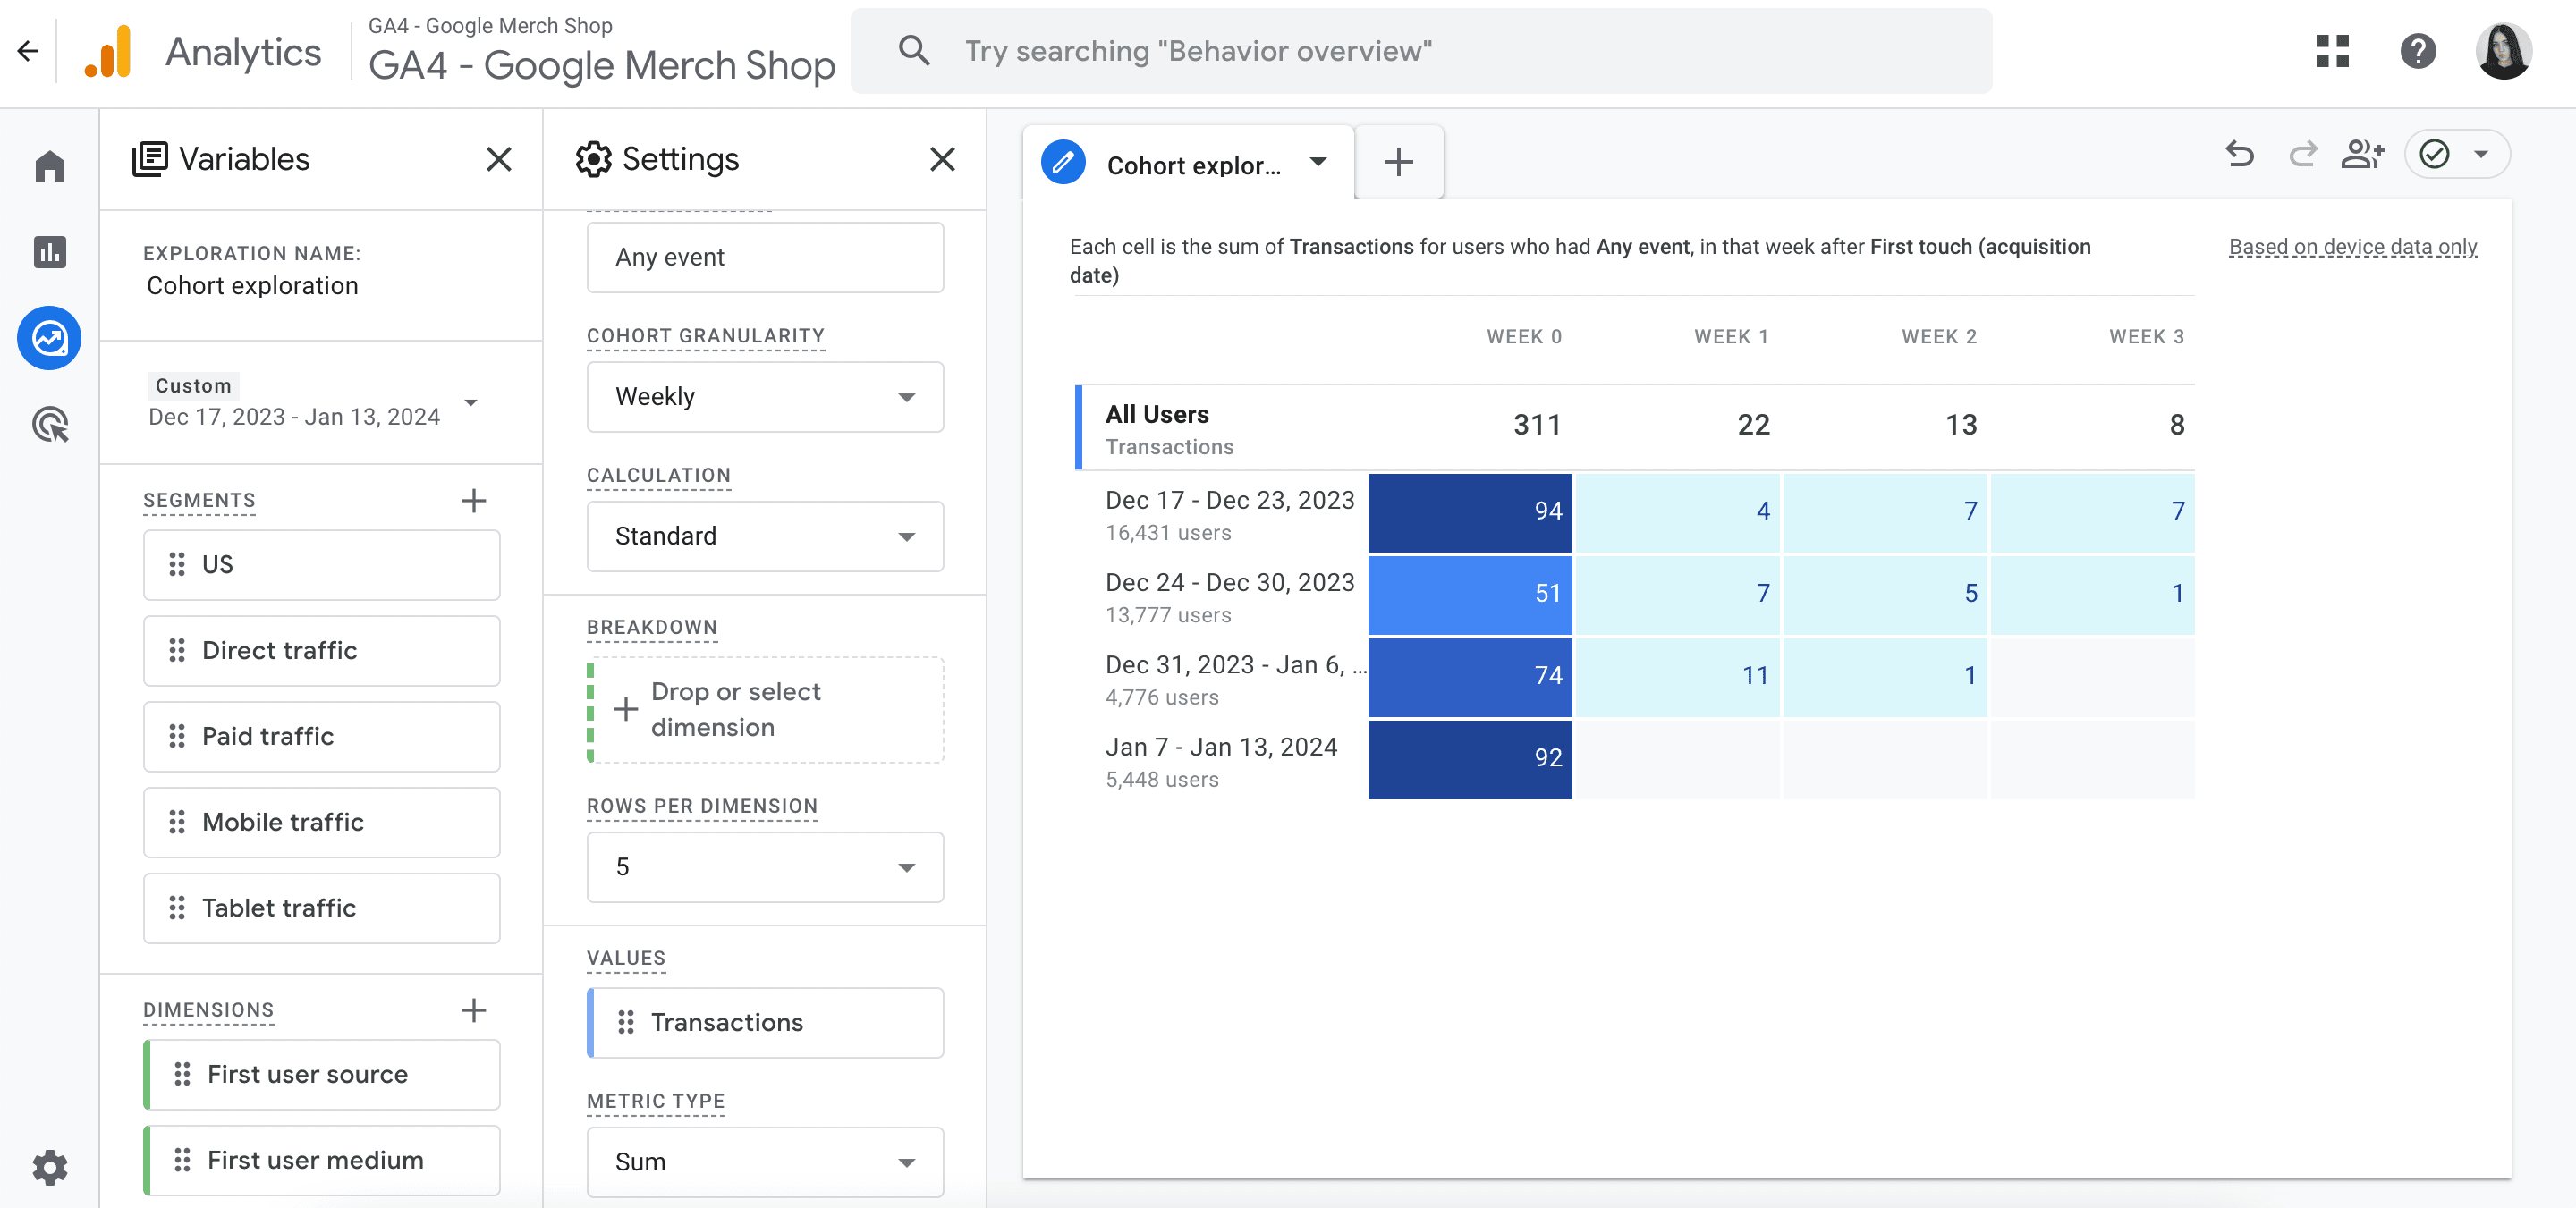
In the screenshot above, we can see that a website acquired 16,431 users between December 17th and December 23rd.
These 16,431 newly acquired users completed 94 transactions within the same week of their acquisition (December 17th to December 23rd).
These same 16,431 users completed only 4 transactions the week following their acquisition (December 24th to December 30th).
Advertising, Events & Google Ads
Using the Advertising section in GA4, you can find answers to the following questions:
- How did different channels like referrals, searches, and ads influence your customers’ conversion journey?
- What’s the typical timeframe between a customer’s first interaction with your brand and their final conversion?
- What are the typical sequences of touchpoints customers experience before converting?
Now, let’s take a closer look at how to use the Advertising section to learn more about your conversion performance and your customers’ purchase journeys.
Conversion Paths
The Conversion Path report can be defined as your cheat sheet. It provides insights into the “how” behind your customers’ conversions. You can use it to identify your customers’ exact steps, from the initial touchpoint to the final purchase.
To get the most out of this report, take the following steps:
1. Click Advertising on the left-hand menu, then go to Attribution>Conversion Paths.
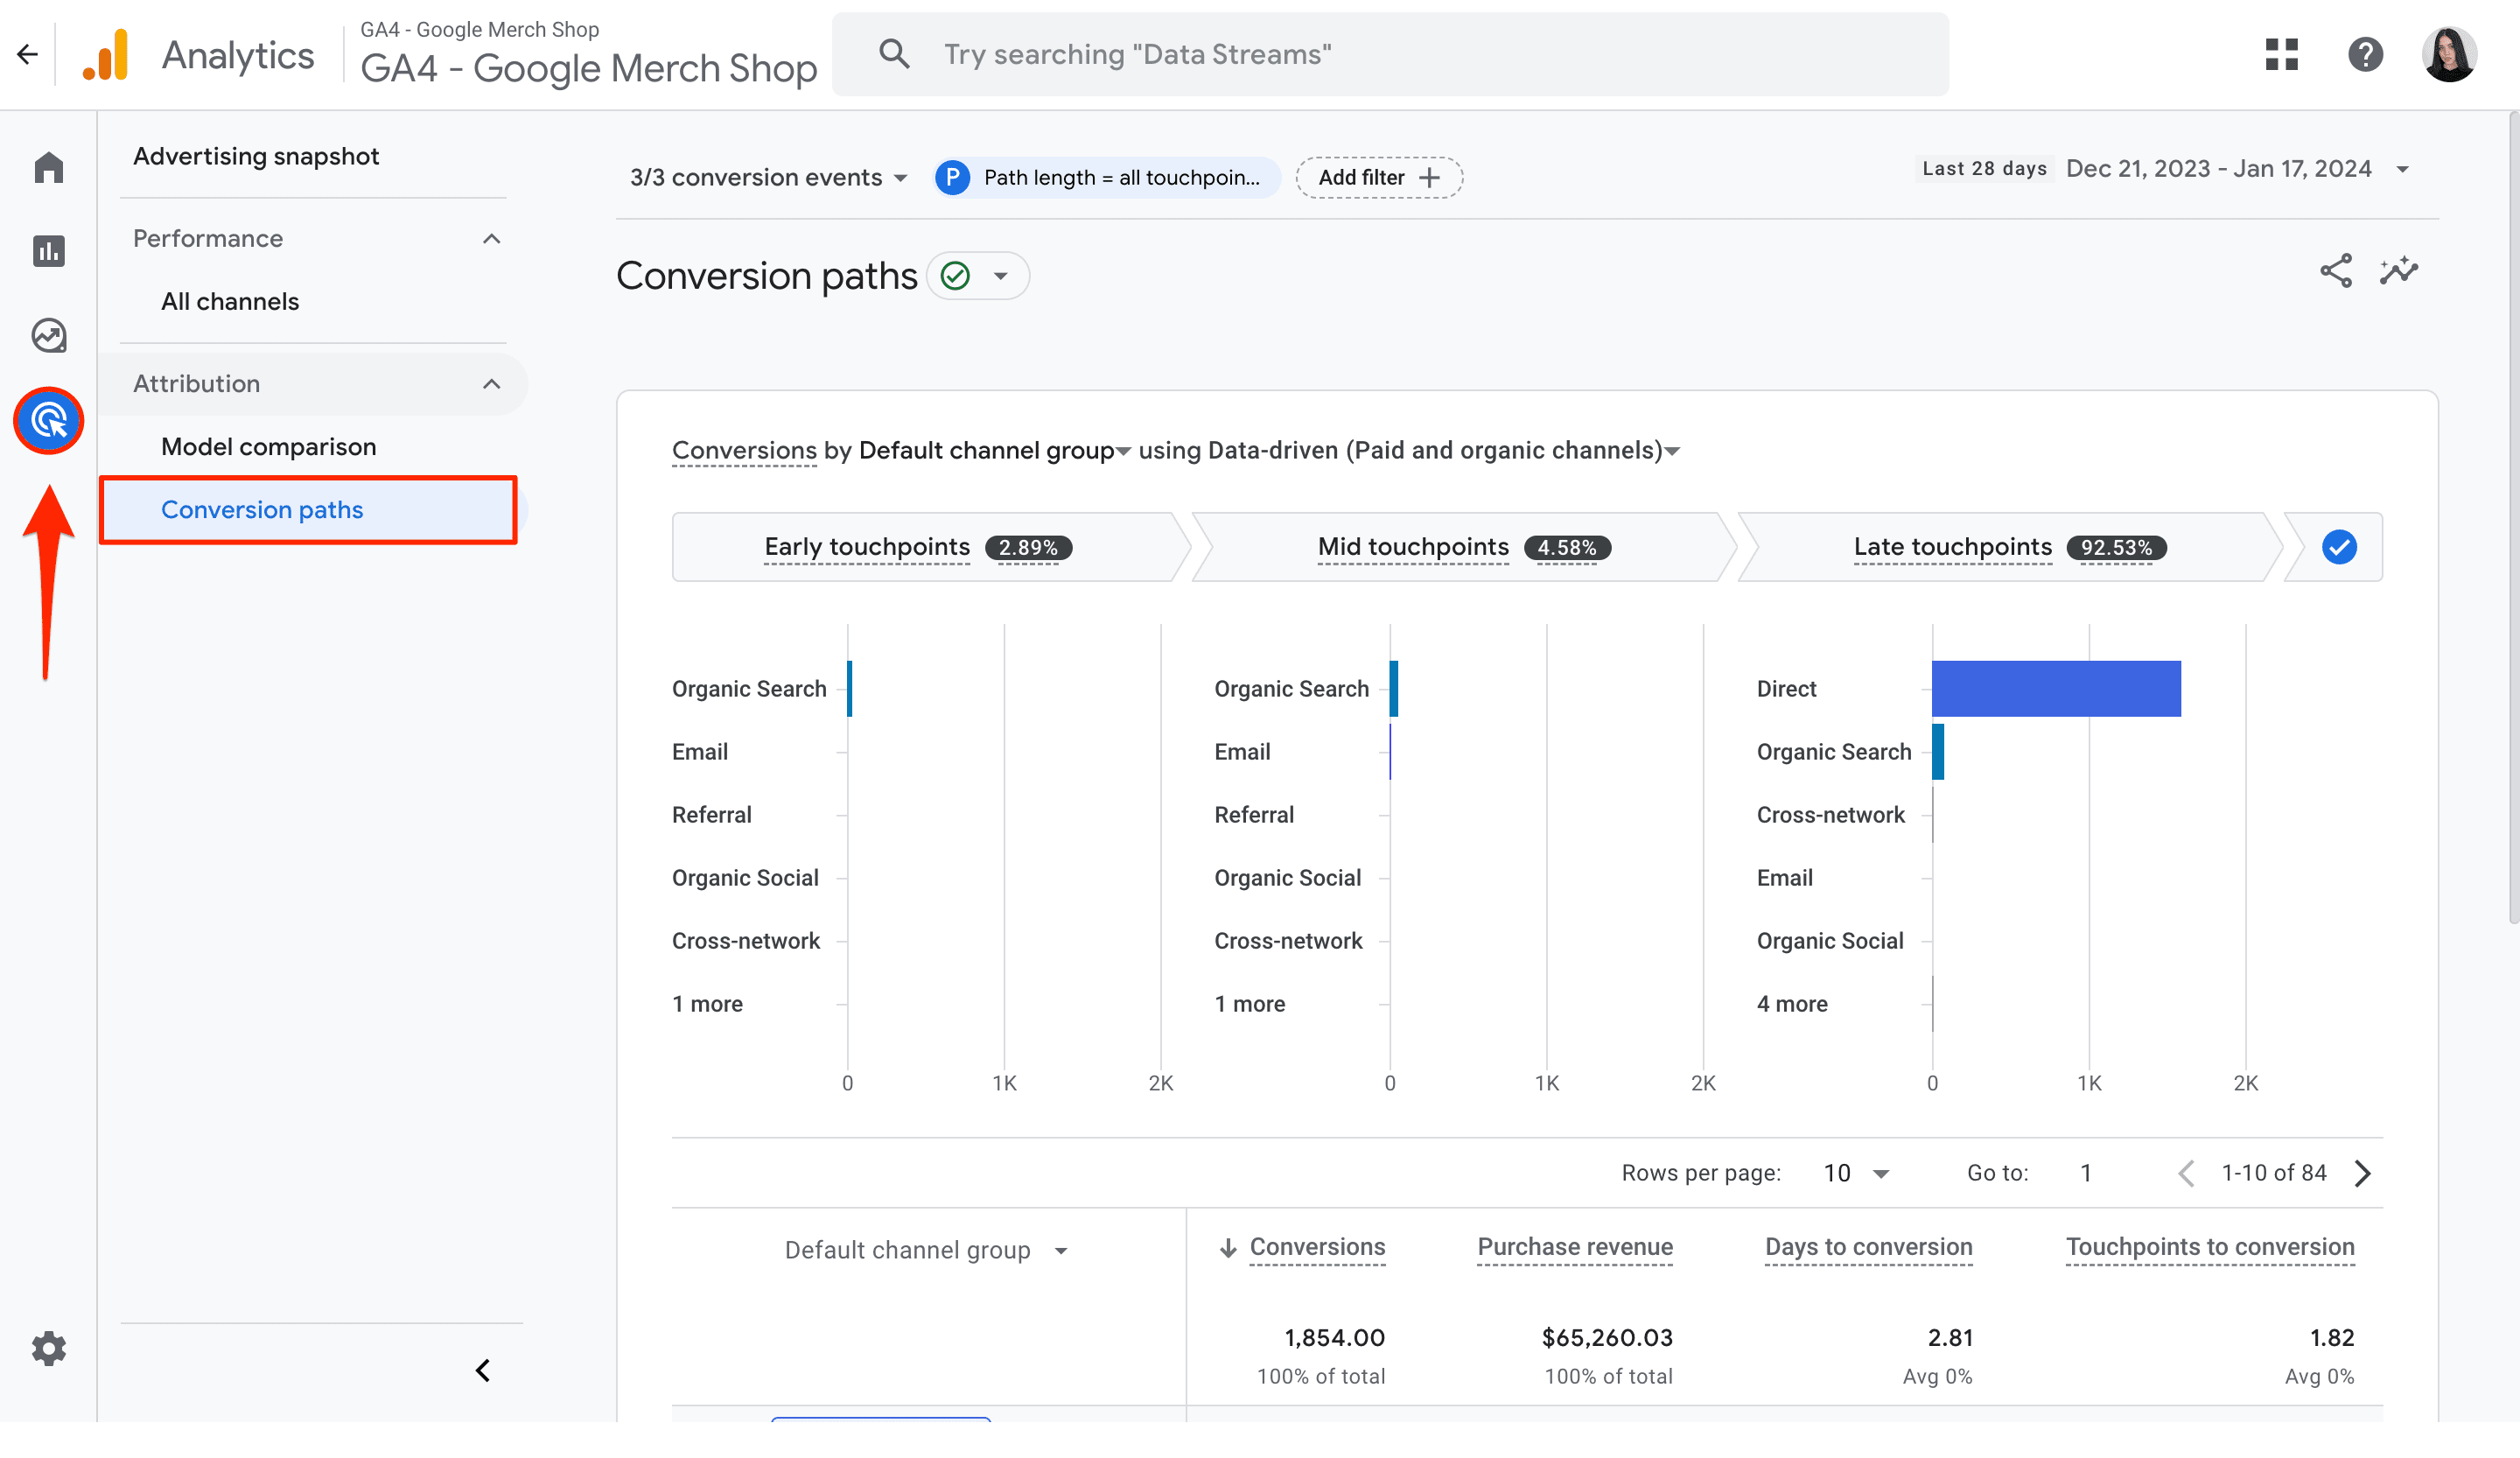
By default, this report includes data for all of your users. To narrow down the results to a specific set of users, click Add Filter at the top of the screen.
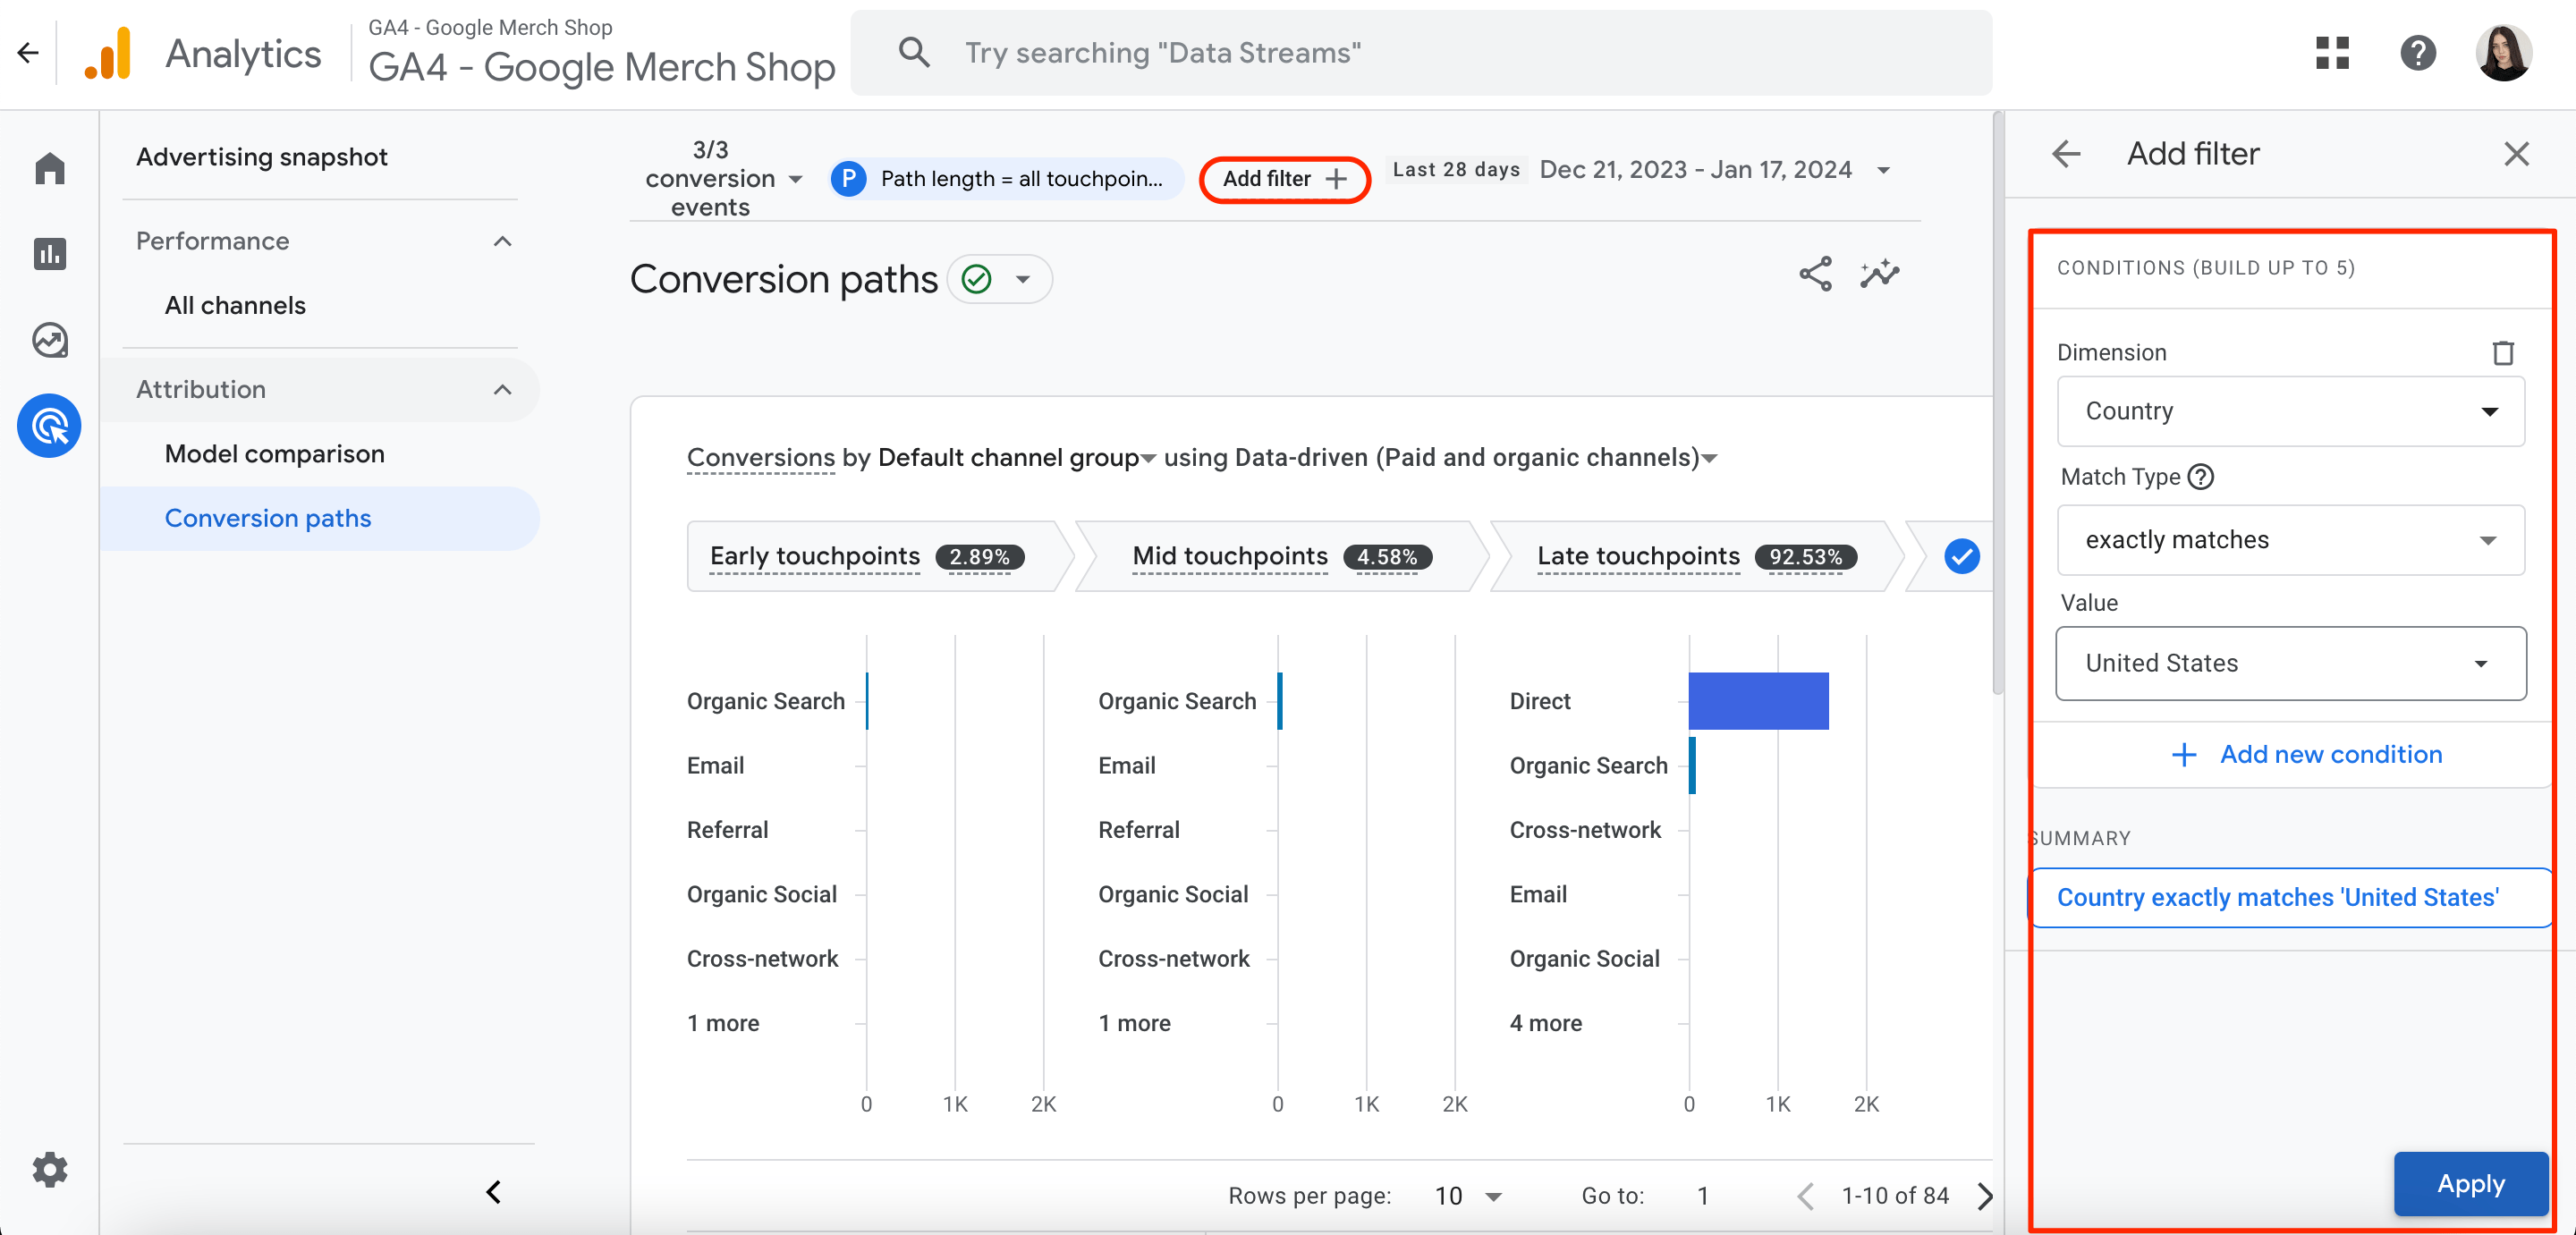
For instance, if you only want to see data on US users, add the filter, select the Country dimension, choose US, and then save these changes.
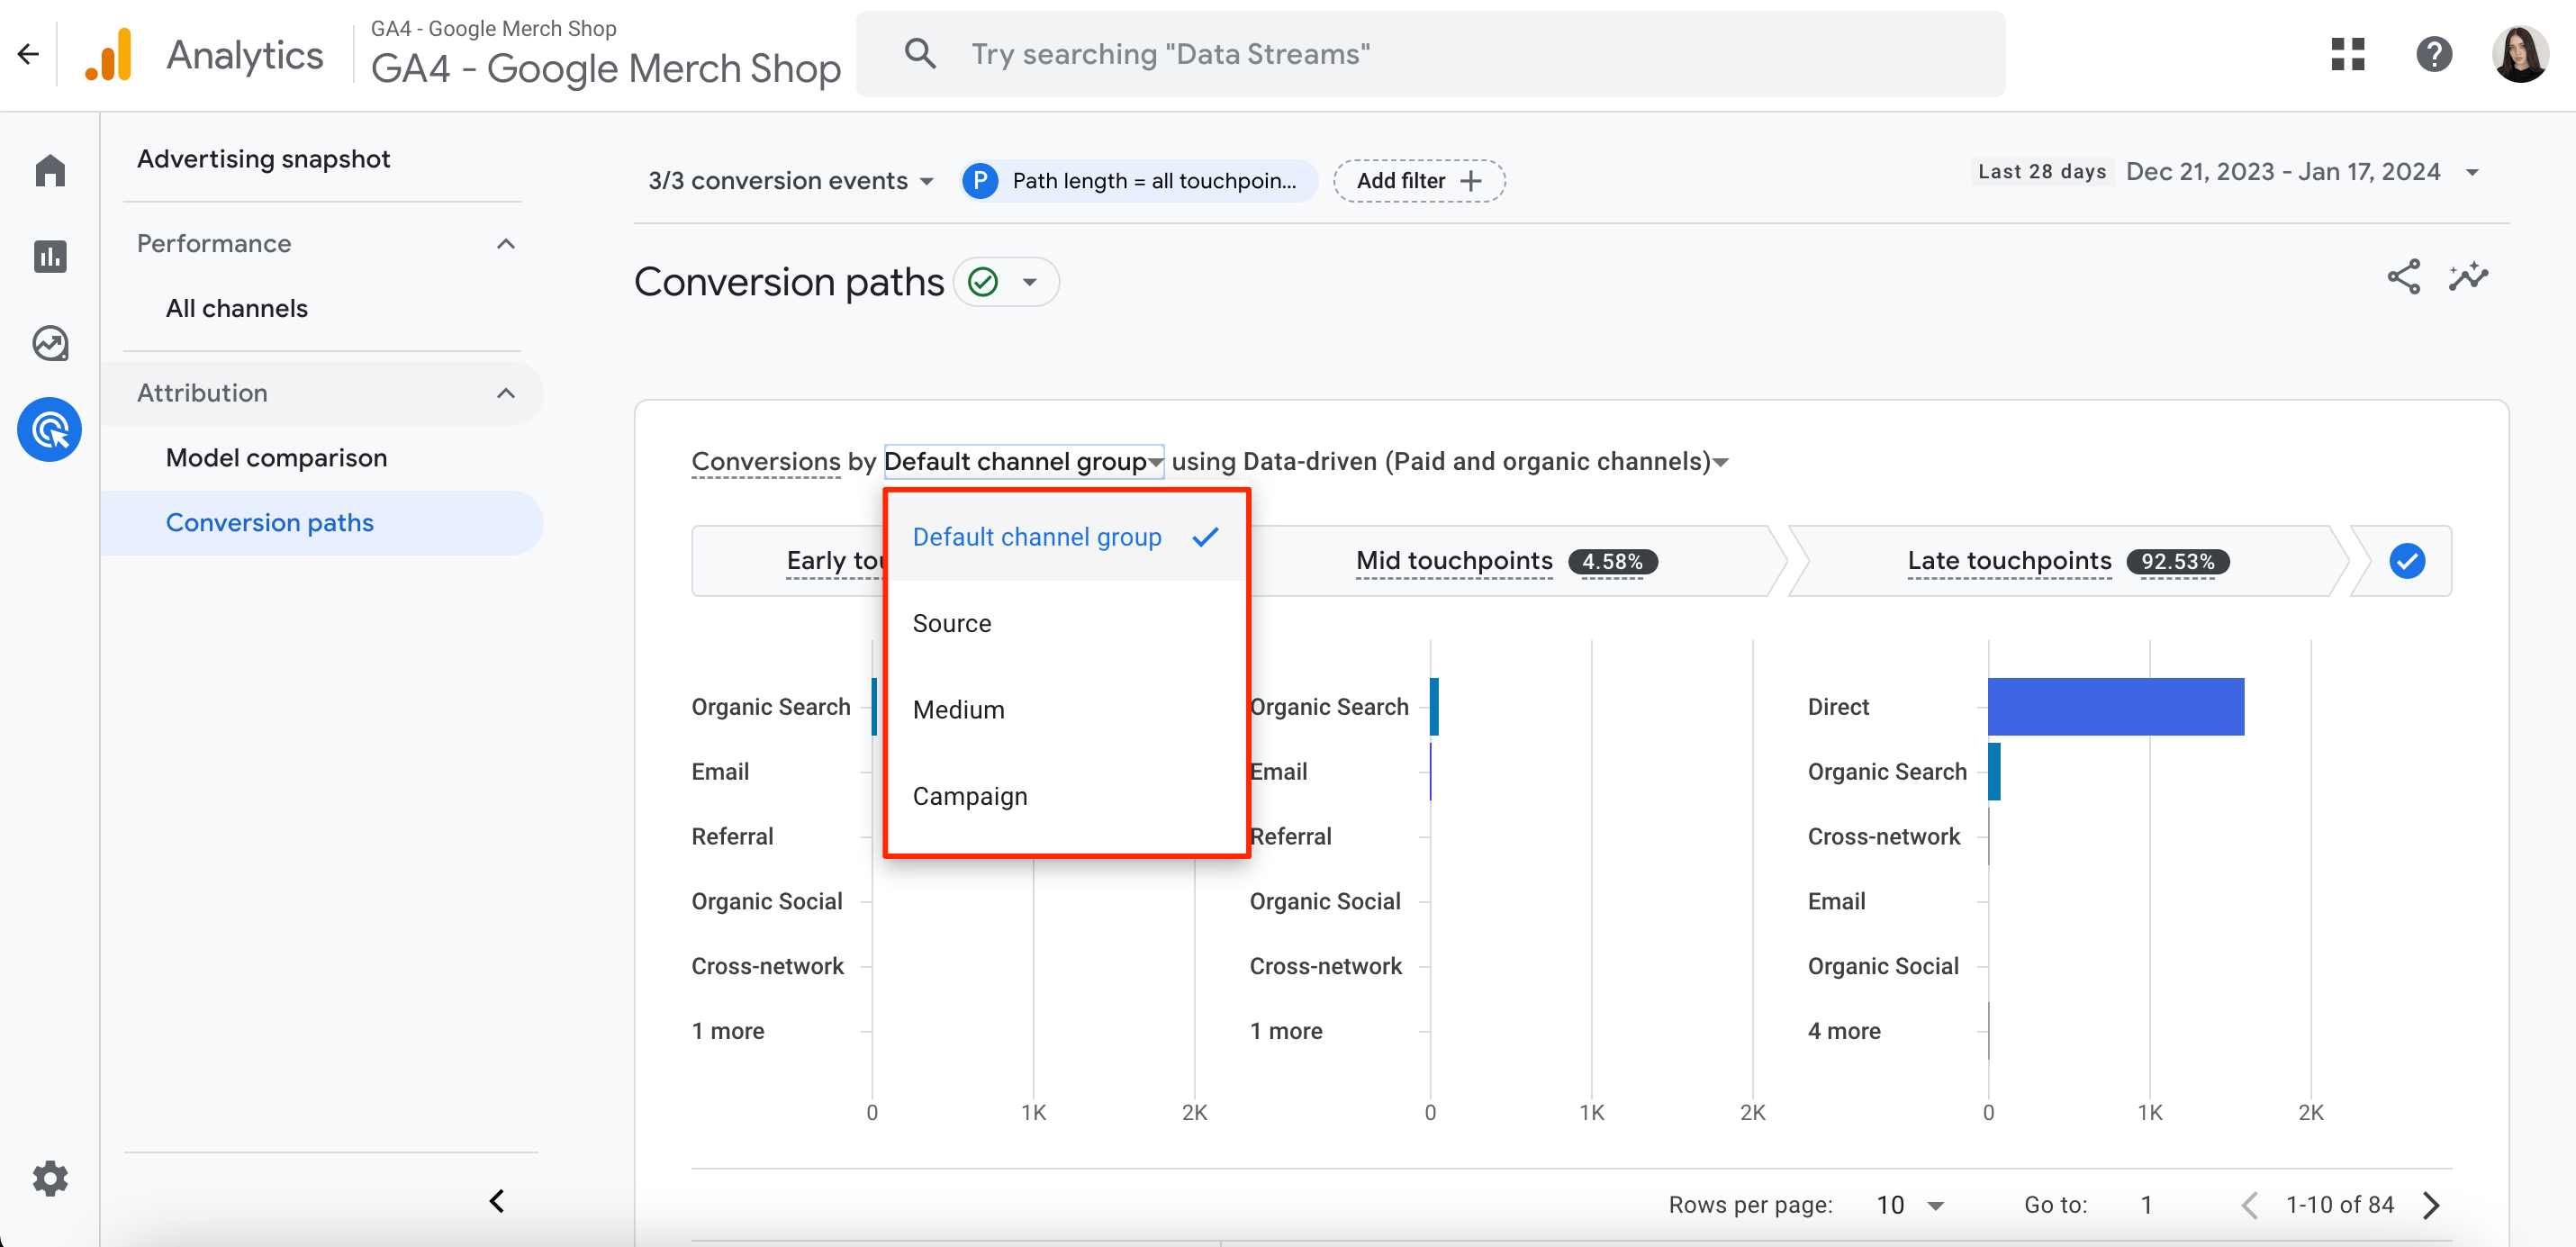
2. Select the dimension to report on.
The chart and table automatically show your data through the Default Channel Group metric. Navigate to the drop-down to view the data by Source, Medium, or Campaign instead.
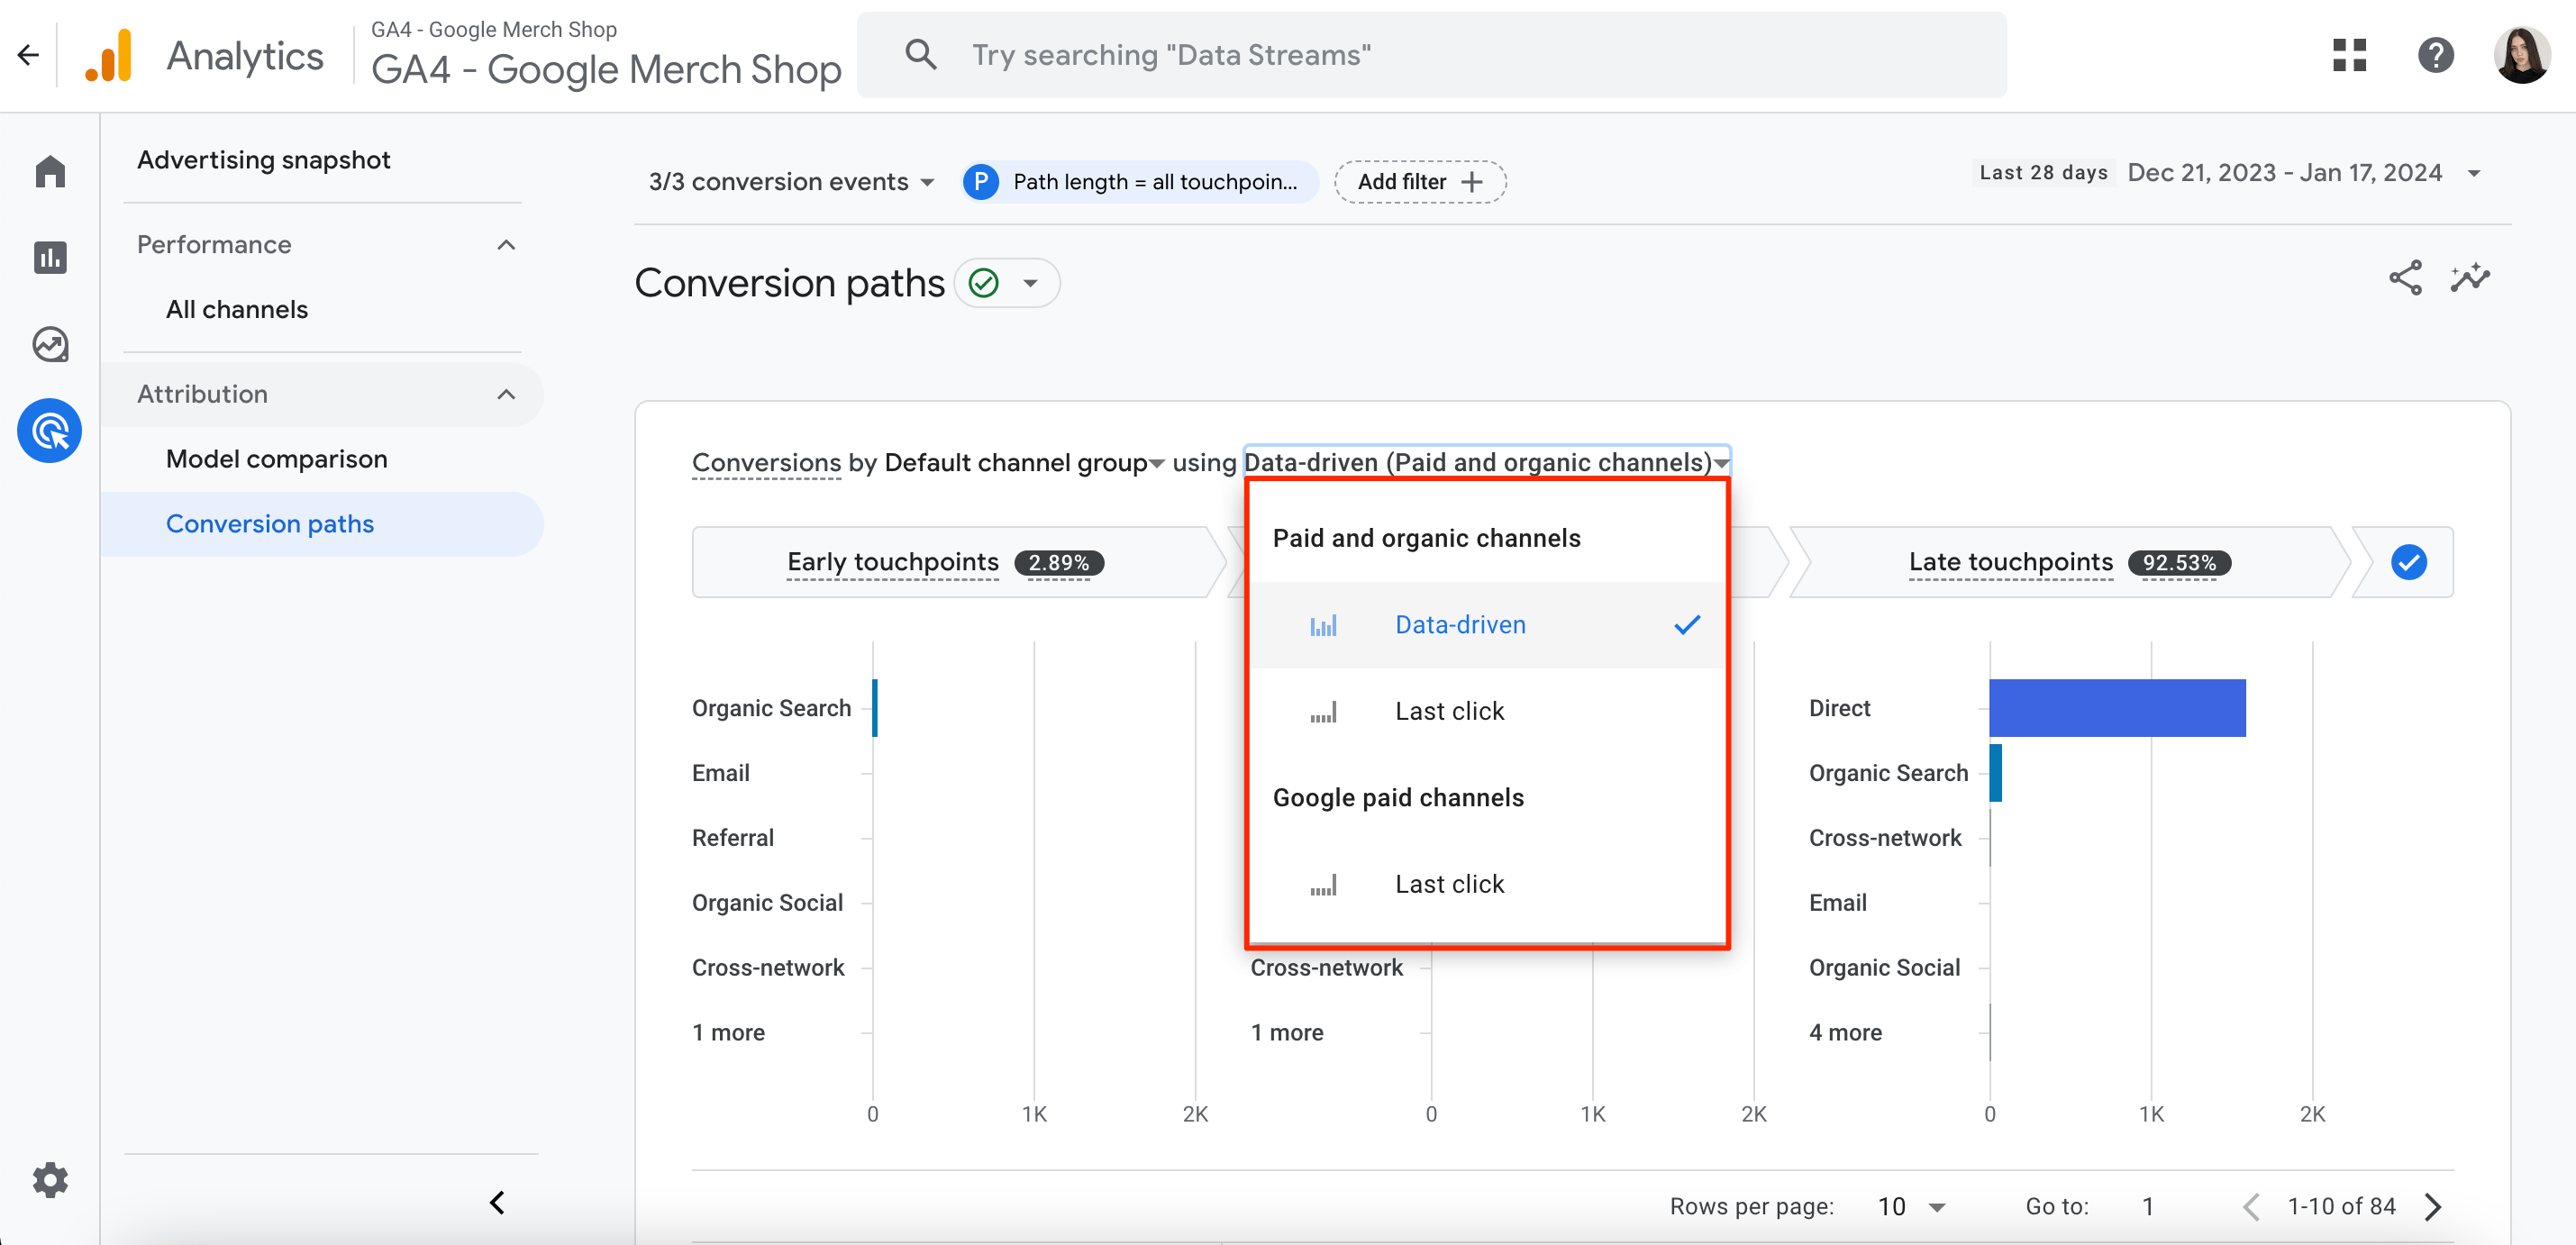
3. Select the attribution model for the data visualization.
As of now, you can select either Paid and Organic Data-Driven Attribution, the Paid and Organic Last Click, or Google Paid Channels Last Click model.
4. Interpret collected data.
The last step is to accurately interpret the data you gathered data so you can make meaningful, educated decisions.
The diagram displayed at the top of the screen shows how much credit each segment of the conversion path gets (early, middle, and late touchpoints) based on the chosen attribution model.
The table below the diagram provides a quick summary of conversion performance based on these four key metrics: Conversions, Purchase revenue, Days to Conversion, and Touchpoints to Conversion. To organize the results based on a specific metric, just click on the metric’s column header. Please note that the conversion credit shown in this table represents an average for each item.
Create & Modify Events
There might be cases where you need to create new events based on specific conditions detected within existing events. For instance, let’s say you want to track the number of successful sign ups on your website. You could set up an event that automatically creates a new event called confirm_signup whenever the page_view event happens and the page_location parameter matches the URL of your confirmation page. This new confirm_signup event can then be marked as a conversion. This makes it easier to measure your success with signups.
To accomplish this task, Google recommends following these steps:
1. Go to Admin>Data Display>Events.
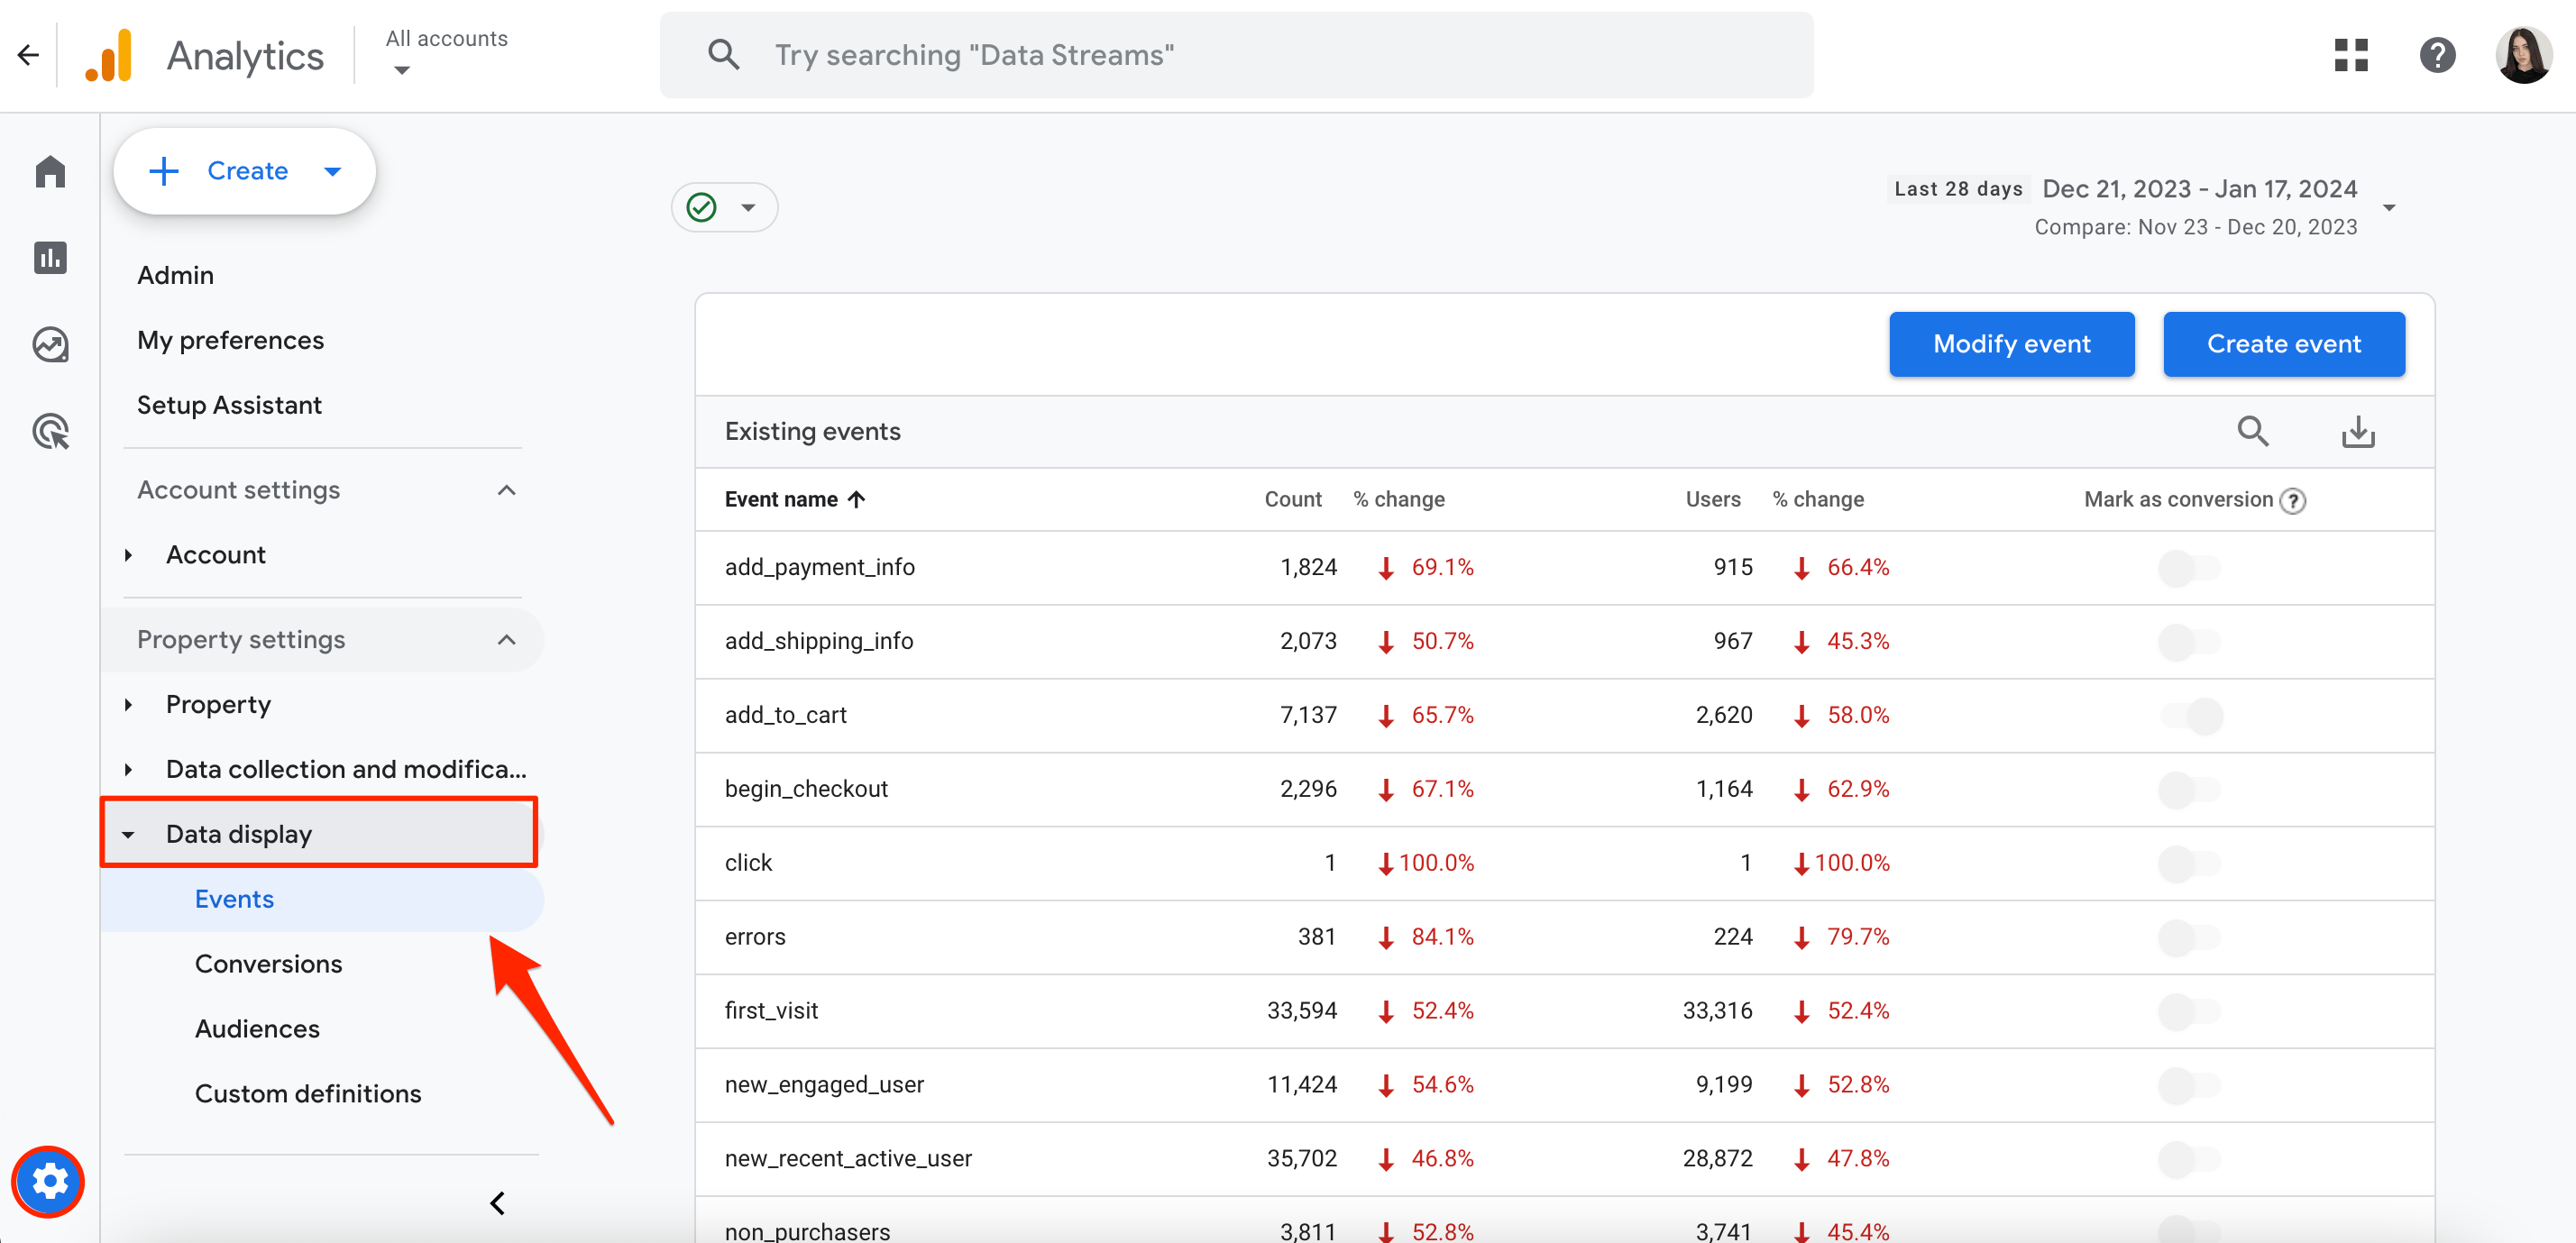
2. Now, click Create Event.
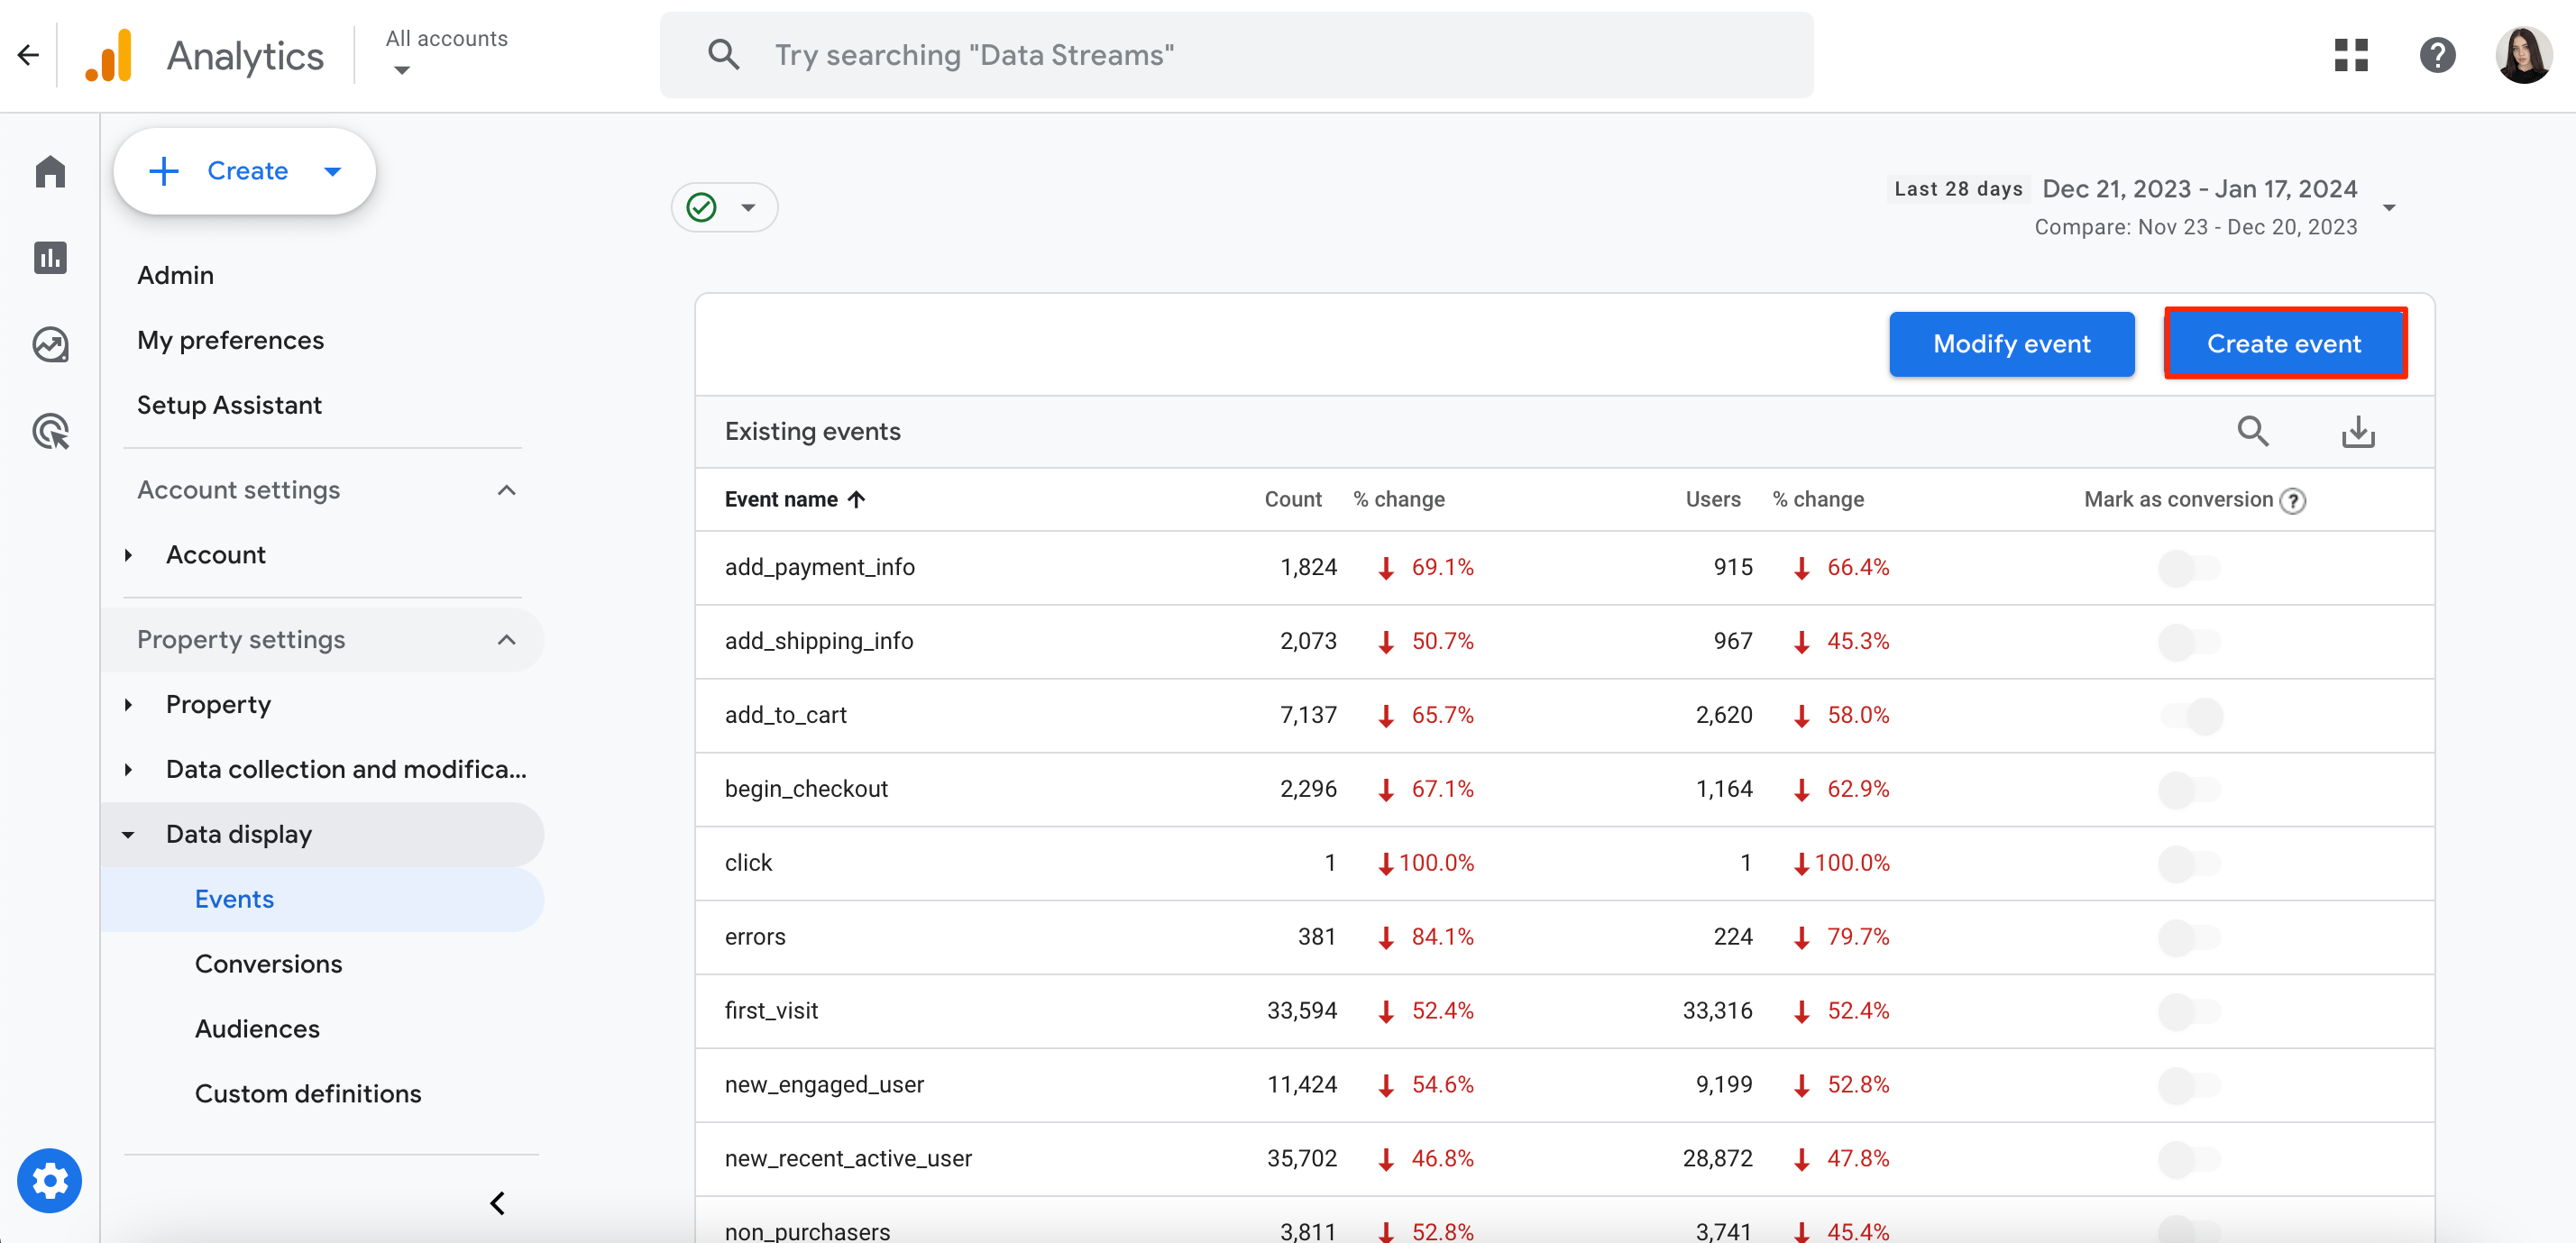
3. Enter the event name and specify one or more matching conditions within the corresponding block. For instance, if you specify event_name equals view_item, GA4 will copy over view_item to your new event.
4. Save these changes.
To modify existing events, you’ll need to do the following:
1. Go to Admin>Data Display>Events.

2. Now, click Modify Event.
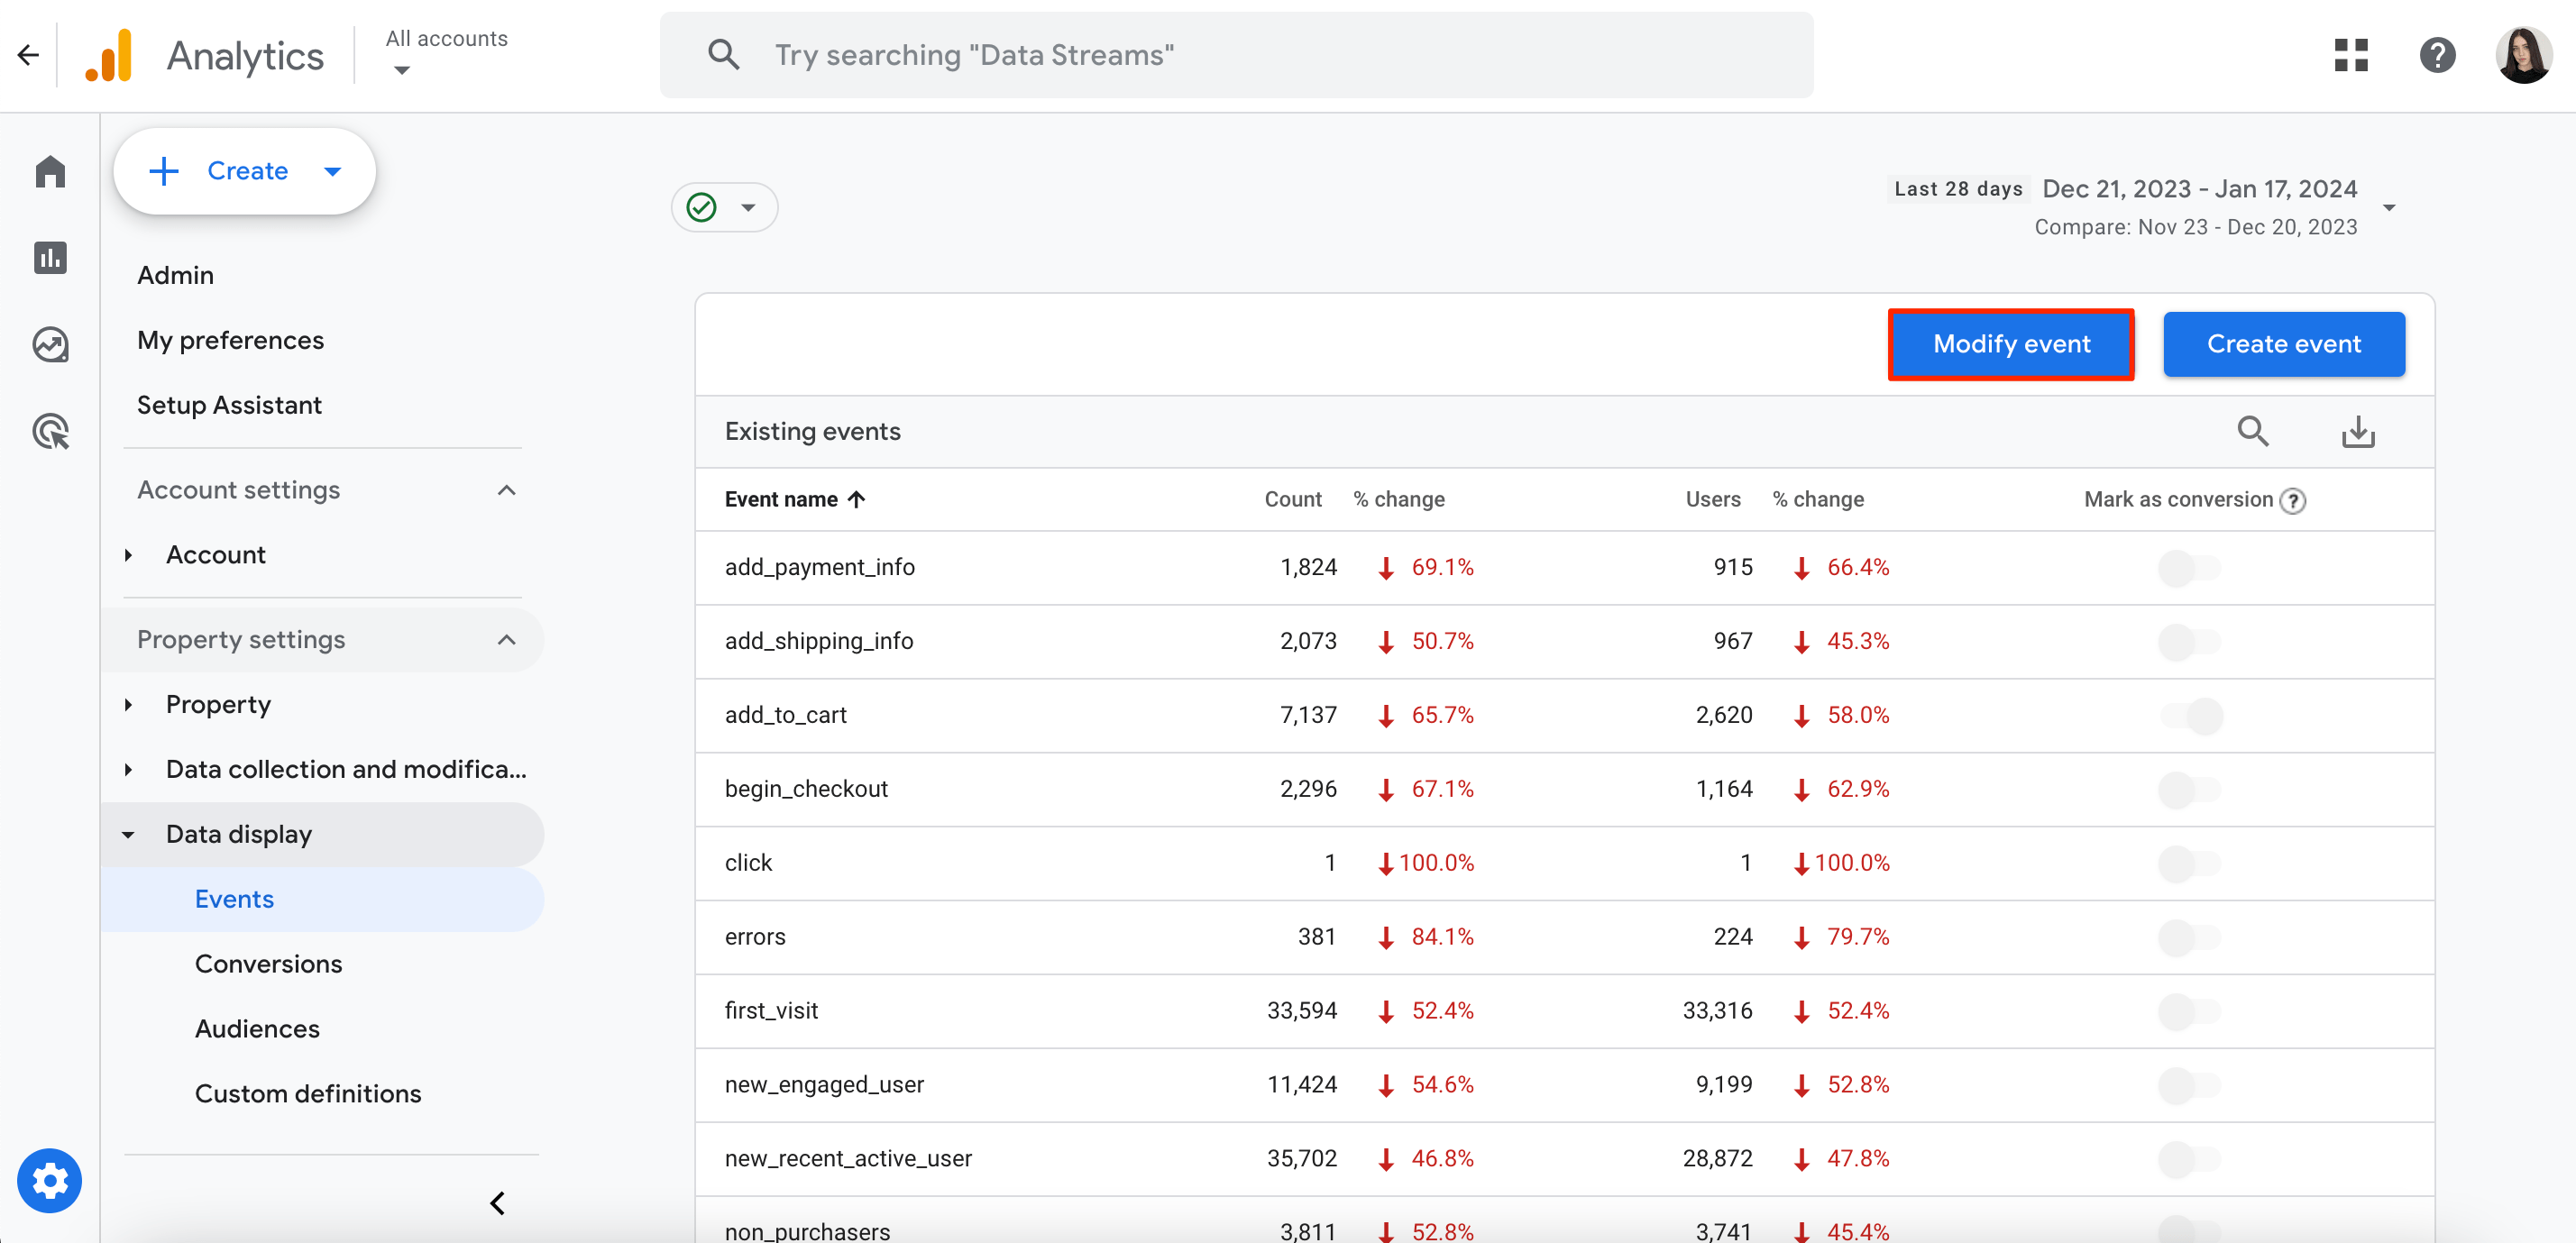
3. Enter a name that describes the changes and specify the matching conditions. For instance, if you specify event_name equals view_item, you can then modify the view_item event.
4. In the Modify Parameters block, configure the parameters from the matching event.
5. Save these changes.
Some GA4 Drawbacks to Consider
Despite offering tons of valuable data on analytics, GA4 still has some limitations worth considering. This holds true for ecommerce businesses especially.
1. Limited Historical Transaction Import
GA4 does not allow you to import historical transaction data. While existing transactions can be updated, it is not possible to add completely new historical data.
2. Lack of GA4 Enhanced Ecommerce Reports
GA4 doesn’t offer built-in Enhanced Ecommerce reports. Even though it’s possible to perform GA4 ecommerce tracking through custom events, the setup requires more technical expertise and manual configuration.
3. Limited Ecommerce Reporting Options
For instance, there is no easy way to access reports on product performance, checkout behavior, or revenue attribution without making extensive efforts towards custom configuration.
FAQ
- Which marketing channels account for the highest percentage of overall revenue?
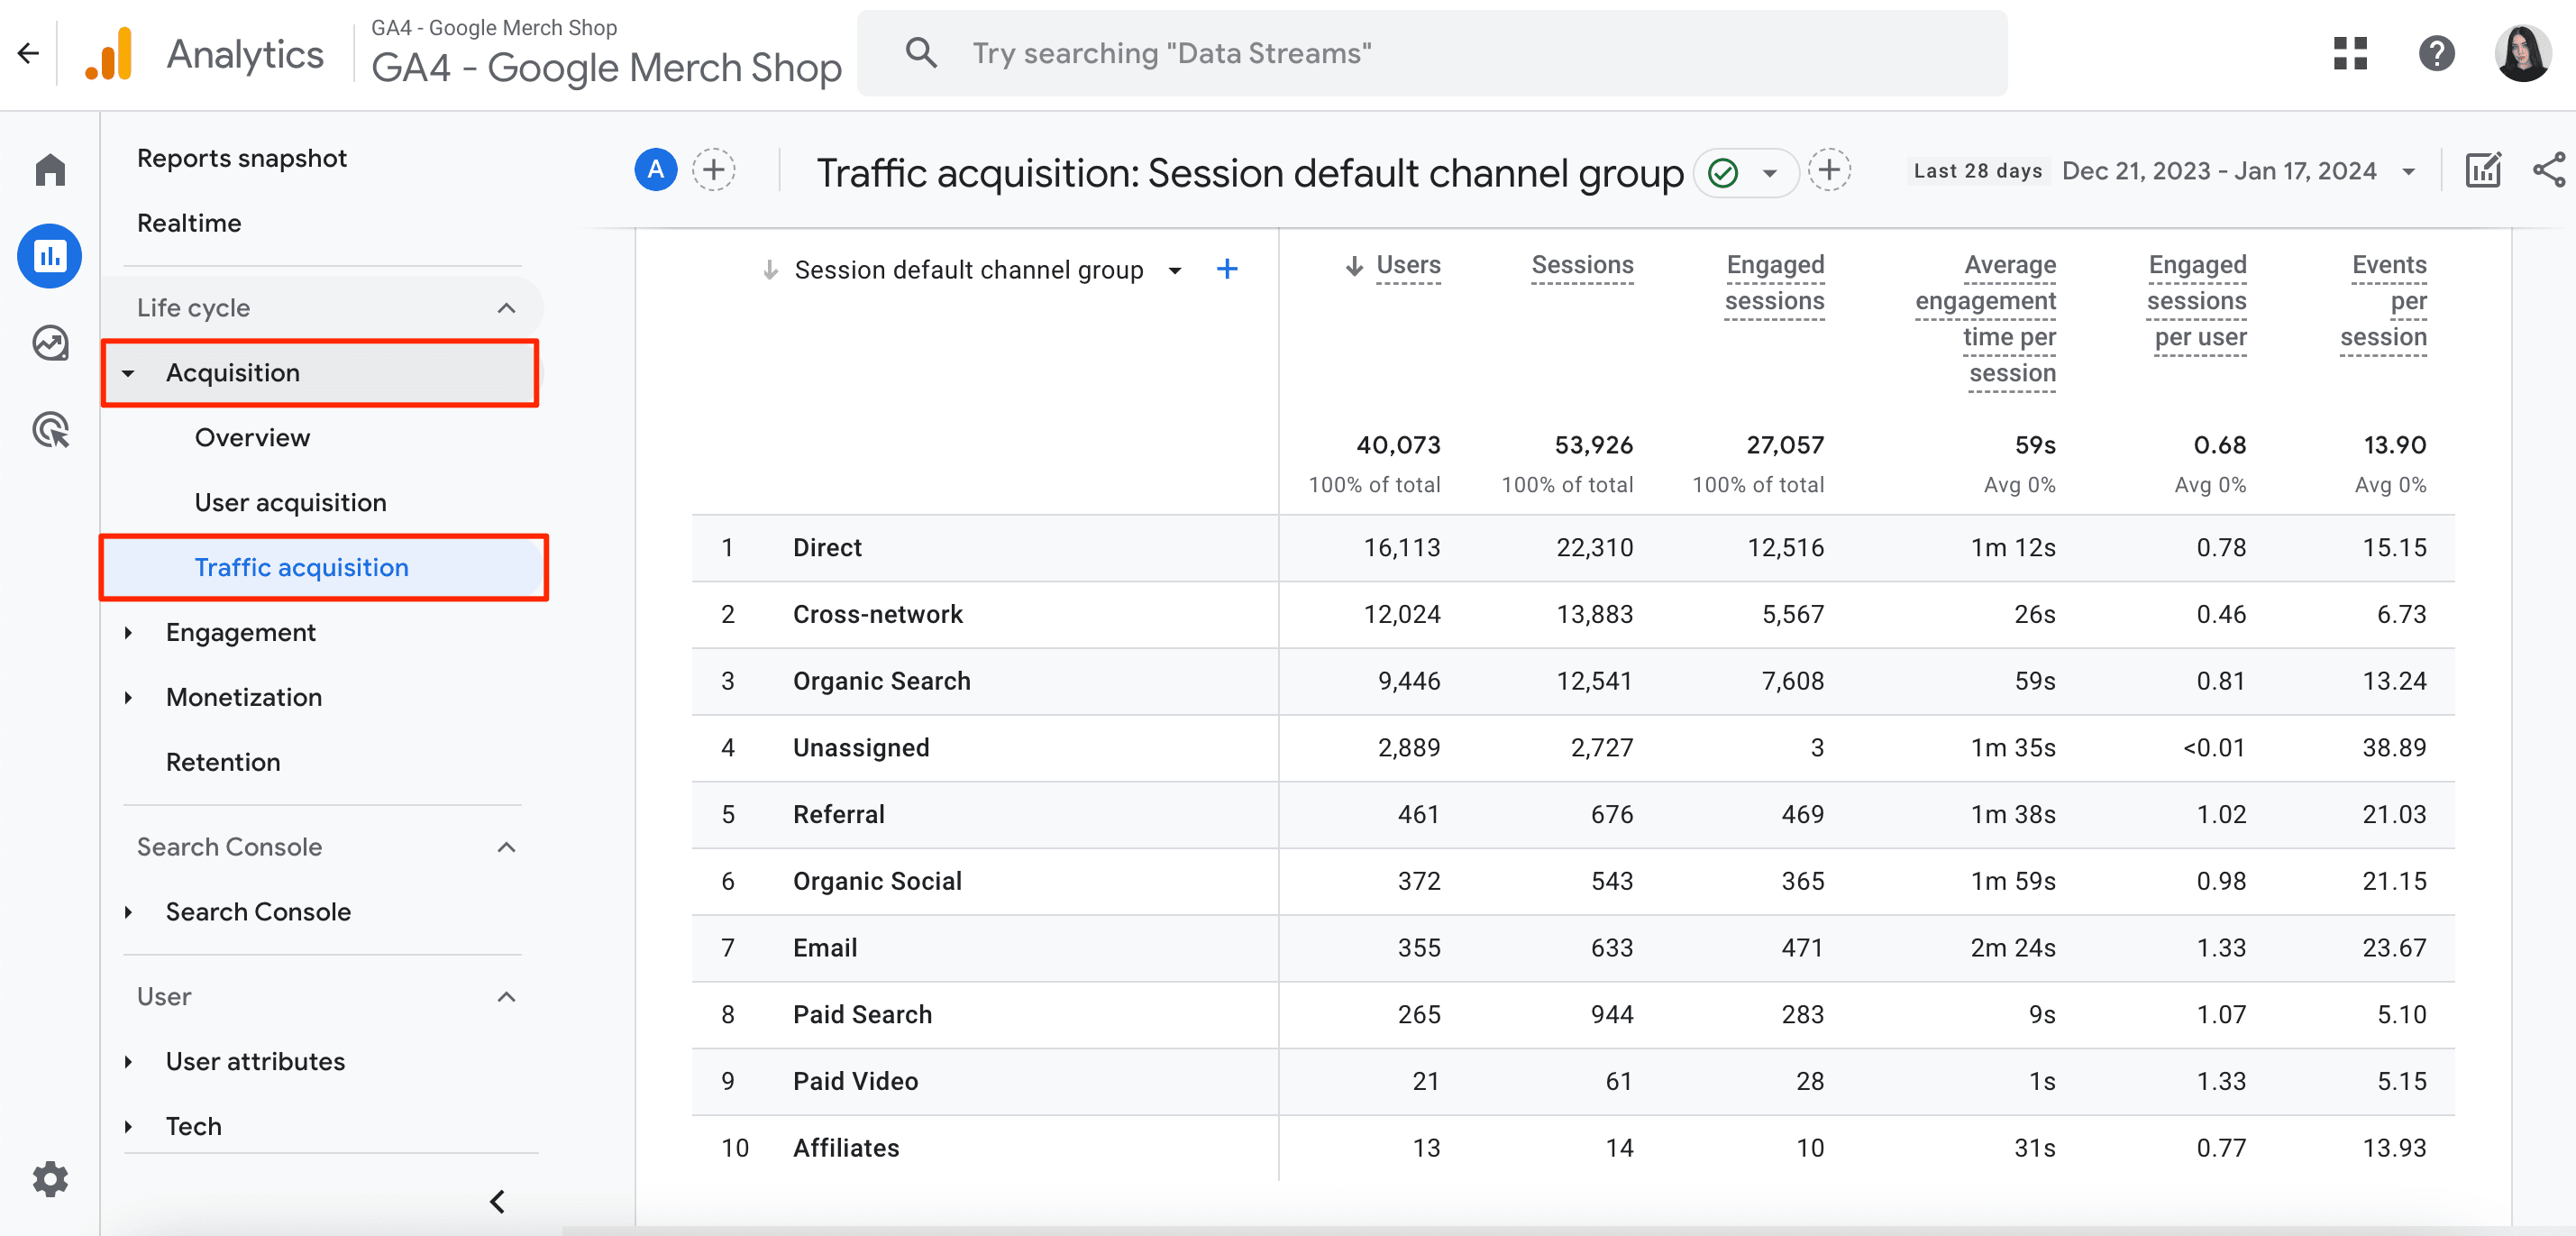
To see which marketing channels (e.g., organic search, paid search, email marketing, affiliate marketing, etc) generate the most money for your business, navigate to Reports>Acquisition>Traffic Acquisition:
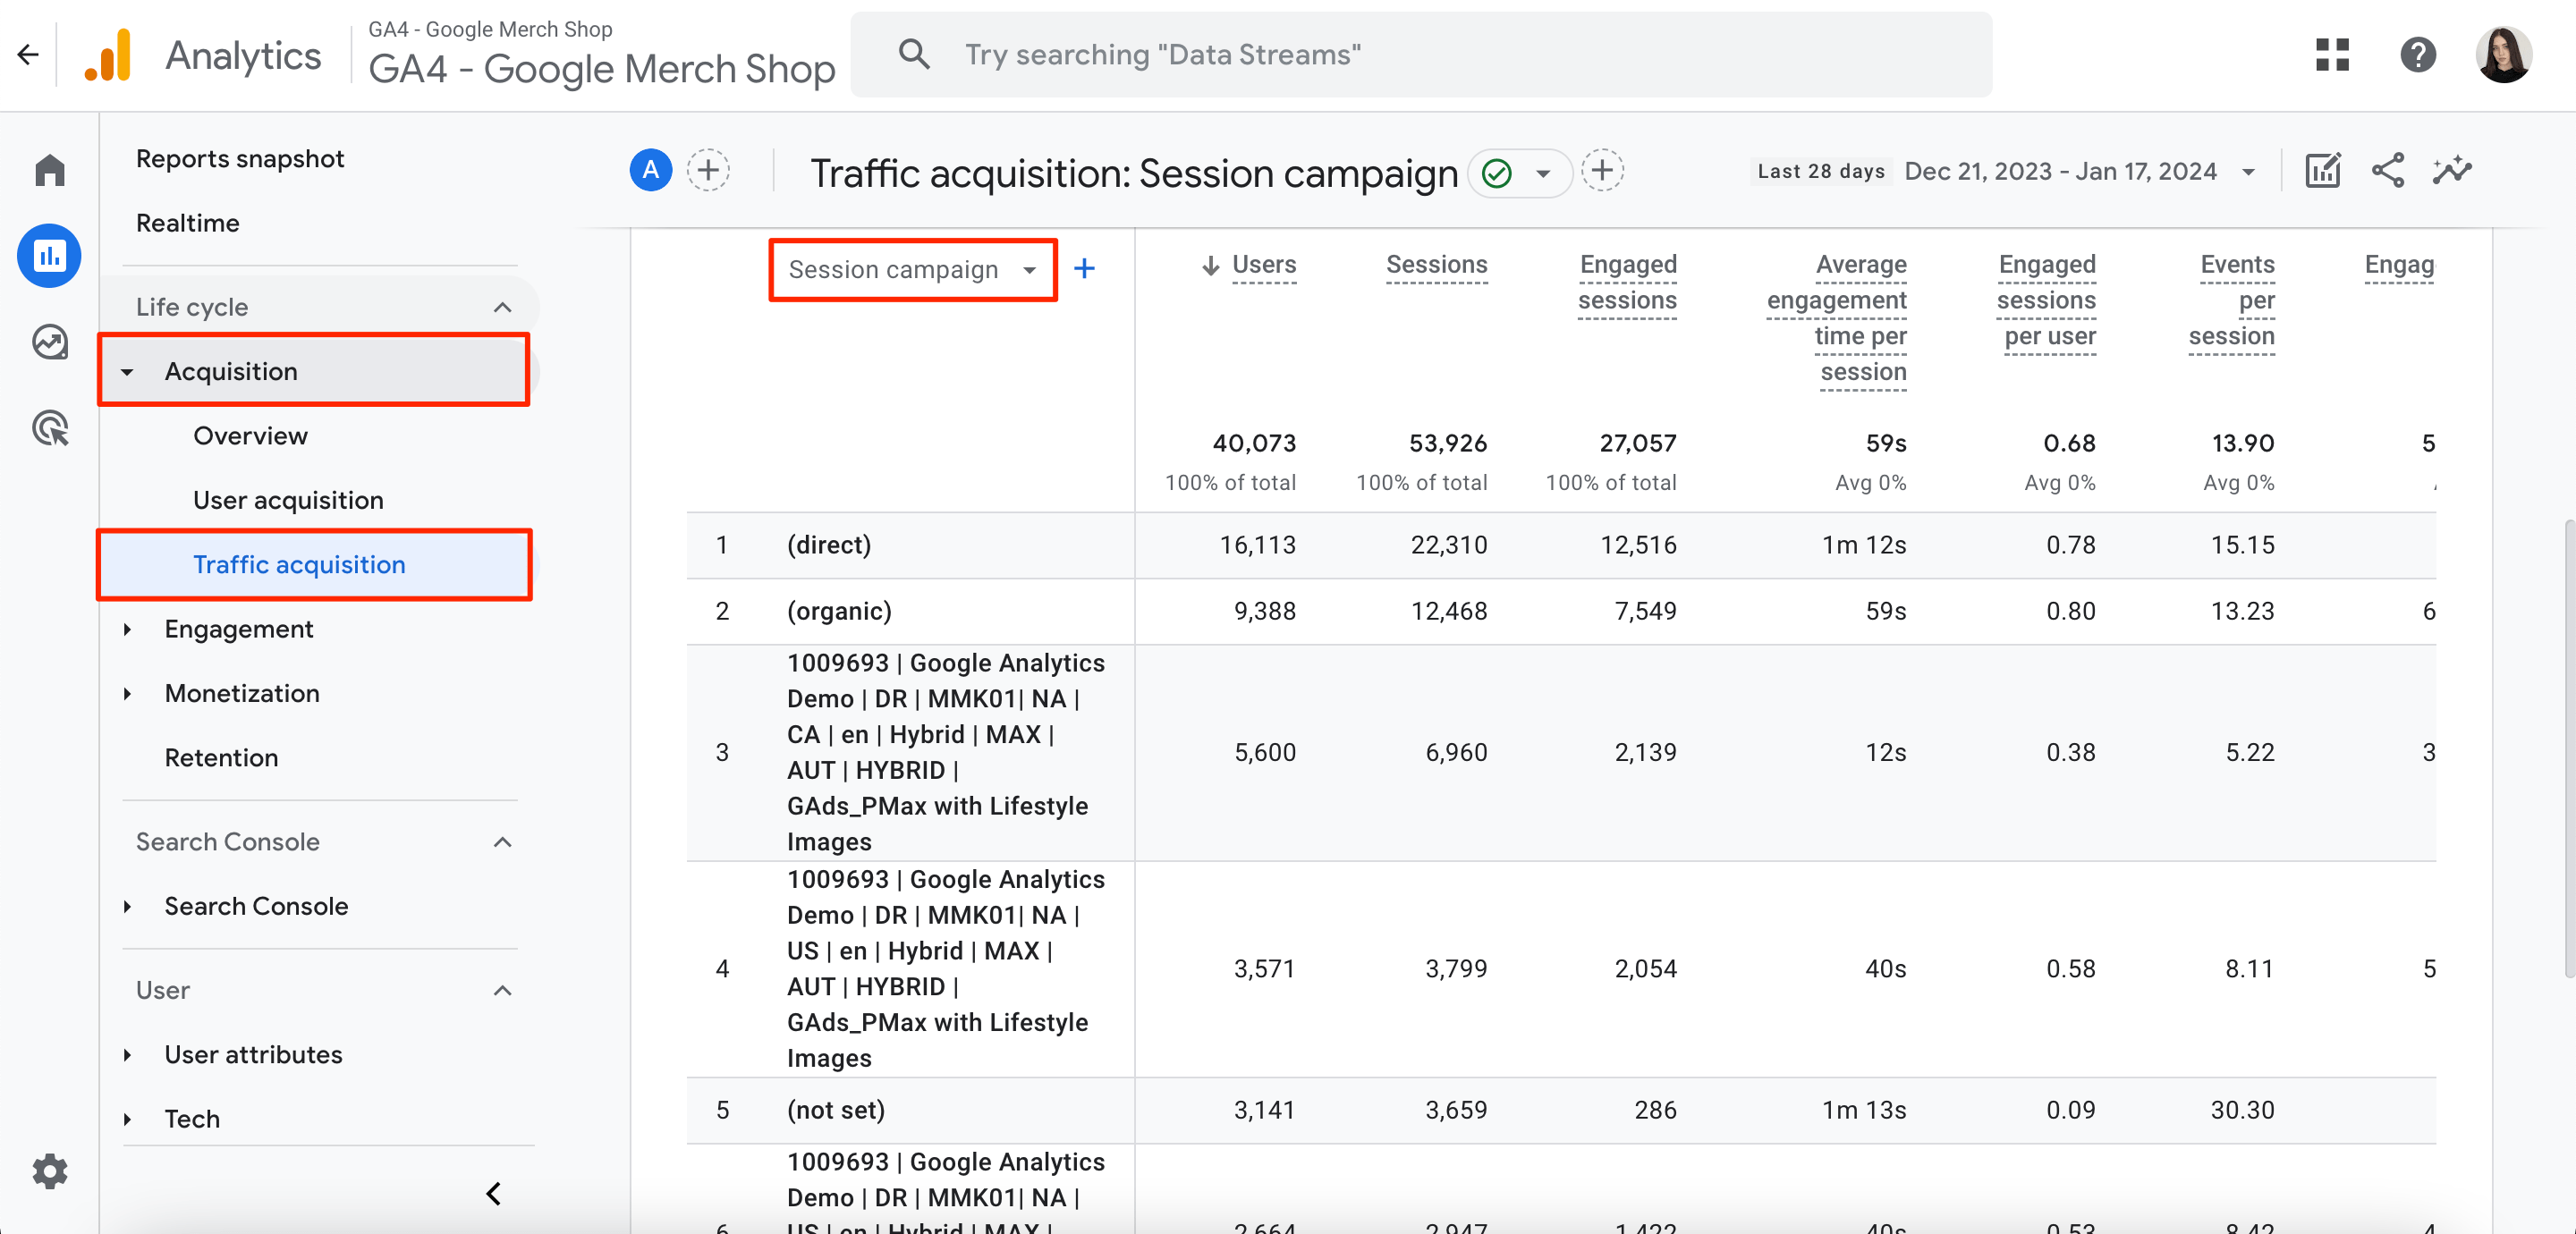
- Which marketing campaigns have the highest ROI in terms of revenue generated?
Navigate to the Reports>Acquisition>Traffic Acquisition and change the dimension in the drop-down menu from Session Default Channel Grouping to Session Campaign:
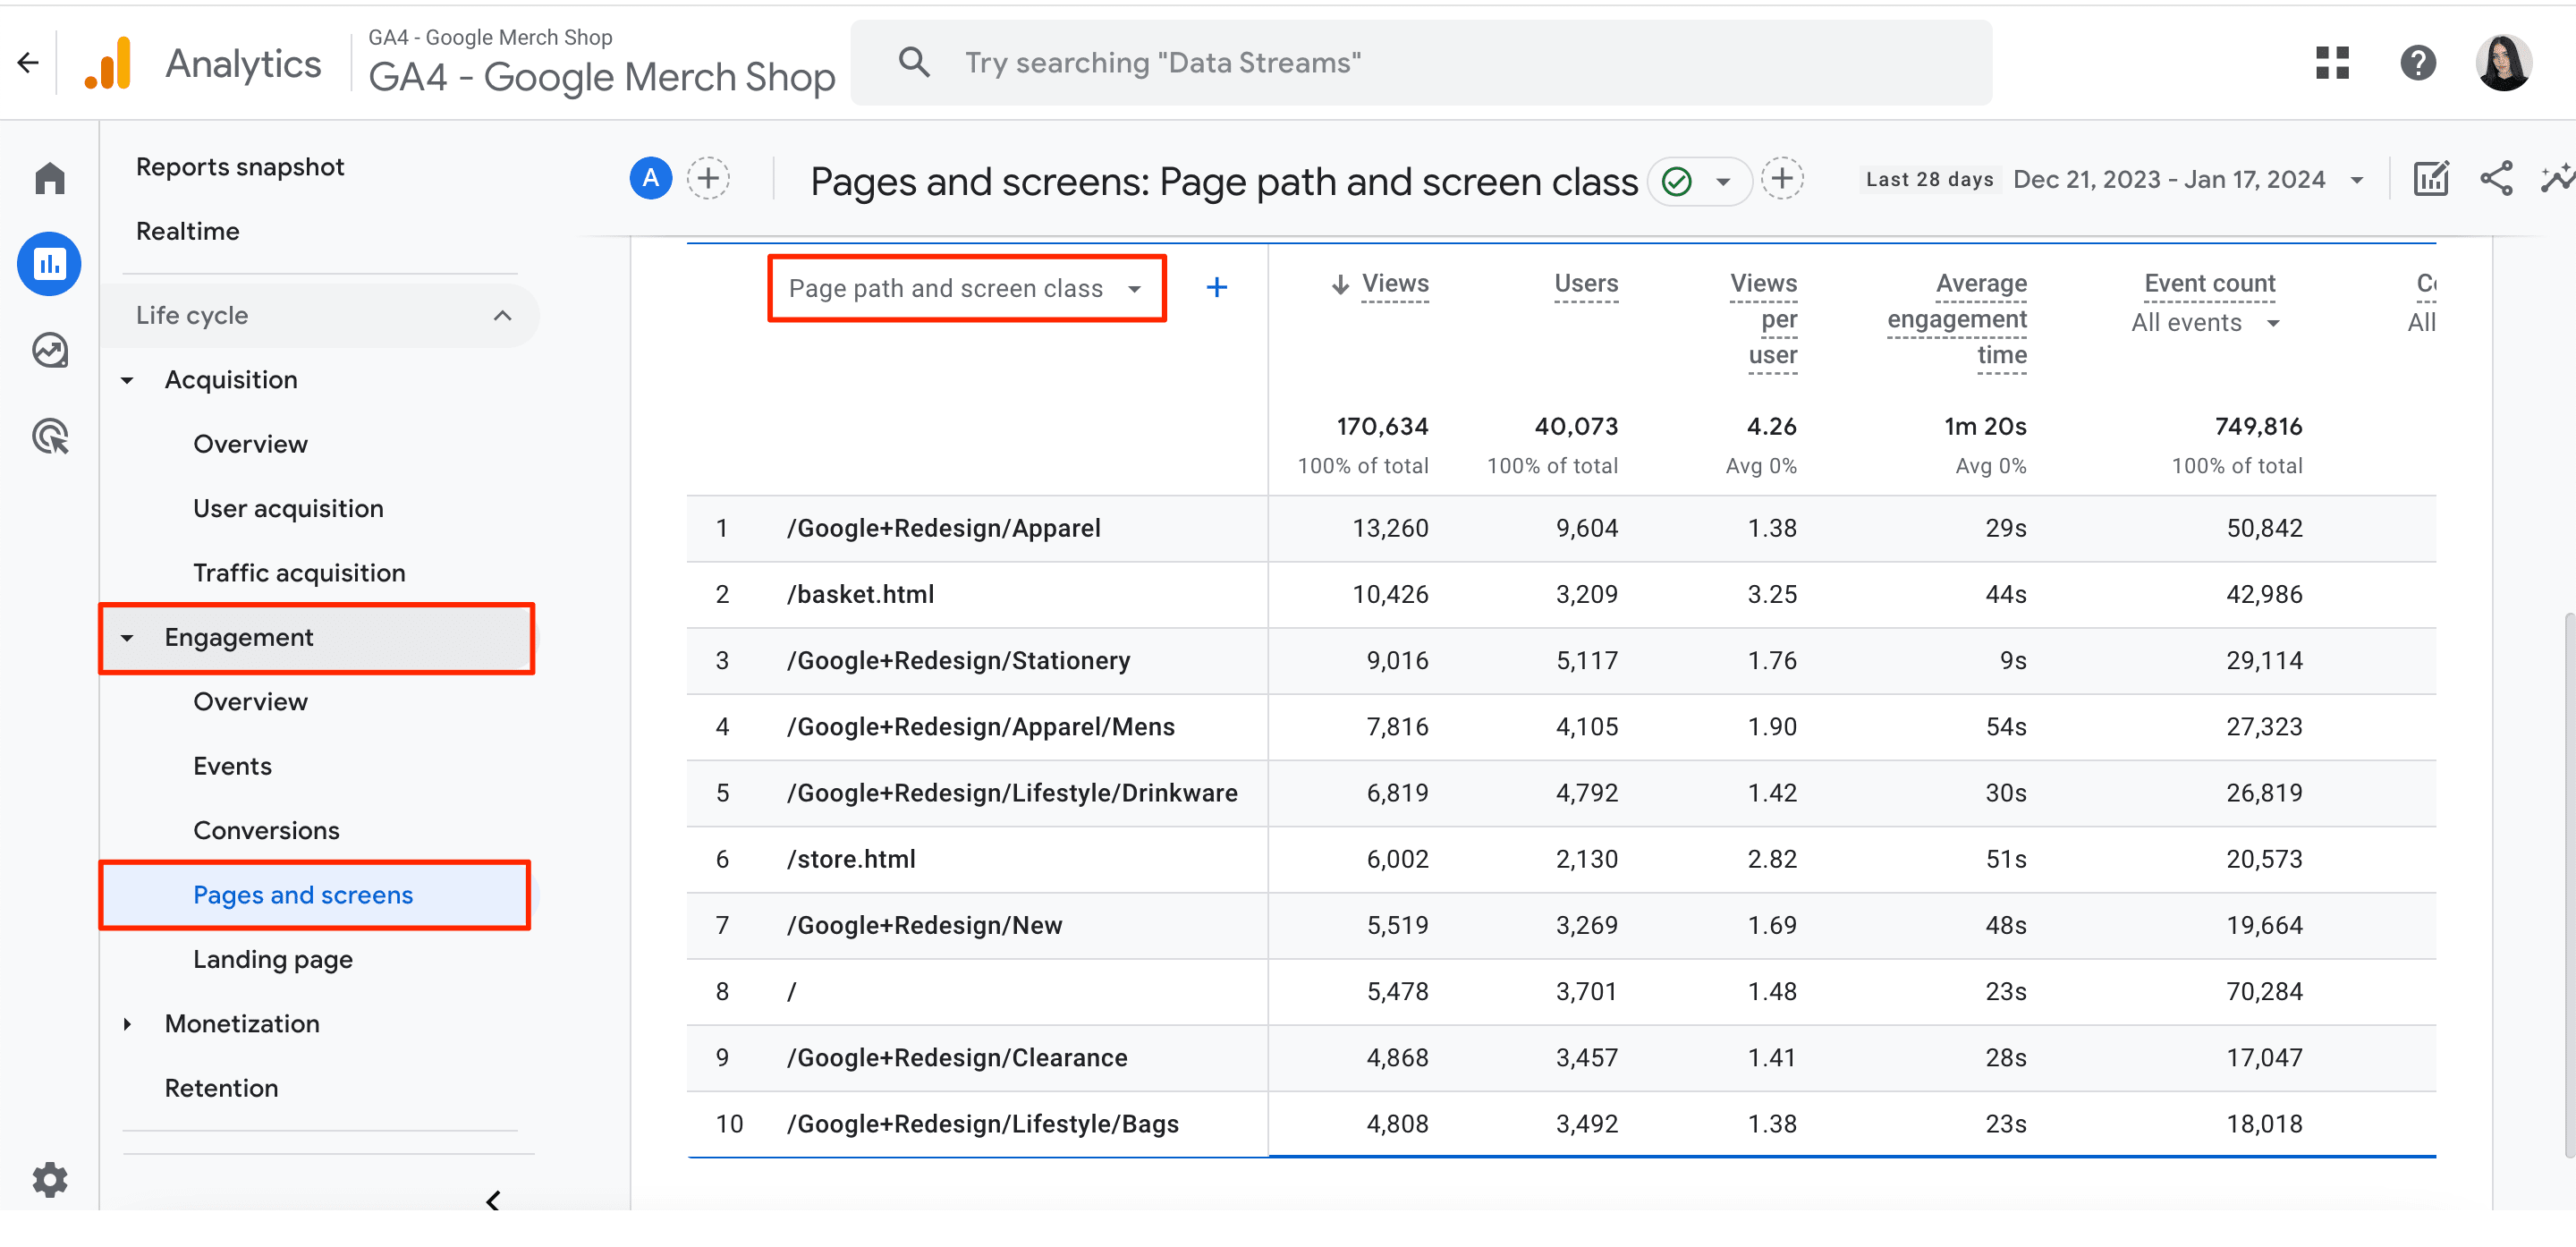
- Which webpages contribute the most to revenue generation?
Go to Engagement>Pages and Screens and change the dimension in the drop-down from Page Title to Page Path:
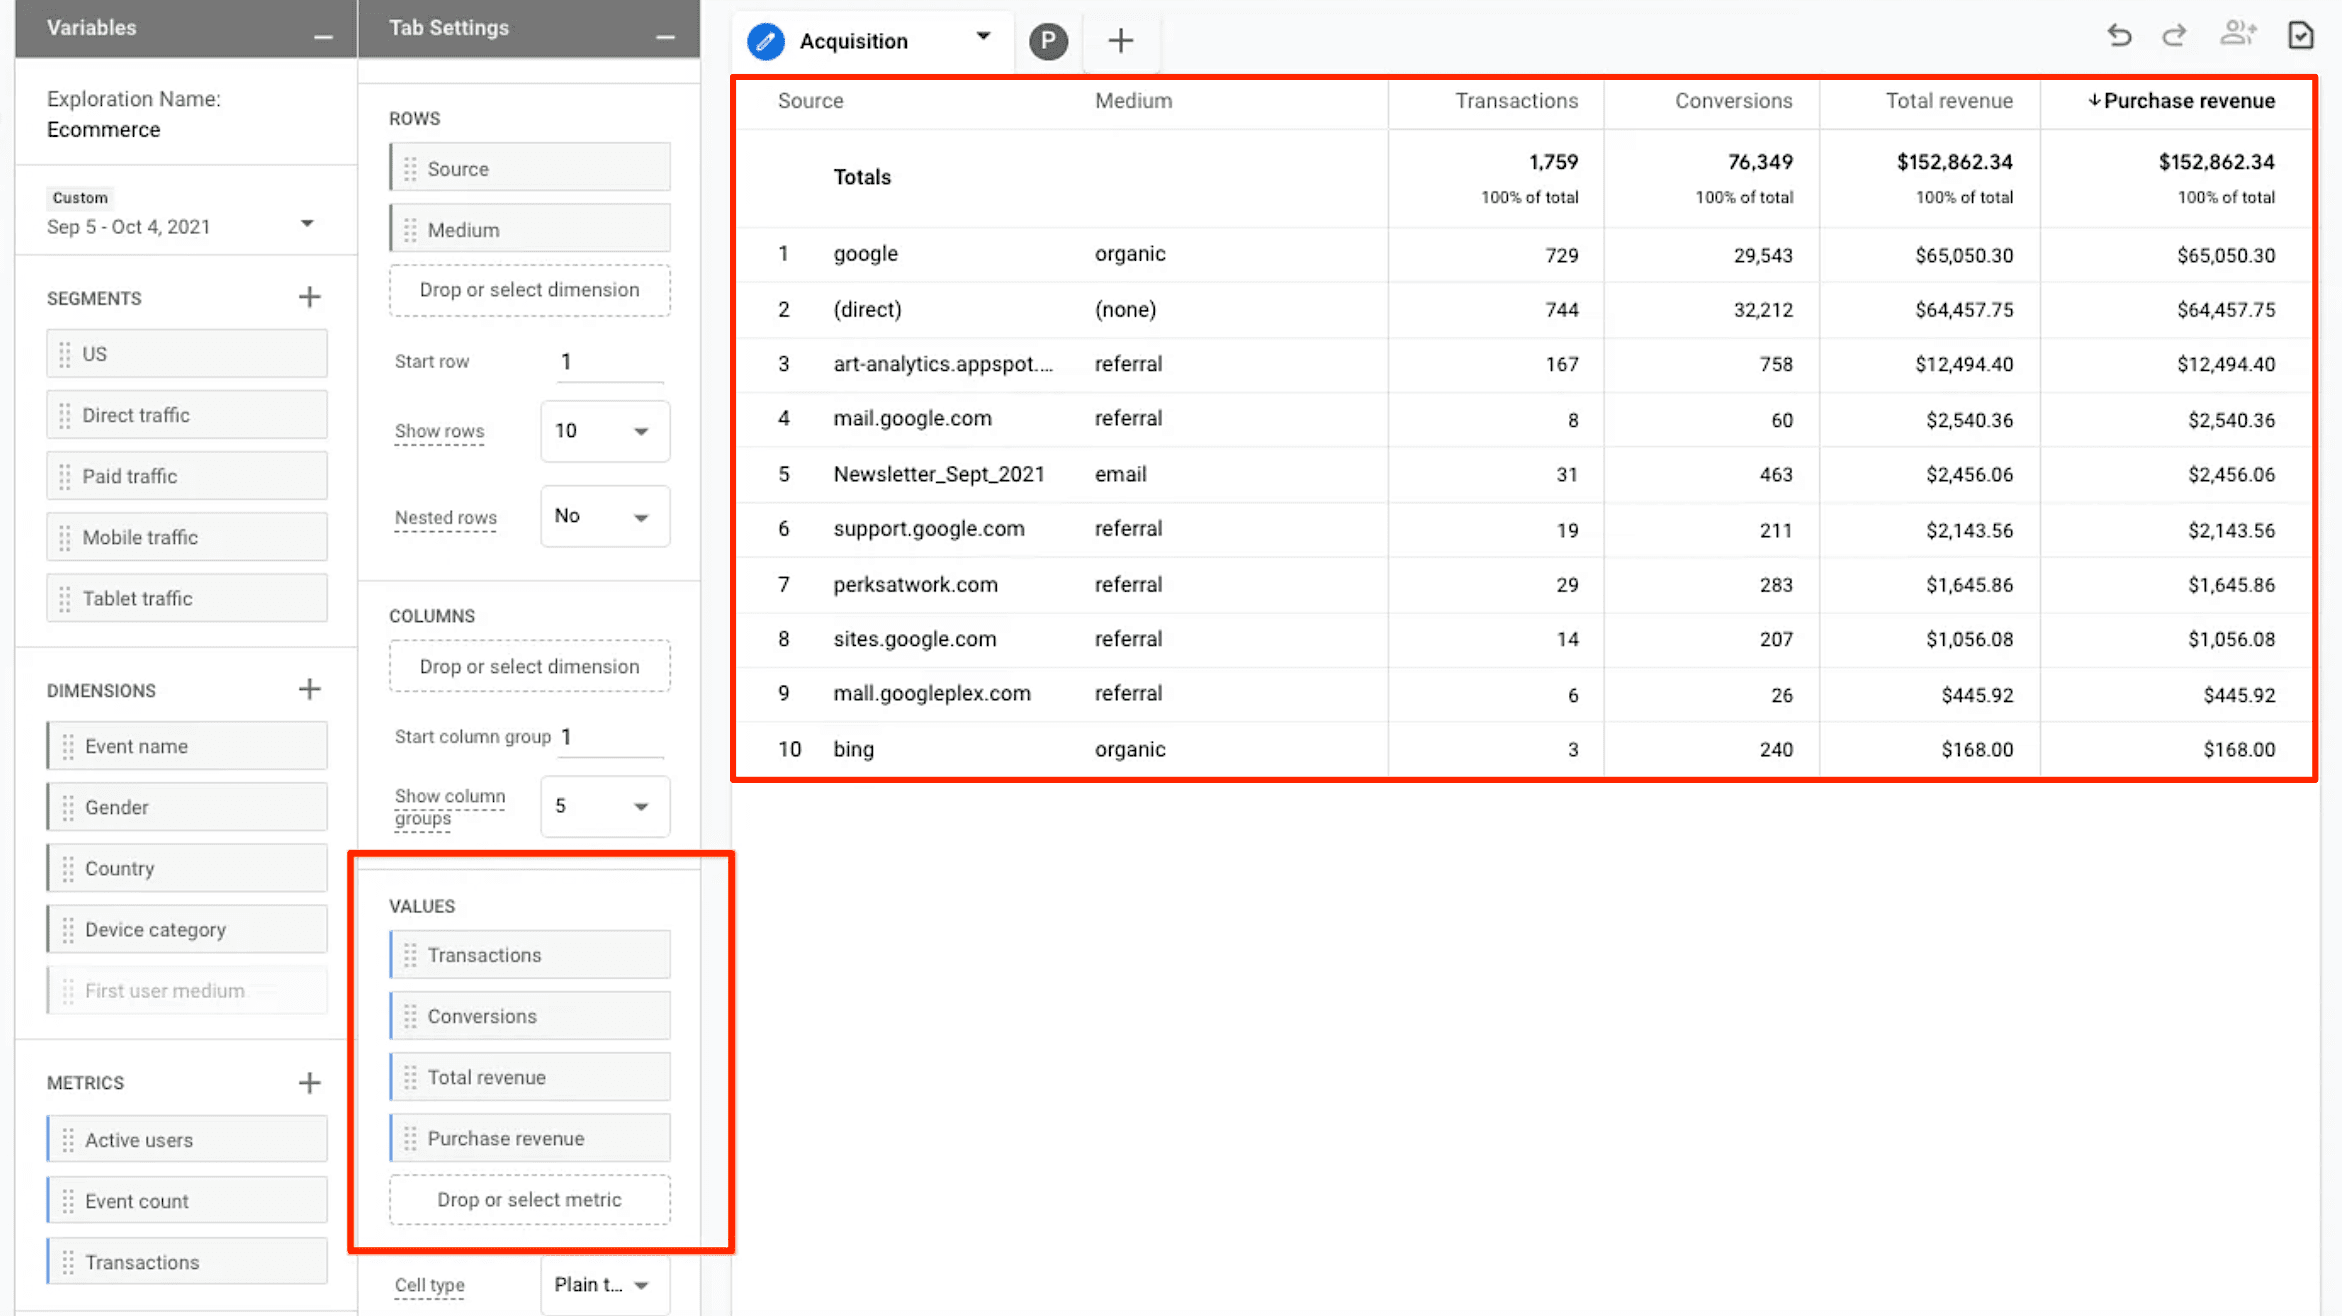
- How do you find the source of traffic and transactions?
Go to the Explore section, select Ecommerce template, and configure these settings as indicated in the screenshot below:
- How do you identify the abandonment rate at each step of the funnel?
Navigate to the Explore section and select the Funnel Exploration template. By default, the report will show you the abandonment rate at each step of the funnel:
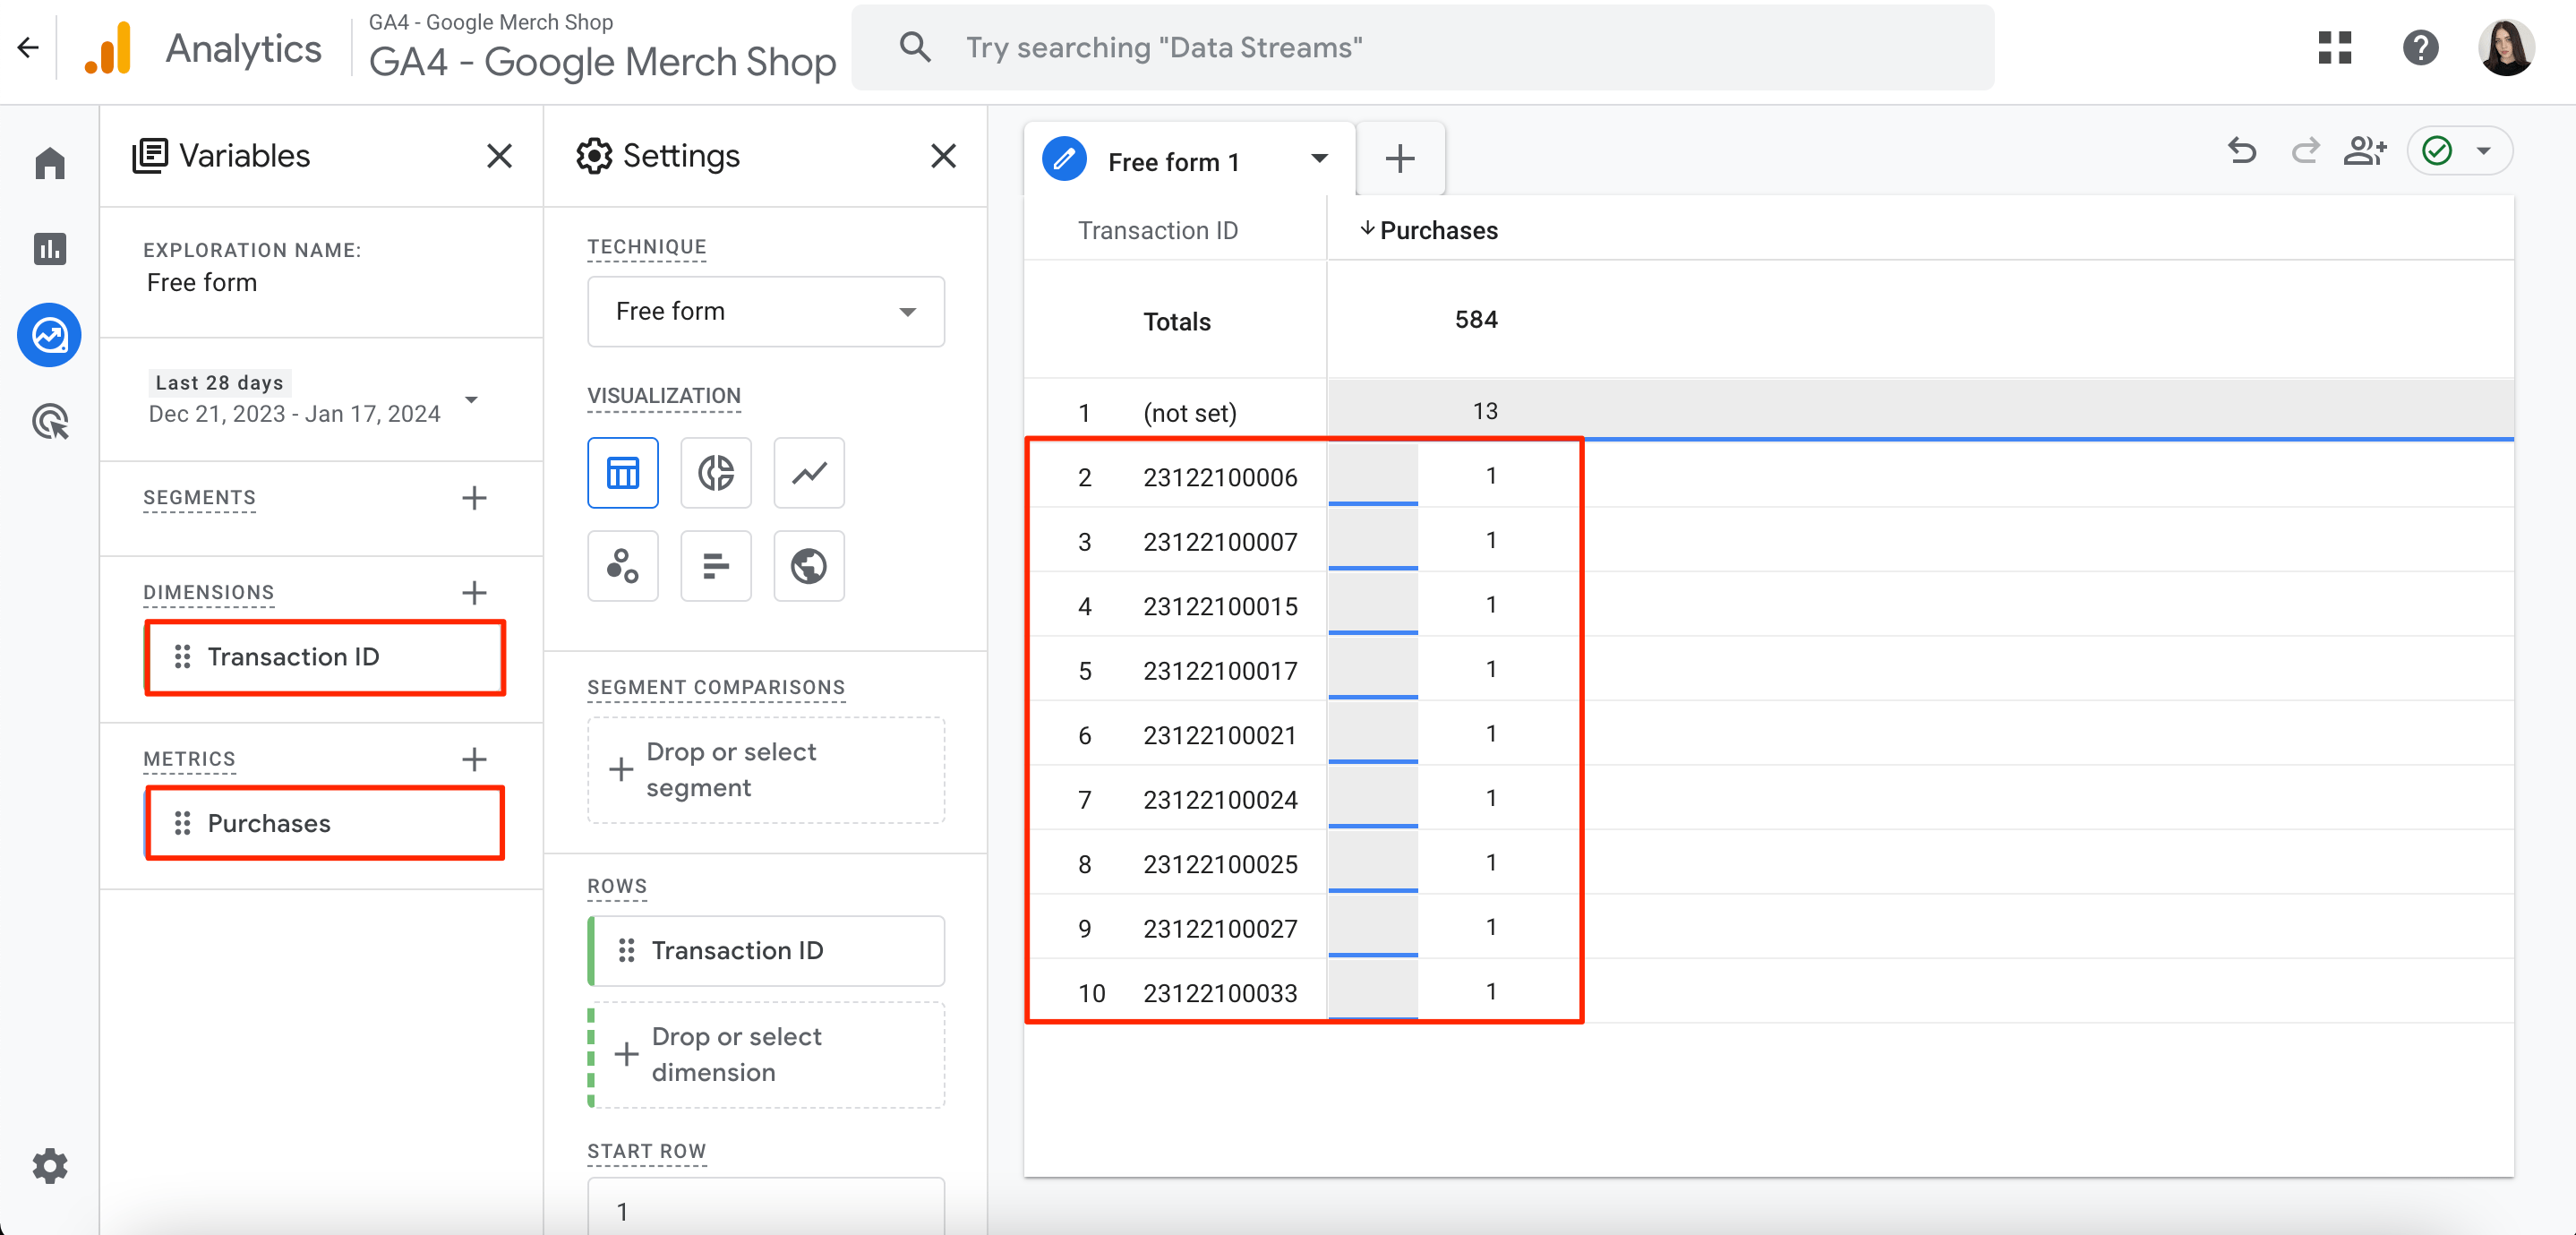
- How do you find duplicate transactions in GA4?
Go to the Explore section and select Free Form template. Then, configure Transaction ID as your dimension and Purchases as the metric. To find duplicate transactions, check whether there are transaction IDs with several purchases.
