Looker Studio
SE Ranking is an all-in-one SEO platform for rank tracking, competitor research, website audits, and AI search visibility. The integration with Looker Studio connects SE Ranking data directly to Looker Studio, Google’s free platform for reporting and data visualization.
With this connection, you can create dynamic, interactive, and shareable dashboards for your SEO projects instead of manually exporting CSVs. Common dashboards include keyword performance tracking, competitor traffic analysis, and real-time domain health monitoring.
What is Looker Studio for SEO?
Looker Studio for SEO acts as a visual reporting layer on top of your raw data. By connecting SE Ranking, you give Looker Studio the “context” it needs to understand your SEO metrics. This allows you to:
- Create custom reports: move beyond static reports and build dashboards tailored to your specific KPIs, whether it’s for internal analysis or client reporting.
- Visualize trends: turn historical data into intuitive time-series charts to see your organic traffic growth, keyword position changes, and more.
- Combine data sources: blend your SE Ranking data with other sources like Google Analytics, Google Search Console, and Google Ads to create a single, unified dashboard for all your marketing efforts.
This guide provides step-by-step instructions for connecting SE Ranking as a data source in Looker Studio.
Prerequisites
- SE Ranking account: an active SE Ranking account with API access. Your API token is available in the SE Ranking API Dashboard.
- Google account: required to access Looker Studio, which is free to use.
Connecting SE Ranking to Looker Studio
Follow the steps below to add an SE Ranking report as a new data source in Looker Studio.
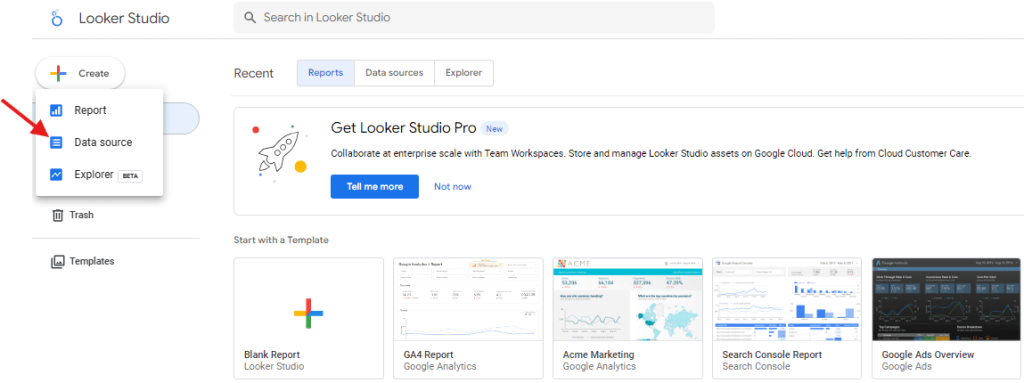
1. Navigate to Looker Studio and click Create in the top left corner, then select Data source.
2. In the connector gallery, select Build Your Own (Partner Connectors).
3. You will be prompted for a Deployment ID. Enter the relevant deployment ID from the table below into the field and click VALIDATE. Looker Studio will find the corresponding SE Ranking connector.
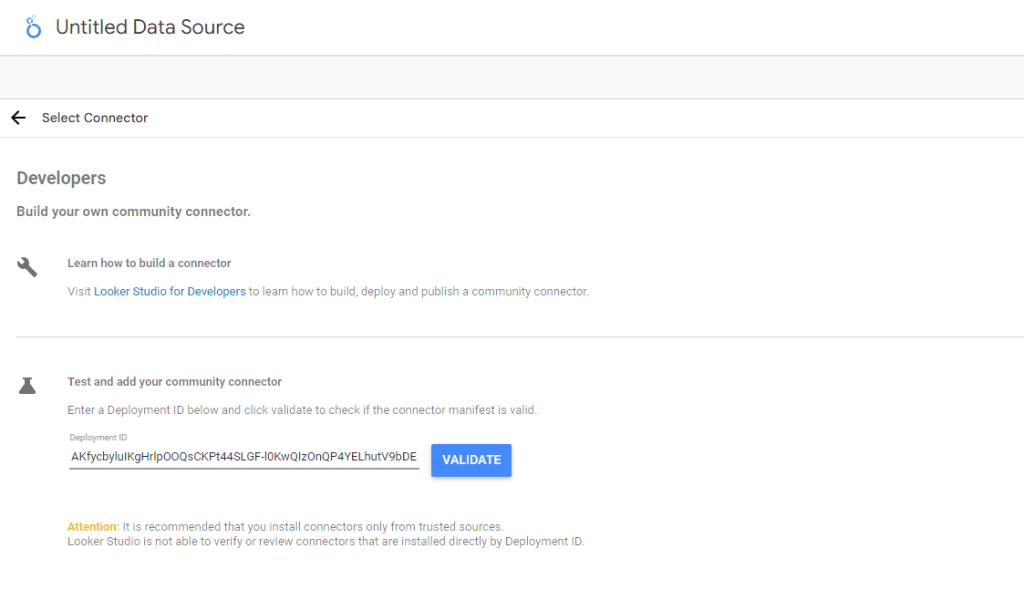
| Keyword Research | AKfycbyluIKgHrlpOOQsCKPt44SLGF-l0KwQIzOnQP4YELhutV9bDEaeWDSyjK2IKIMV5367 |
| Domain Analysis | AKfycbyoI781s9aLmME0rL5BybPZKGE1DfyO4be7lJJTk37gkeDbm1KZZ9leCeo3eIfpKDNnxA |
| Website Audit | AKfycbxt15nabAn9mtk9vC7Qlx1y_FtqV_QELU25zxw6CBIPH1fS9SgNrbCf9UOvknO7334p2Q |
| AI Search | AKfycbxl5pAEsvW6OvIGYW5g52eFM7eY7hq7D39stQhPflMBC6VIeMV8ri839s5XgC5m6yW4 |
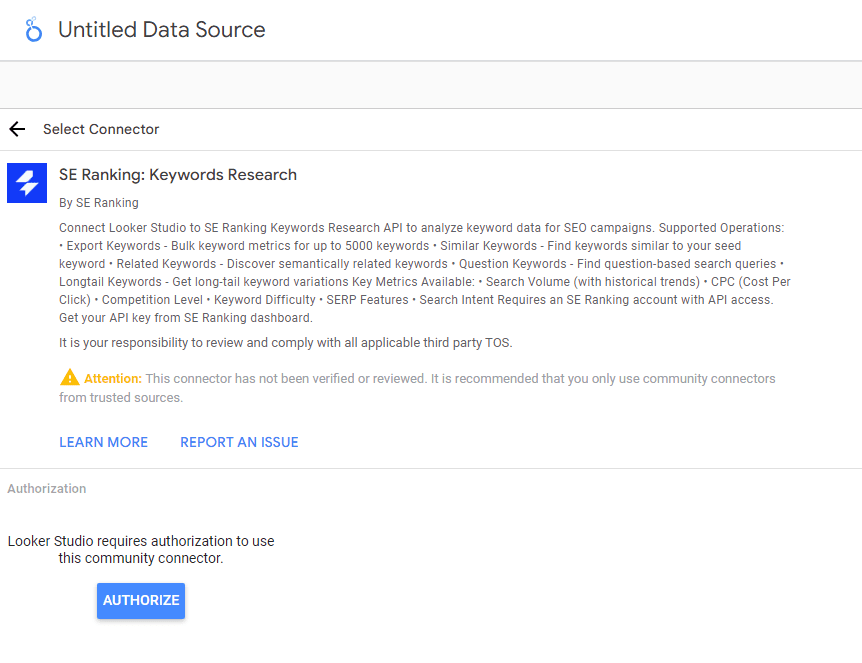
5. When prompted, provide your SE Ranking API token.
6. From the Parameters dropdown, select a particular operation or the All Operations (Combined) option.
7. Configure parameters per selected operation.
8. After parameters are configured, click CONNECT in the top right corner.
9. The SE Ranking data source is now connected. You can customize its fields and start building your report.
Repeat this process for each data source you want to add.
Available SE Ranking connectors and operations
SE Ranking provides four unified Looker Studio connectors. Each connector has its deployment ID and includes multiple operations that you select inside Looker Studio after connecting.
Keyword Research: research, expand, and analyze keywords
Below are the available operations within this connector:
| Operation | Description |
|---|---|
| Export Keywords | Metrics for a provided keyword list |
| Similar Keywords | Similar keyword suggestions |
| Related Keywords | Semantically related keywords |
| Question Keywords | Question-based keywords |
| Longtail Keywords | Long-tail keyword variations |
Domain Analysis: analyze any domain’s SEO performance across regions, competitors, and historical trends
Below are the available operations within the connector:
| Operation | Description |
|---|---|
| Domain Overview (Regional DB) | Country-specific domain overview |
| Domain Overview (Worldwide) | Global aggregated visibility |
| Domain Overview (History) | Historical visibility trends |
| Domain Keywords | Keywords the domain ranks for |
| Domain Competitors | Competing domains |
| Domain Comparison | Compare keywords between two domains |
Website Audit: access and visualize technical SEO audit data
Below are the available operations within this connector:
| Operation | Description |
|---|---|
| List All Audits | View all your website audits |
| Get Audit Status | Check audit progress and status |
| Get Audit Report | Get audit scores and issue counts |
| Get Crawled Pages | List all crawled pages with metrics |
| Get Pages by Issue | Find pages with specific issues |
| Get Issues for URL | Get all issues for a specific page |
| Get All Links | View internal and external links |
| Get Audit History | View historical audit data |
AI Search: analyze AI search visibility and prompt-level performance
Below are the available datasets for this connector:
| Dataset | Description |
|---|---|
| Overview – Summary/Time Series | Overall AI search visibility summary |
| Prompts by Target | AI prompts grouped by target |
| Prompts by Brand | AI prompts grouped by brand |
| Leaderboard | Competitive share-of-voice rankings across domains (rank, domain, share of voice, brand mentions, link citations) |
| Leaderboard – By Engine | Brand presence and link presence broken down by domain and LLM engine |
Usage example: Visualizing domain traffic and keyword position distribution over time
aloyoga.com. The live example report built in Looker Studio is available here.One practical way to use the SE Ranking and Looker Studio integration is to visualize how a domain’s organic traffic and keyword position distribution change over time. The chart visualization will help you understand growth trends, visibility improvements, and shifts in ranking positions.
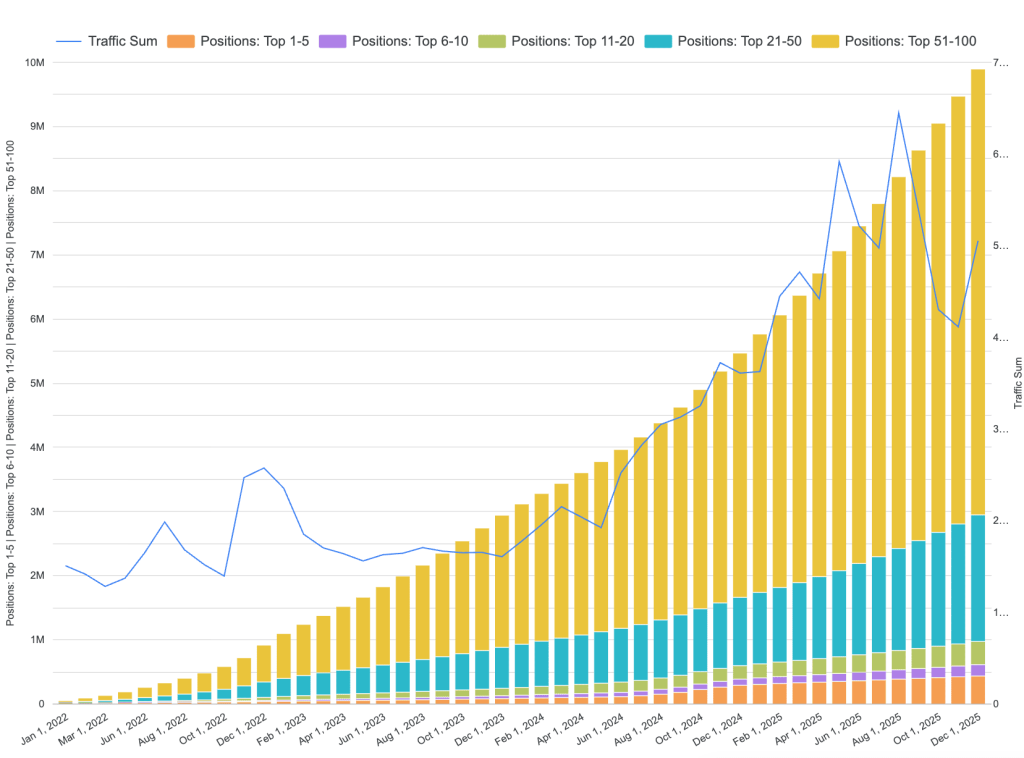
The chart displays:
- organic traffic trend as a line
- keyword position distribution as stacked bars
To recreate the report, follow the steps:
Step 1. Create a new report and connect the data source
a. In Looker Studio, connect the Domain Analysis data source as outlined in Connecting SE Ranking to Looker Studio.
b. From the Select Operation Mode dropdown, choose Domain Overview (History).
c. Click Next.
Step 2. Configure the main parameters
Set the following parameters:
- Domain name:
aloyoga.com - Source (Alpha-2 country code):
us - Traffic type:
organic
Then click CONNECT in the upper-right corner.
Step 3. Insert the chart
a. In the report editor, click Explore.
b. Click Insert → Combo Chart.
Step 4. Configure the chart
Set the following parameters:
Dimension – X axis: Date
Metric – Y axis:
Traffic SumPositions: Top 1-5Positions: Top 6-10Positions: Top 11-20Positions: Top 21-50Positions: Top 51-100
Default date range filter: Custom → e.g., starting from January 1, 2022, to December 1, 2025.
Sort: Date → Ascending
Step 5. Style the chart
Set the following chart series:
Series #1 (Traffic Sum):
- Series type:
Line - Axis:
Right - Cumulative:
No
For the remaining series (keyword position buckets):
- Series type:
Bars - Axis:
Left - Cumulative:
Yes
In the General section, find Stacked bars and toggle the switch to the right.