Data storytelling: How to make SEO insights resonate with stakeholders
-
Data storytelling combines data science, data visualization, relationship management, and narrative skills to communicate data insights and drive action.
-
Key components of a data story include the setup (current situation), the conflict (disruptive event), and the resolution (new reality and actionable insights).
-
Identify the right story to tell by monitoring meaningful events, knowing your audience, and focusing on metrics that matter most to them.
-
Create an SEO data story by maintaining objectivity and building the story around one central insight or “protagonist” metric.
-
Deliver the SEO data story effectively by providing context and benchmarks, using clear language, choosing the right visualizations and colors, suggesting next steps, and encouraging discussion through live story broadcasting.
-
Develop your data storytelling skills through practice and utilizing various resources, including books, online platforms, and relevant blog posts.
You’re not alone if you’ve ever struggled to explain SEO to people who are unfamiliar with how it works, whether its colleagues in other departments (i.e., engineering or product teams) or, clients and stakeholders who aren’t even affiliated with the SEO field. Each of these groups has unique goals, priorities, and differing degrees of familiarity with SEO. This can make it difficult to convey the importance and impact of your SEO efforts. Thankfully, the data storytelling technique we’re about to unfold can help you overcome this challenge.
In this article, we’ll explore the power of data storytelling and discover how to make your SEO data more engaging, persuasive, and actionable. We’ll also provide practical tips and techniques for becoming a master storyteller at each stage of the process.
What is data storytelling?
Data storytelling is the art of transforming raw data and metrics into a compelling narrative that can help you bridge communication gaps, get everyone on the same page, drive decision-making, and produce results worth mentioning.
Key components of data storytelling
Build your data story around the following three components: the setup, the conflict, and the resolution (according to Harvard Business Review).
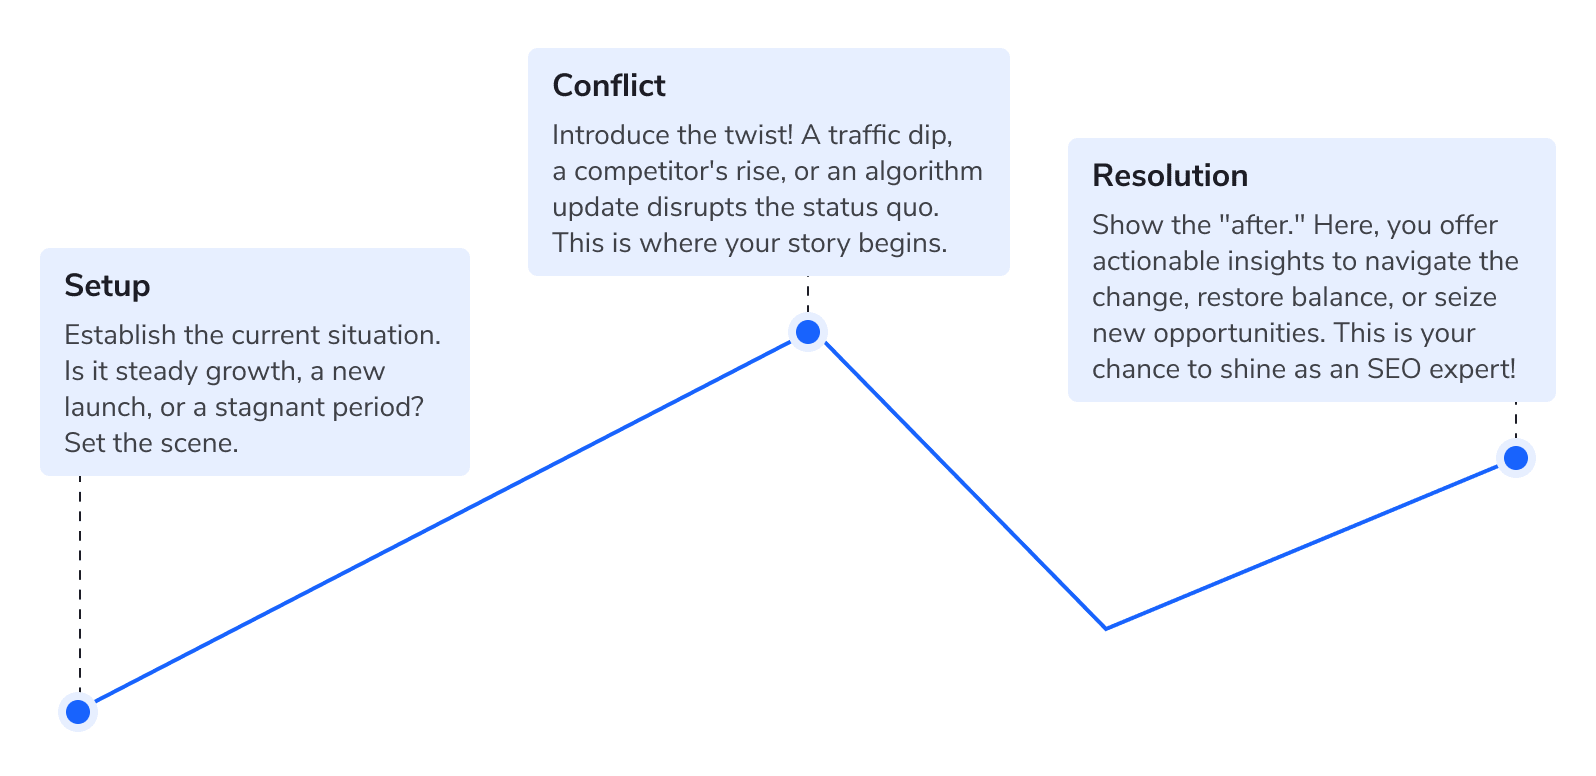
- The Setup paints a picture of the current situation. Maybe it’s been a steady year or you’re starting from a new baseline. Either way, you need to set the stage.
- The Conflict is any event that changes this reality and disrupts the status quo. It could be a sudden drop in traffic, a new competitor, or an algorithm update. This key element takes your data story from bland to bold.
- The Resolution is the new reality that emerges from the conflict, where you will impart actionable insights. This helps your audience navigate changes, either returning to the previous status quo or capitalizing on new opportunities. As an SEO consultant or SEO agency manager, this is your opportunity to provide expert guidance and achieve meaningful results.
What skills do you need to transform data into a story?
Data storytelling is a technique combining various skills and fields to effectively communicate data insights and compel people to take action. Carefully chosen data, knowledge of your target audience, and a compelling story built around these insights all form the foundation for effective data storytelling. These insights paint a picture of data storytelling as the skill of explaining raw data through narrative, using a mix of data science, data visualization, relationship management, and narrative skills. Let’s explore why.
- Data science skills help you understand how to extract and manipulate the right data, where to find it, and which data to include in your story. This is the most technical skill-set within data storytelling.
- Data visualization is another key component because it involves choosing the best charts, graphs, and color combinations to effectively present your analysis. It also informs decisions on choosing the right reporting medium.
- Relationship management is also a critical aspect of data storytelling. To create an impactful story, you need to understand who your stakeholders are, what they want to achieve, and what motivates them to take action. Knowing this helps you tailor your narrative to their specific needs and goals.
- Narrative skills require skill acquisition in communication and creativity. You should be able to thoroughly analyze your data, understand what it says, and present it in an unbiased manner. At the same time, your findings should guide your audience toward the appropriate actions or next steps.
Getting data storytelling right requires a thorough understanding of each of these elements. Apply these data storytelling techniques to your SEO strategy to create more engaging stories that drive action more effectively. It’s a much better method than reporting dry stats.
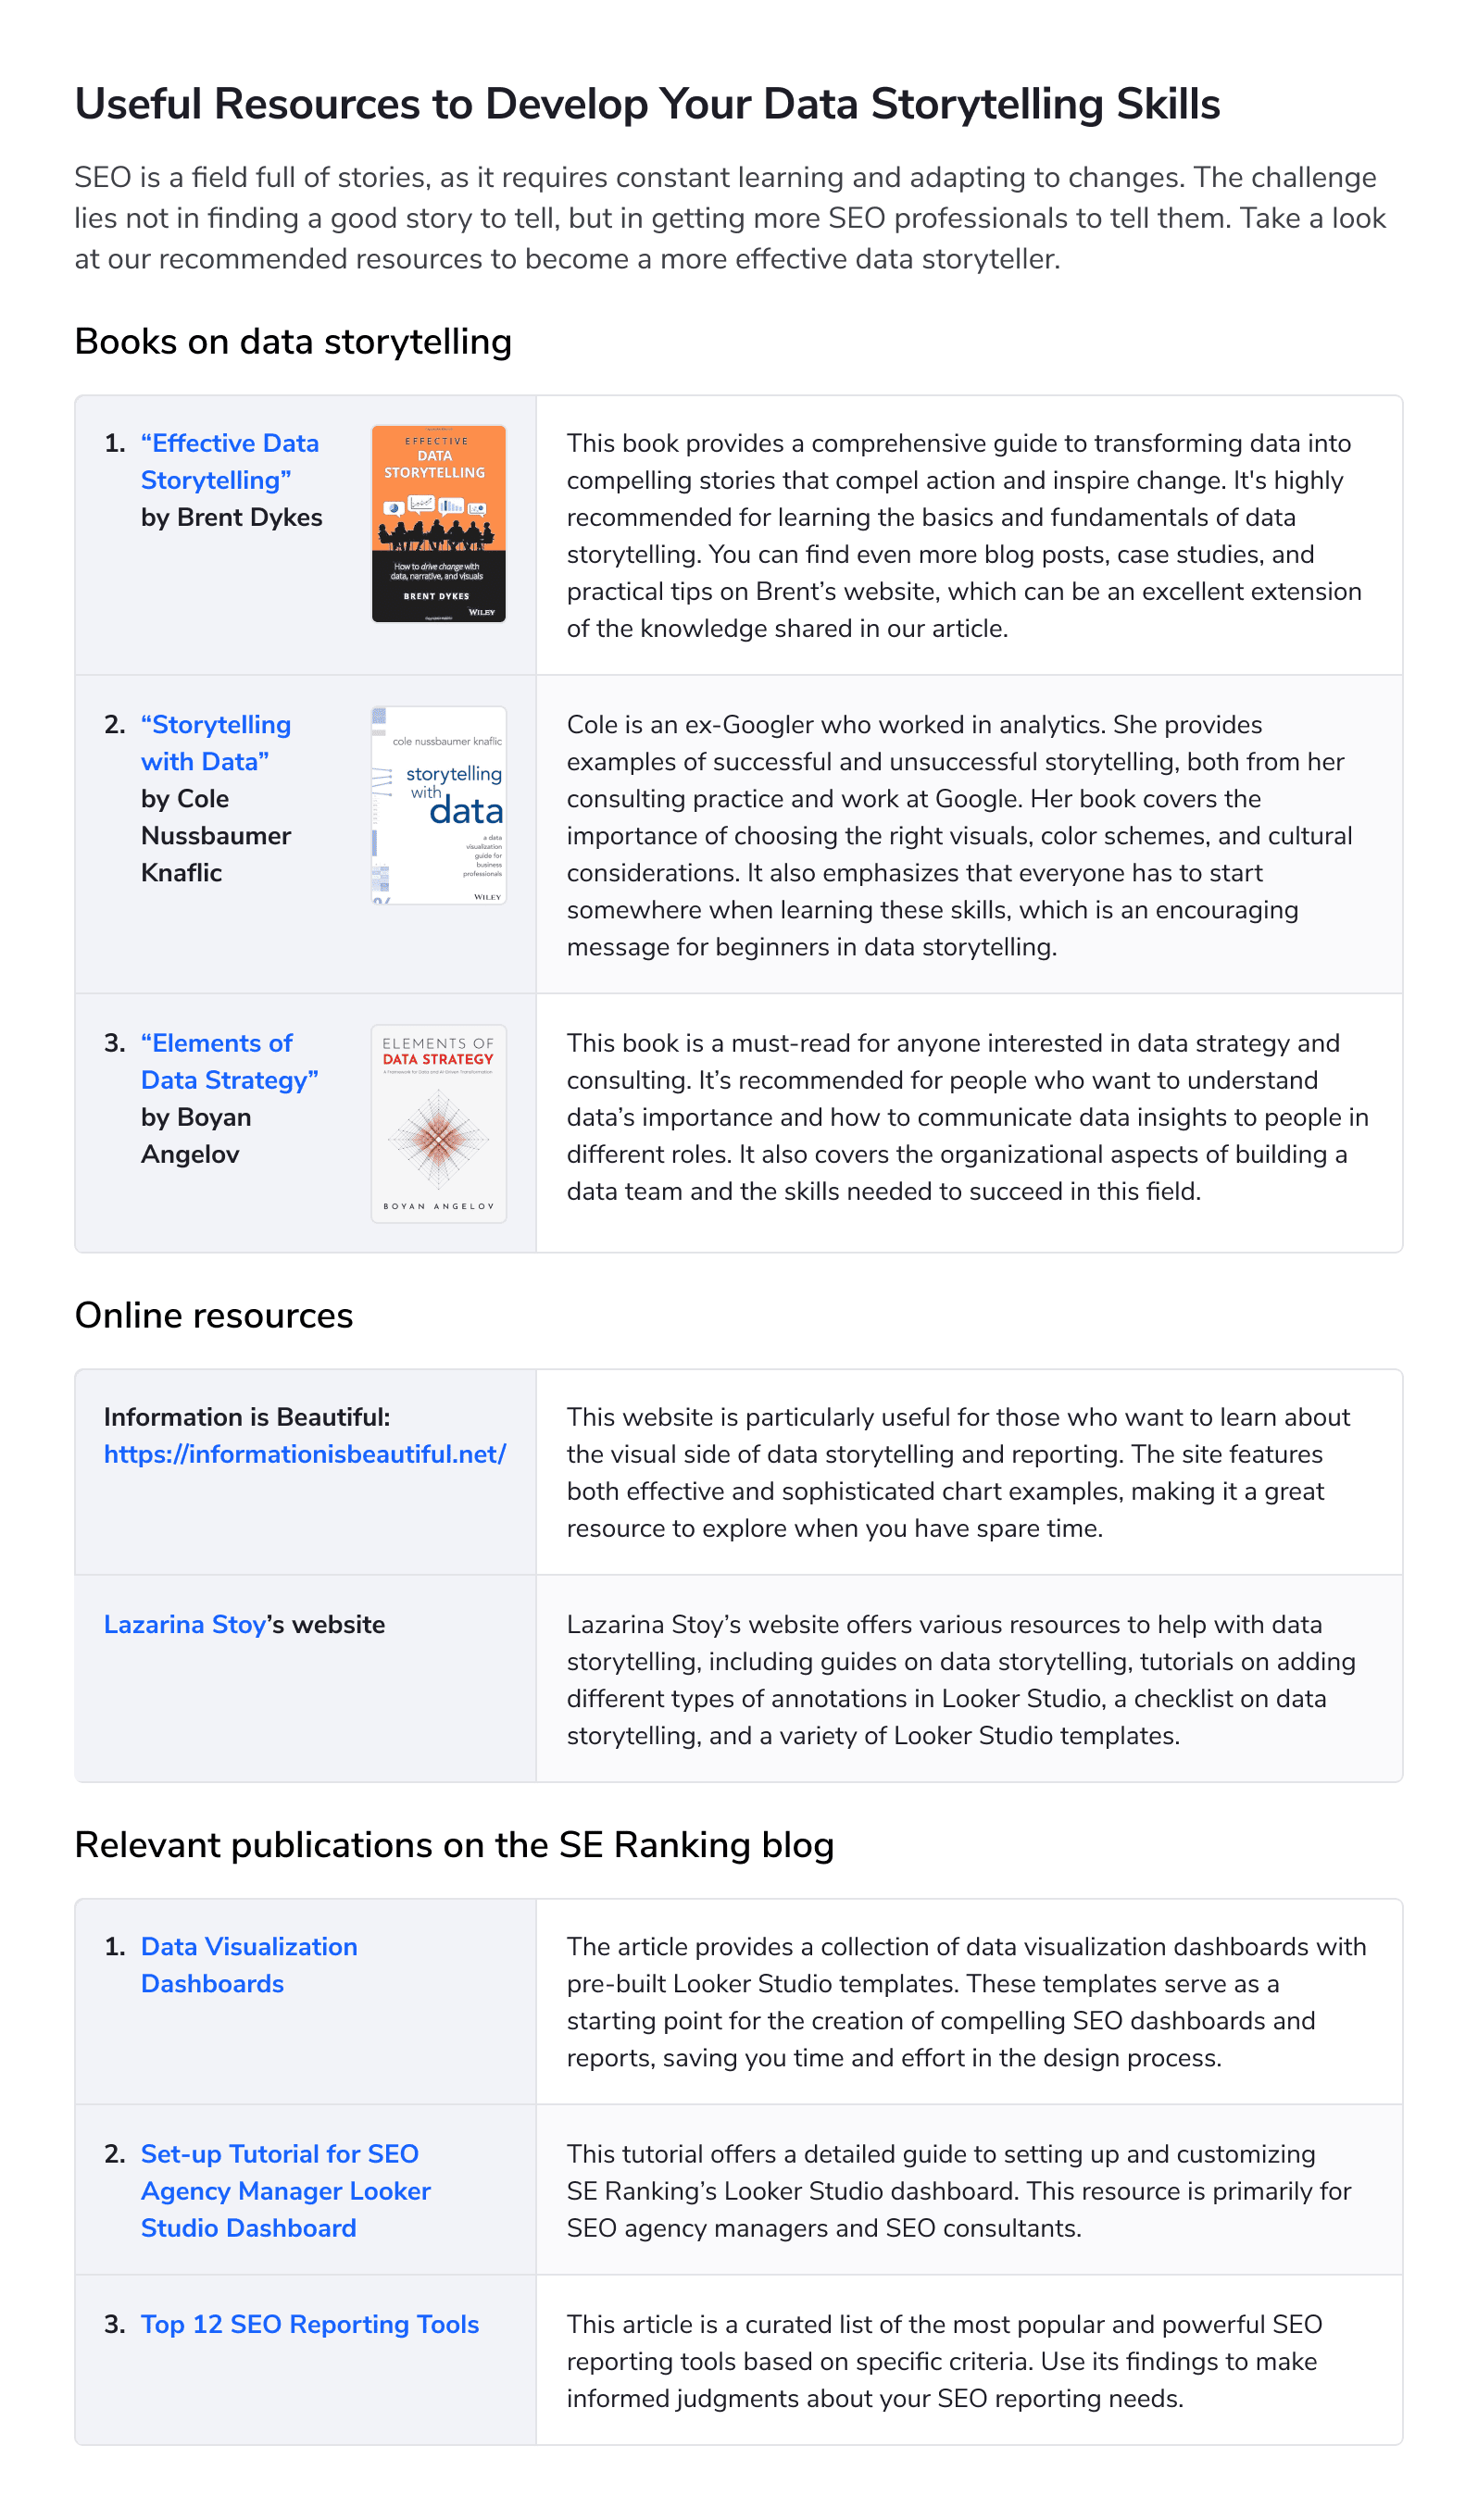
But becoming a data storytelling pro takes time. That’s why we created this list with helpful resources. Use them to master data storytelling faster.
Why reformat raw SEO data into a story?
- Stories are more engaging, practical and memorable than dry stats
While SEO pros have access to mountains of data and various reporting methods, from decks to fancy dashboards, none of this matters to clients if they don’t like the way you present it to them. Bombarding clients with dry stats, for example, will not work. This makes it hard to evaluate if your strategies are working and if clients feel supported.
Stories are more engaging. They are easier to remember than dry facts and figures because they capture your audience’s attention and make data relatable. Weaving data into a narrative helps you build bonds with your listeners and facilitates smoother presentations. In fact, many studies show that people tend to remember stories better than raw statistics. For example, stories activate parts of the brain associated with emotion, memory, and decision-making. Raw data, on the other hand, rarely sparks the emotions necessary for driving people to take action.
- Stories make SEO relatable to non-SEO audiences
Understanding the “why” behind technical data can be challenging for clients who are unfamiliar with SEO.
Now, picture yourself as a client:
The SEO agency you hired has just bombarded you with charts, graphs, and numbers, each of which are difficult to grasp. It’s overwhelming and impersonal. It doesn’t tell you the “why” behind the data, and it certainly doesn’t inspire confidence in your SEO strategy.
Storytelling allows you to translate complex data into an understandable format, using relatable analogies and examples. This can be as simple as adding annotations for key past events, incorporating expert commentary into the reports, or making sure each participant understands the role and importance of key metrics via providing them with contextual documentation.
- Stories help to showcase your expertise while boosting persuasiveness and trust
Pairing data analysis with project decision-making while considering the client’s past experiences makes the process more interactive. This leads to more persuasive decision-making, indicating that you’re not just throwing ideas around; you’re showing your client what has worked before and why it will work again.
Think of data storytelling as a well-designed dashboard; it only shows key information. The goal isn’t to ditch data, but to use it to tell a story. By explaining the “why” behind the numbers and how they connect to the client’s goals, you help them understand your analysis, your suggested next steps, which allows them to move forward faster. This makes you a more persuasive and trusted consultant and business partner.
- Storytelling transforms stakeholder perception and drives them to act on recommendations
In real life, storytelling can change how stakeholders think, motivating them to act on your ideas.
Real-life example:
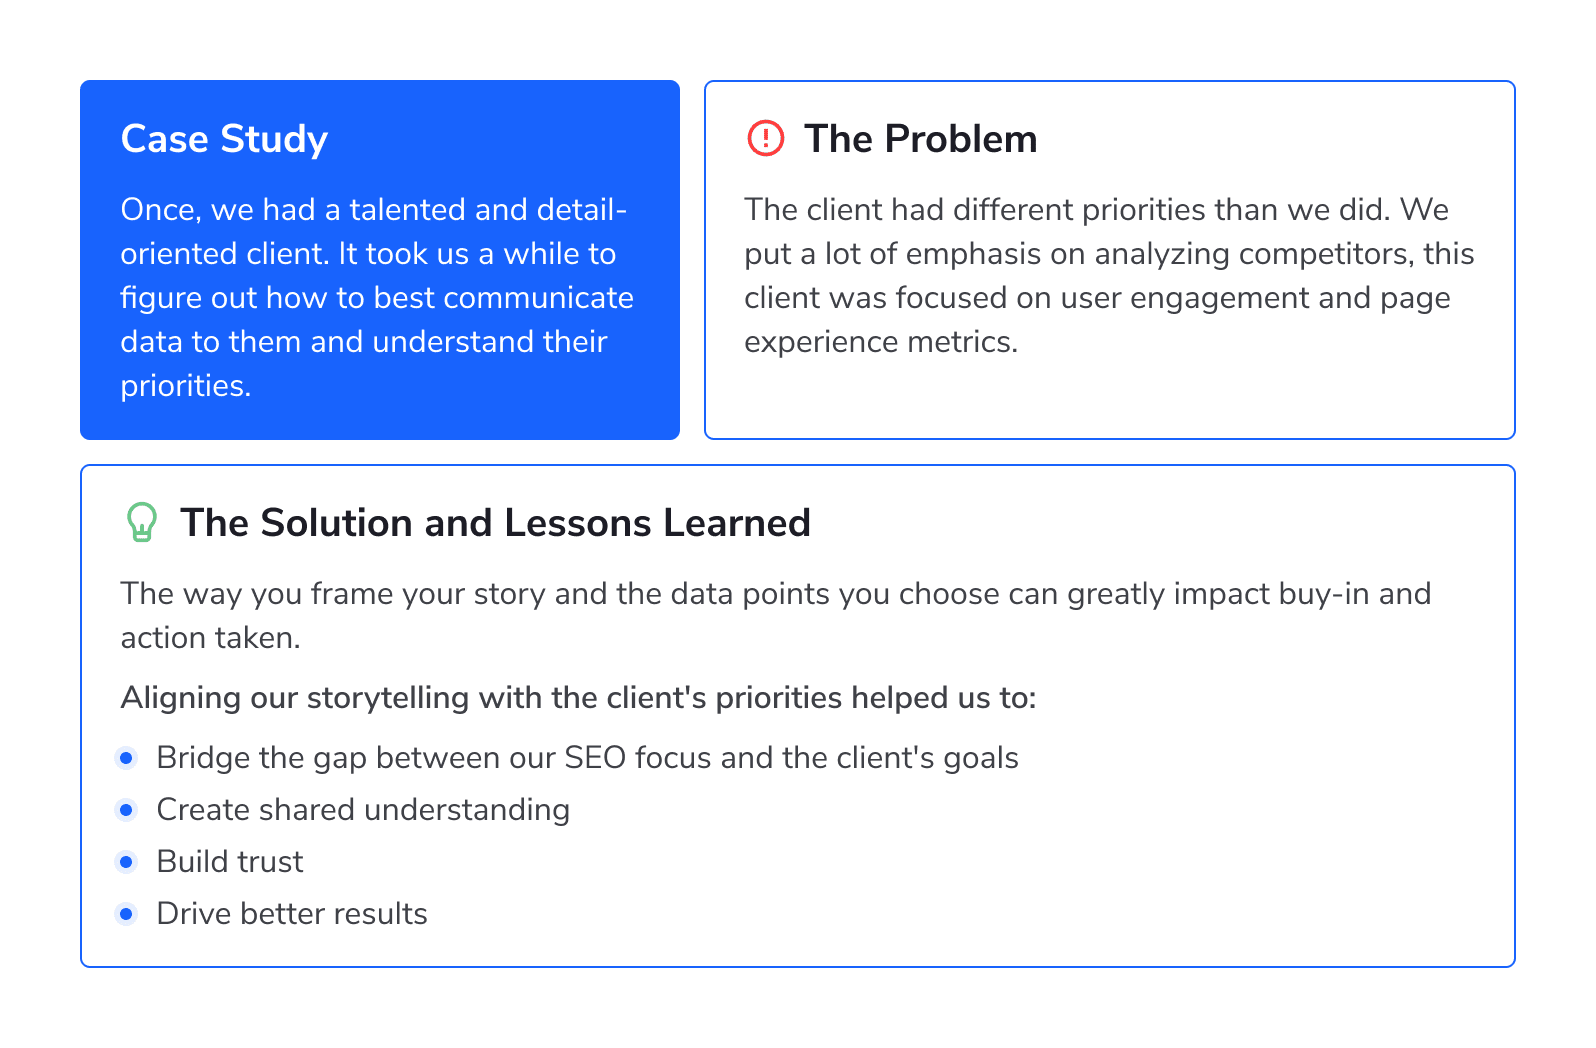
Let’s take a look at a client we had who was remarkably talented and detail-oriented. It took us some time to figure out how to best communicate data to them and understand their priorities.
What we did: We explored the client’s motivations and goals to discover their definition of success as it pertains to our partnership, their brand, and their product.
Challenges we faced: We discovered that the client had different priorities than we did. As an SEO agency, we often utilized competitors as a way to demonstrate best practices and the actions we needed to take, but our client didn’t care about the competition at all! Instead, they cared most about and invested heavily in user engagement and page experience metrics.
Lessons learned: Our arguments for implementing recommendations didn’t land because we focused initially on aspects that didn’t resonate with the client.
This experience taught us that even with the same data and recommendations, how you frame your story and the data points you focus on can make all the difference in getting buy-ins and driving action.
By shifting our storytelling approach to align with the client’s priorities, we bridged the gap between what mattered to us as SEO professionals and what mattered to the client and their overall marketing goals. This helped us create a shared understanding, build trust, and drive better results.
The takeaway? Data tells, stories sell. Weaving data into a narrative with a clear protagonist (specific metrics), antagonist (challenges faced), and a satisfying resolution (successful SEO results) creates an emotional connection with the stakeholder. This emotional investment motivates them to take action and achieve the outcome you desire.
Dos and don’ts of data storytelling in SEO step by step
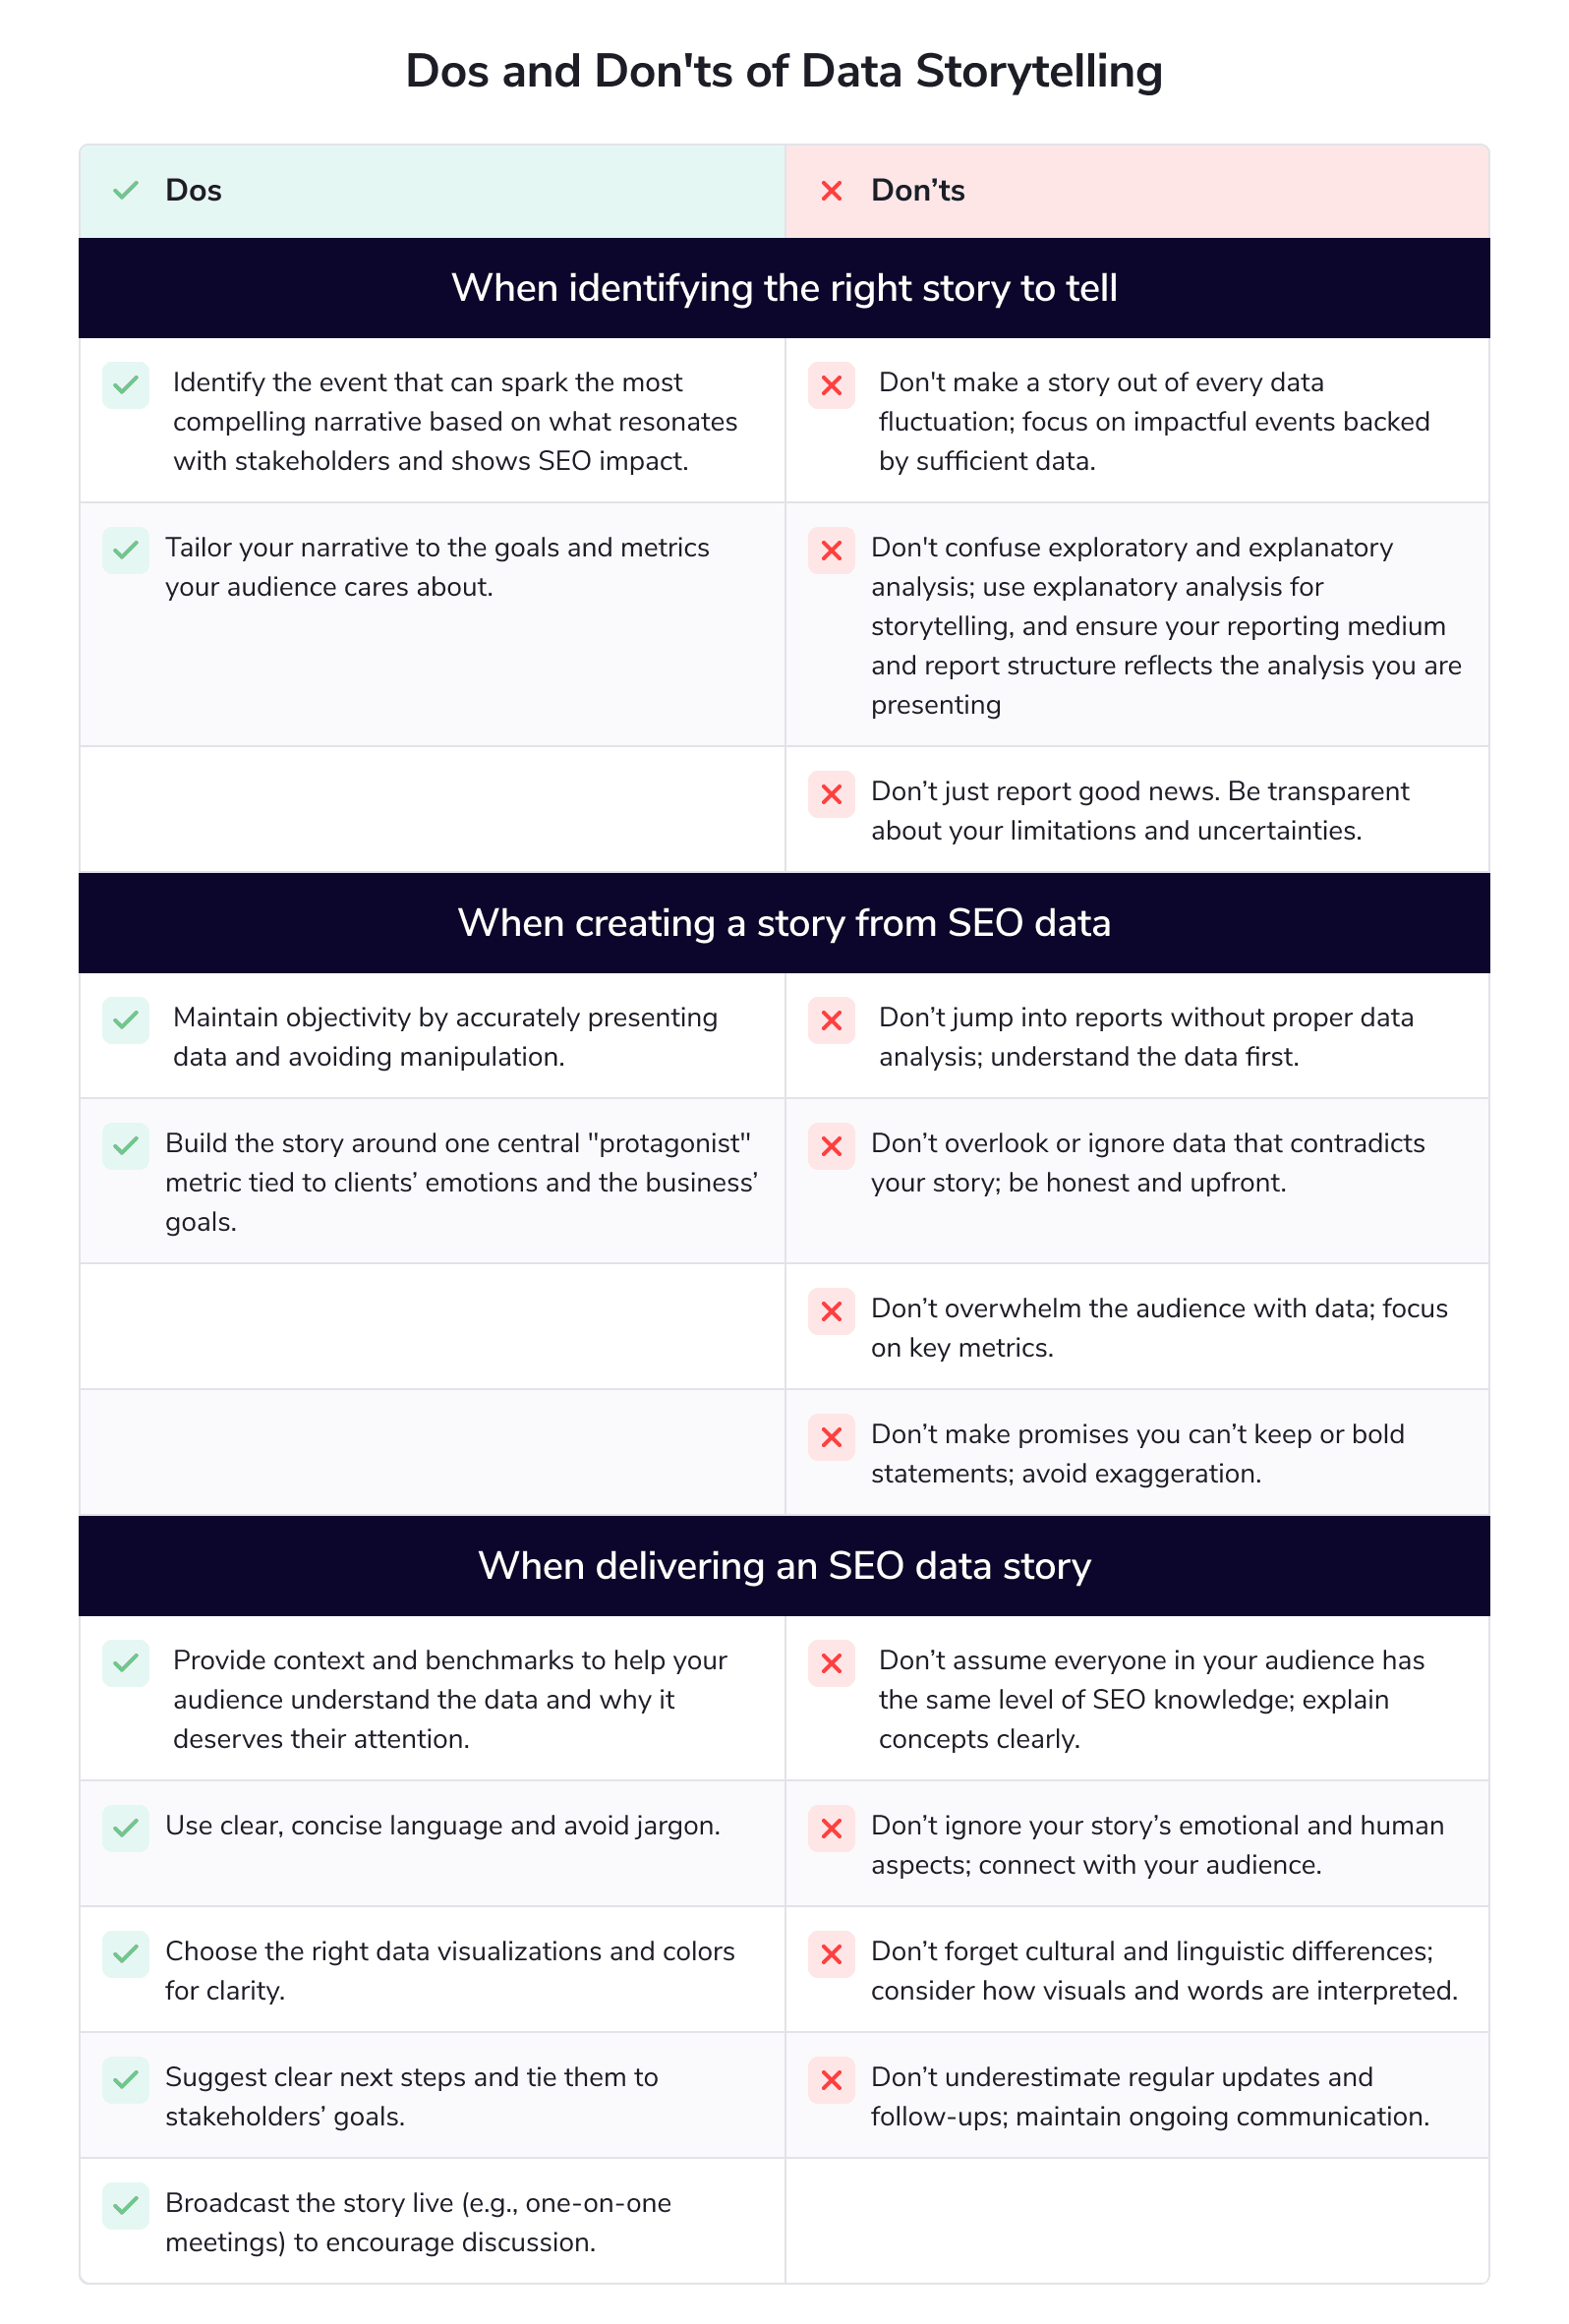
Identifying the right story to tell
Look out for meaningful events. They could be story triggers.
There is almost always a story to tell around the SEO data you work with. Major Google updates, Google’s new generative AI experiences, SERP volatility, site migrations, and UX changes can all largely impact your website’s performance. These events also provide interesting stories to discuss with regard to your SEO data.
By monitoring potential “conflict” events and looking at past data, you can find valuable insights and stories. These stories illustrate how changes have impacted your site’s performance.
When deciding which stories to tell, pick ones that match your stakeholders’ goals, appeal to your audience, and demonstrate the impact of your SEO work.
Know who your audience is and tell a story with the metrics that matter most to them
As mentioned earlier, one common challenge for SEO professionals is reporting data to audiences that misunderstand or lack context around said data. Data storytelling can help bridge this gap, but only if you know who you’re talking to.
There is a major difference between the type of report you need to present and the story you must weave. Doing it right depends on what your audience responds to. For example, when presenting data to a team member or a project manager, you may need to provide more granular details and tactical insights. When presenting to a CMO or other C-level stakeholder, weave your narrative around higher-level strategies, KPIs, and business impact.
Providing a generic report to a diverse group of people without considering their individual needs leads to confusion and a lack of actionable outcomes. If you’re flooded with follow-up questions or clarification requests afterward, your story probably didn’t resonate well with your audience.
To create an effective data story, consider what matters most to each group:
- Which metrics are important to them?
- What actions should they take based on your insights?
- How does your SEO work support their goals?
Segment your stakeholders based on their roles, responsibilities, and objectives. Identify the key metrics and insights that matter most to each group, and use this information to build a targeted narrative that speaks directly to their needs.
Don’t make a story out of every data fluctuation
Remember, not every data point or change requires a detailed story. There is no need to force a story where there isn’t one.
When picking a story to tell, be cautious not to overwhelm your audience with every potential story or piece of news that comes out of every minor data fluctuation. Otherwise, you risk creating “influencer-style” content, which is notorious for providing low-value or no-value content.
Make sure your stories match what your stakeholders want and provide useful information that can help them achieve real goals. The stories you choose should also contain enough data to back your claims.
Being picky and smart about the stories you tell helps people to understand why SEO matters. It also results in more positive outcomes for your company or clients.
Don’t confuse exploratory and explanatory analysis
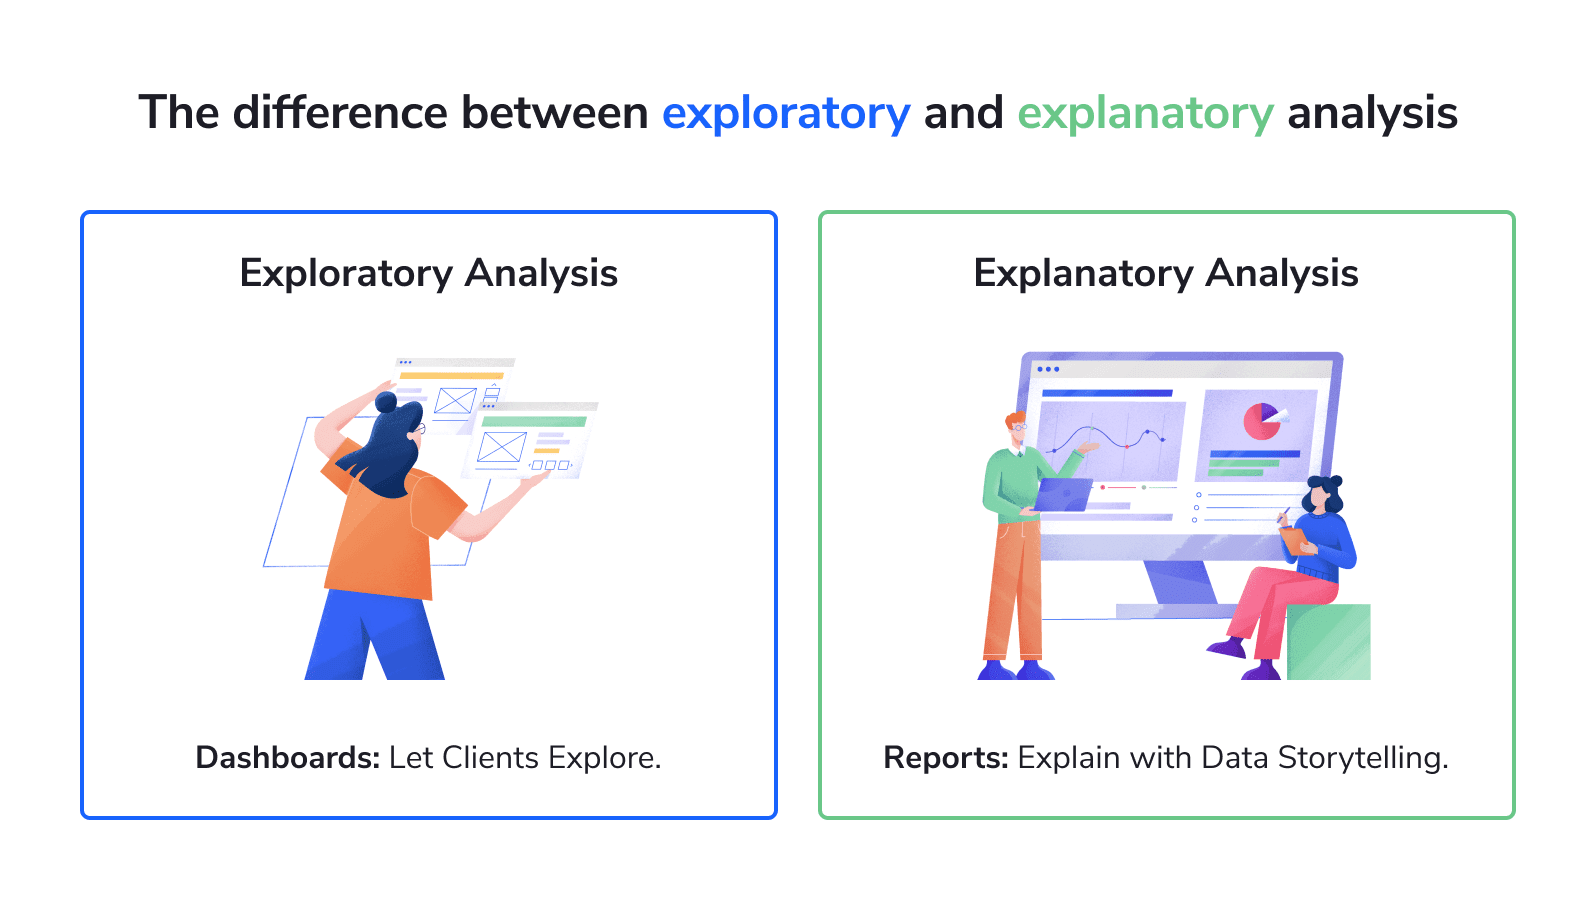
One major data storytelling mistake to watch out for is mixing up exploratory and explanatory analysis. These two types of analysis differ, much like the distinction between dashboards and reports. For example, you can’t use a dashboard in place of a report. While dashboards are for letting people explore, reports are for explaining and telling a story.
For example, when using the SE Ranking platform, you would be performing an exploratory analysis when letting clients use Looker Studio dashboards or Google Sheets to fiddle with the data. It’s possible to add some comments or quick snippets of analysis to these dashboards, but you don’t have to apply a storytelling component. If you’re new to building or customizing these dashboards, our Looker Studio tutorial for SEOs provides a step-by-step guide to get you started.
Explanatory analysis operates differently. It revolves around using storytelling to shed light on a specific phenomenon or outcome. This is when you dig into the data and find the key points. You then build a story around these insights while showcasing the most important and relevant information to your audience.
For example, you would use explanatory analysis when doing your monthly or quarterly reports, or when you are presenting a report on the impact of an event to the business (like an algorithm update or a new competitor entry in the market).
Avoid confusing these two types of analysis. Doing so can cloud your data insights and make it difficult to draw clear conclusions from your story.
Don’t report good news only
We’ve all been there, staring at a data report filled with less-than-stellar results. It can be tempting to downplay bad news or focus solely on the positives. But in SEO, good client communication and transparency means building trust, having open communication channels, and maintaining and improving upon integrative SEO strategies, and sometimes things don’t go as planned and performance is entirely out of the control of the organization.
Many SEO professionals, especially those early on in their career, might attempt to protect their ego and avoid disapproval from clients by sugarcoating data. However, this “yes-chasing” mentality undermines your credibility and creates a poor foundation for you and your client’s relationship.
So, be honest about performance, data limitations, or uncertainties.
This shows to your clients that you have integrity while also setting the stage for realistic goal setting and strategy development. Think of reporting data that falls short of the mark as an opportunity to identify areas for improvement and adjust strategies based on a clearer understanding of reality.
Be proactive with your client about discussing potential roadblocks and challenges. The key is to present your analysis alongside informed, data-backed recommendations, and be transparent if resolving the situation requires help.
Creating a story from SEO data
Maintain objectivity by presenting data accurately
Creating impartial SEO reports is crucial for building trust and inspiring your clients to take action.
However, you may encounter one common pitfall when attempting to engage your audience. The pitfall? Getting carried away and telling a story that you want to believe without having the required data to support it.
For example, some companies in the SEO industry have made quick decisions based on the hype surrounding generative AI and ChatGPT in particular. Some even removed their content teams and replaced them with ChatGPT. This was a flop on their part, as the hype around generative AI and its capabilities in creating high-quality content was not based on concrete facts.
The lesson here is to always stay objective. Present your data accurately and avoid letting your opinions or desires influence what you say and do.
Build data stories around a central insight or “protagonist” metric
Take the example of the client we worked with, where their focus didn’t include performance evaluation, based on competitors’ strategy or the market dynamic, but ours did. This demonstrates how the data points you focus on can completely change the outcome. By honing in on a primary insight or “protagonist” metric that connects with your client’s emotions and goals, you can create a story that captivates and inspires them to take action.
In this instance, we quickly discovered that the client was motivated by the fear of organic traffic as a percentage of total traffic declining, which of course, as we know, can be influenced by competitors’ strategies but is also influenced by synergies between our team and others. By focusing on these emotions and tying them to metrics that the client would care about based on their priorities and worldview, we were able to present our suggested actions and lack of implementation as a risk to the overall organic search channel.
This approach of pivoting the reporting while keeping a more or less similar strategy and recommendations was a subtle change, but effective enough to push the program in the right direction. For example, when presenting a project idea centered around making content improvements, we demonstrated the importance of quality content for user experience and revenue, for maintaining traffic, and for keeping the business aligned with best practices for optimal search engine visibility, as opposed to making direct competitor comparisons as a way to evoke action.
The trick is to focus on one central metric but connect it to the metrics your clients resonate with and care about the most. This helps them see the bigger picture and make decisions quicker.
Don’t jump into reports without understanding your data
This is a common pitfall for beginners. Novices might rush to create a report without taking the time to analyze the data. They may focus on building a visually appealing presentation but fail to dig into the performance metrics. This leads to incohesive presentation, often centered around parroting metric changes as opposed to tying performance with actions and discussing the outcomes, or otherwise presenting data without a clear narrative. Creating pretty reports with improperly conveyed or understood data is also a huge waste of time.
Analyze your data first. Look for connections, patterns, and insights. This will lead to a more impactful and informative SEO data story.
Don’t overlook or ignore data that doesn’t support your story
If some of the data doesn’t support your narrative or shows poor performance, include it and address it honestly. It’s better to admit when you don’t have enough reliable data to make a decision (or create a report) than to present a story based on incomplete or inaccurate information.
Honesty is the best policy. It might seem counterintuitive to present data that doesn’t look good, but doing so actually makes you look more trustworthy. It shows that you care about the facts and refuse to twist things to fit some arbitrary agenda.
Leaving out data that contradicts your story can also backfire in the long run. If people find out that you are hiding something, they might lose trust in what you say.
Be upfront with all the information, even if it’s not ideal. This makes you a reliable source worth their time and attention.
Don’t overwhelm your audience with excessive data
Don’t try to cram every single metric and detail into your report or presentation. Earlier we mentioned that well-designed dashboards only show key information. The same rule applies here.
Too much data can overwhelm your audience and muddy the key insights you’re trying to convey.
Be selective. Highlight the metrics that matter most no matter how positive or negative their performance is. This approach keeps your story clear, concise, and easy to understand.
Don’t make unconfirmed future promises or bold statements
Don’t exaggerate to scare your audience into taking action or make crazy promises for ROI or traffic gains that you can’t substantiate. Most clients are aware that magic bullet projects or decisions capable of fixing everything or completely tanking a company’s performance are rare and almost never happen.
The thing is, when you really want to push a project, it’s tempting to use a dramatic, “doomsday” kind of language, like “we have to do this or else.” But it’s important to keep things balanced.
Be patient, keep yourself in check, and build trust and authority with your audience over time.
Delivering the SEO Data Story
Provide context and benchmarks
SEO doesn’t happen in a bubble. Context matters.
As an SEO expert, your job is to explain the rules of SEO to people who aren’t familiar with the industry. Break down the meaning of different SEO metrics, how they compare across industries, and how they relate to the metrics the client already cares about.
You can provide this context in the following ways: during one-on-one coaching sessions, in the report documentation, or even in an email before your presentation (to offer a brief introduction to the metrics you’ll be discussing).
The key is to find common ground. Bridge the divide between what you know and what’s important to the client and their role to provide context without confusing the client.
Use clear, concise language and avoid jargon
Present your SEO data wisely. This means acknowledging that not everyone in your audience has the same level of expertise. Using too much technical jargon can confuse or alienate people, making it harder for them to understand the key ideas in your presentation.
Focus on explaining concepts and metrics using simple, accessible terms that your audience can relate to. Break down complex ideas into easy-to-understand chunks, and provide examples or analogies when necessary to help clarify your points.
Choose the right visualizations and colors
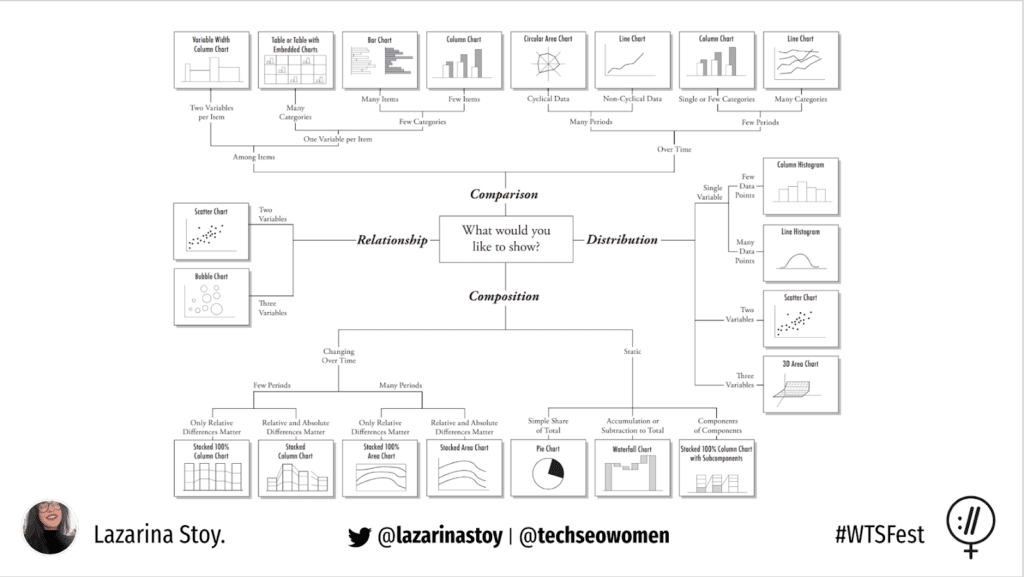
There are two key aspects of visualization that can go wrong: choosing the wrong chart and using colors incorrectly.
Before picking a chart, perform the two following actions.
First, study the data thoroughly so you understand it well. Second, zero in on what you want to show your audience. Only then can you choose the right chart. Also, base your decision on whether you’re trying to show the distribution, relationship, comparison, or composition of a metric.
Now, let’s talk about colors. It’s easy to choose color schemes that aren’t quite right. For example, you may miss the chance to use a bold color to highlight a specific performance insight that drives the story home.
Color theory is also very important, especially when you’re working with international teams. In fact, some colors are considered offensive in certain countries, illustrating that people from different cultural backgrounds perceive colors differently.
Take a look at the infographic below. It demonstrates how colors are linked to culture in various countries.
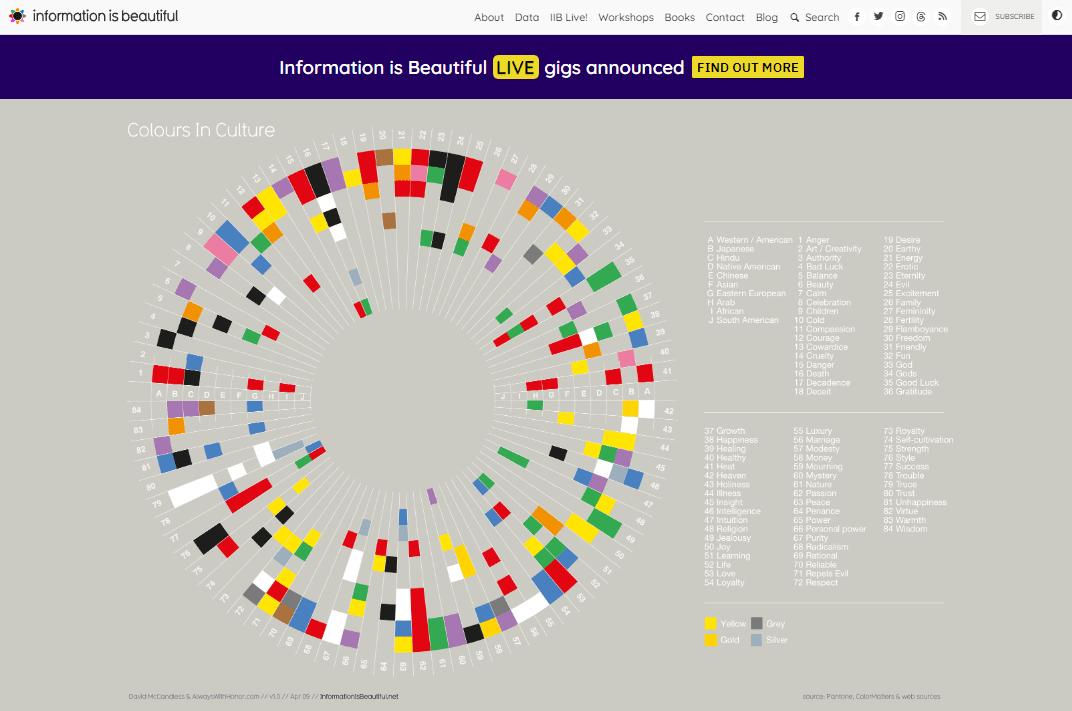
This suggests that you should be extra mindful about how you design your data visualizations.
Here’s the key takeaway: your goal is to simplify the data so your audience can easily spot patterns and insights. You want to clarify, not confuse (or even worse – offend) your audience.
Suggest clear next steps and tie them to stakeholder goals
Creating a compelling SEO data story goes beyond presenting insights and findings. You also need to provide clear, actionable recommendations for next steps. This helps your audience understand how to apply the data to their specific situation and goals.
If the data shows good performance, suggest ways to build on that success. If the data shows poor performance or challenges, provide specific steps for fixing those issues quickly and getting back on track.
Simply put, make your data actionable. Help your audience understand how to use this information to achieve specific goals, including goals like increasing website traffic, boosting sales, or stomping the competition. Show your clients how your suggested actions align with their priorities to get them on board and take action.
Broadcast the story live to encourage discussion
Numbers tell a story, but stories around SEO data can get lost in a sea of charts and graphs. While reports are valuable tools, we’ve found that the most impactful way to communicate SEO performance is through conversation, particularly one-on-one reports and meetings.
Having direct conversations with your clients opens up a space where you can explore the data together. You can also answer any questions your clients might have and give them a much clearer understanding of their website’s current condition. Even a quick, five-minute session can make a difference. Simply walk your client through the data, explain its significance, and highlight key past and future actions.
Some clients are tech-savvy and prefer regular reports by email. That’s totally fine! But it’s still a good idea to maintain somewhat regular communication with them. After all, you are not only an SEO consultant, but a business growth partner. It’s up to you to help them make even more sense of the organic search performance data and how it connects to their broader business goals.
Don’t assume your audiences have the same levels of SEO knowledge
Remember, not everyone knows SEO terminology like you do. So your next task is to convey your insights through storytelling in as accessible a manner as possible. Think “explain it to me like I’m five.” Break down complex concepts, such as metrics and competitor data, into simple terms.
Picture this: you’re about to give a presentation, and someone walks in. This person has no clue what you’re talking about. You would need to have extra info ready, like a Google Doc that explains what bounce rate means. This is especially true if bounce rate is the “protagonist” of your data story. If you’re going to spend half an hour on it, you better make sure everyone in the room understands what it is and why it matters.
This is why it’s important to begin by understanding who you’re talking to and what they know. There’s also nothing wrong with educating people! If someone doesn’t know what SEO metrics are or why some are more important than others, your data story presents a great opportunity to practice your teaching skills.
Don’t ignore the emotional and human aspects of your story
Your audience is made up of real people, each with unique goals, challenges, and emotions. By taking the time to educate your audience, explain key concepts, and provide context, you’re also showing that you care about their comprehension of the material and their success with using it. So, the next time you give your presentation, they’ll remember to do the same for you. The key is to foster a collaborative spirit and close that emotional distance.
Being mindful of the emotional and human aspects of your story and presentation creates a more engaging and impactful experience for everyone involved. That’s how to make a genuine difference with your SEO data story.
Don’t forget to consider cultural and linguistic differences
As mentioned above, people from different backgrounds may interpret pictures, colors, and even words differently. What is clear to you (based on your cultural context) could be confusing or even rude to others.
To combat this, take note of your audience’s culture before presenting. Consider which cultures deem what words, pictures, and colors as appropriate or inappropriate, and what constitutes as inclusive language for them. If you’re unsure, consult colleagues or local experts who are familiar with your audience’s cultural nuances.
Don’t underestimate the importance of regular updates and follow-ups
Stay committed to sharing regular updates and check-ins, whether they are weekly or monthly. Arranging regular touch points shows that you’re actively monitoring and working on your client’s SEO. This also opens up an avenue for ongoing dialogue and collaboration.
In addition to providing frequent updates, don’t forget how vital it is to offer comprehensive reviews on a quarterly or yearly basis. This is the best time to dive deeply into the data, assess the overall impact of your efforts, and discuss future strategies and goals.
Conclusion
The first step is always the hardest. But, if you follow the advice provided, we’re confident that your efforts will pay off. You’ll get better at communicating SEO data in no time!
Data storytelling isn’t about cramming every detail into your story. It’s about picking the most important points and communicating them directly, even if the results aren’t perfect. People appreciate honesty and your willingness to help them make sense of the data. That’s what makes a data story truly powerful.
Ready to build your first data story? Stay on the right track with this handy data storytelling checklist.

