How to Analyze AI Overviews and Their Impact on Organic Traffic: A Short Step-by-Step Tutorial
Google’s AI Overviews are shaking things up in SEO, but how can you tell if this new feature is boosting your organic traffic or holding it back?
Put simply? You need to know how to analyze its impact.
In this simple step-by-step guide, we’ll walk you through SE Ranking’s custom methodology for measuring AIOs’ impact on website traffic. Tools like SE Ranking’s AI Overviews Tracker, SE Ranking’s Rank Tracker, and Google Search Console will be your best friends here. The first tool will help you track the presence of AIOs and your website’s position for them, while the other two will help you gauge your overall organic performance and see how AIOs are influencing your traffic.
Let’s get started!
Key takeaways
-
Step 1:
Track your keyword rankings with SE Ranking’s Rank Tracker. We recommend waiting at least 30 days for a clear ranking trend outlook.
-
Step 2:
Add your target keywords to SE Ranking’s AI Results Tracker to monitor the presence of AI Overviews. Collect data from the same period as Rank Tracker’s to gather enough data for a meaningful AI Overview analysis.
-
Step 3:
Get click data from Google Search Console by query and page. You can get a more comprehensive view by including additional metrics from the report. Just note GSC’s limitations—it may not show all queries/pages driving traffic.
-
Step 4:
Export data from SE Ranking’s AI Tracker, Rank Tracker, and GSC for the same date range and location (US). Then, merge the datasets using Google Sheets. Use VLOOKUP, or another matching formula, to combine rankings, traffic, and AI Overview presence.
-
Step 5:
If AI Overviews appear for your keywords, and your rankings remain stable but clicks have dropped, AIOs could be the cause. To get clearer insights, compare data across different time periods. For example, use year-over-year comparisons, such as this month versus the same month last year (before AIOs were introduced). If AI Overviews aren’t present but you’re still seeing fewer clicks despite steady rankings, other SERP features might be influencing traffic. Additional factors could also be at play, like a shift in search intent or competitors updating their pages with more compelling titles that attract more clicks than yours.
5 steps to evaluate the impact of AI Overviews on organic performance
Now let’s walk through the AI Overview analysis process. These five steps will help you track where AIOs appear, measure their impact on your organic traffic, and adjust your SEO strategy as needed.
Note: This approach isn’t a one-stop shop, but you can use it to guide your analysis and get insights. Feel free to adapt it based on your goals, data, and tools.
Step 1. Start tracking your regular SERP rankings with SE Ranking’s Rank Tracker
Start by creating a project in SE Ranking if you haven’t already. Add your website URL, select search engines, and choose a region. Choosing the US is key because you’ll be comparing your ranking data with AIO data from the US (the only region the tool currently supports). The next step is to pin down the keywords and competitors you want to track (you can always add this information later).
The video below explains this process further.
Feel free to watch our course to learn more about how to get started with SE Ranking.
You can also add additional keywords to an existing project.
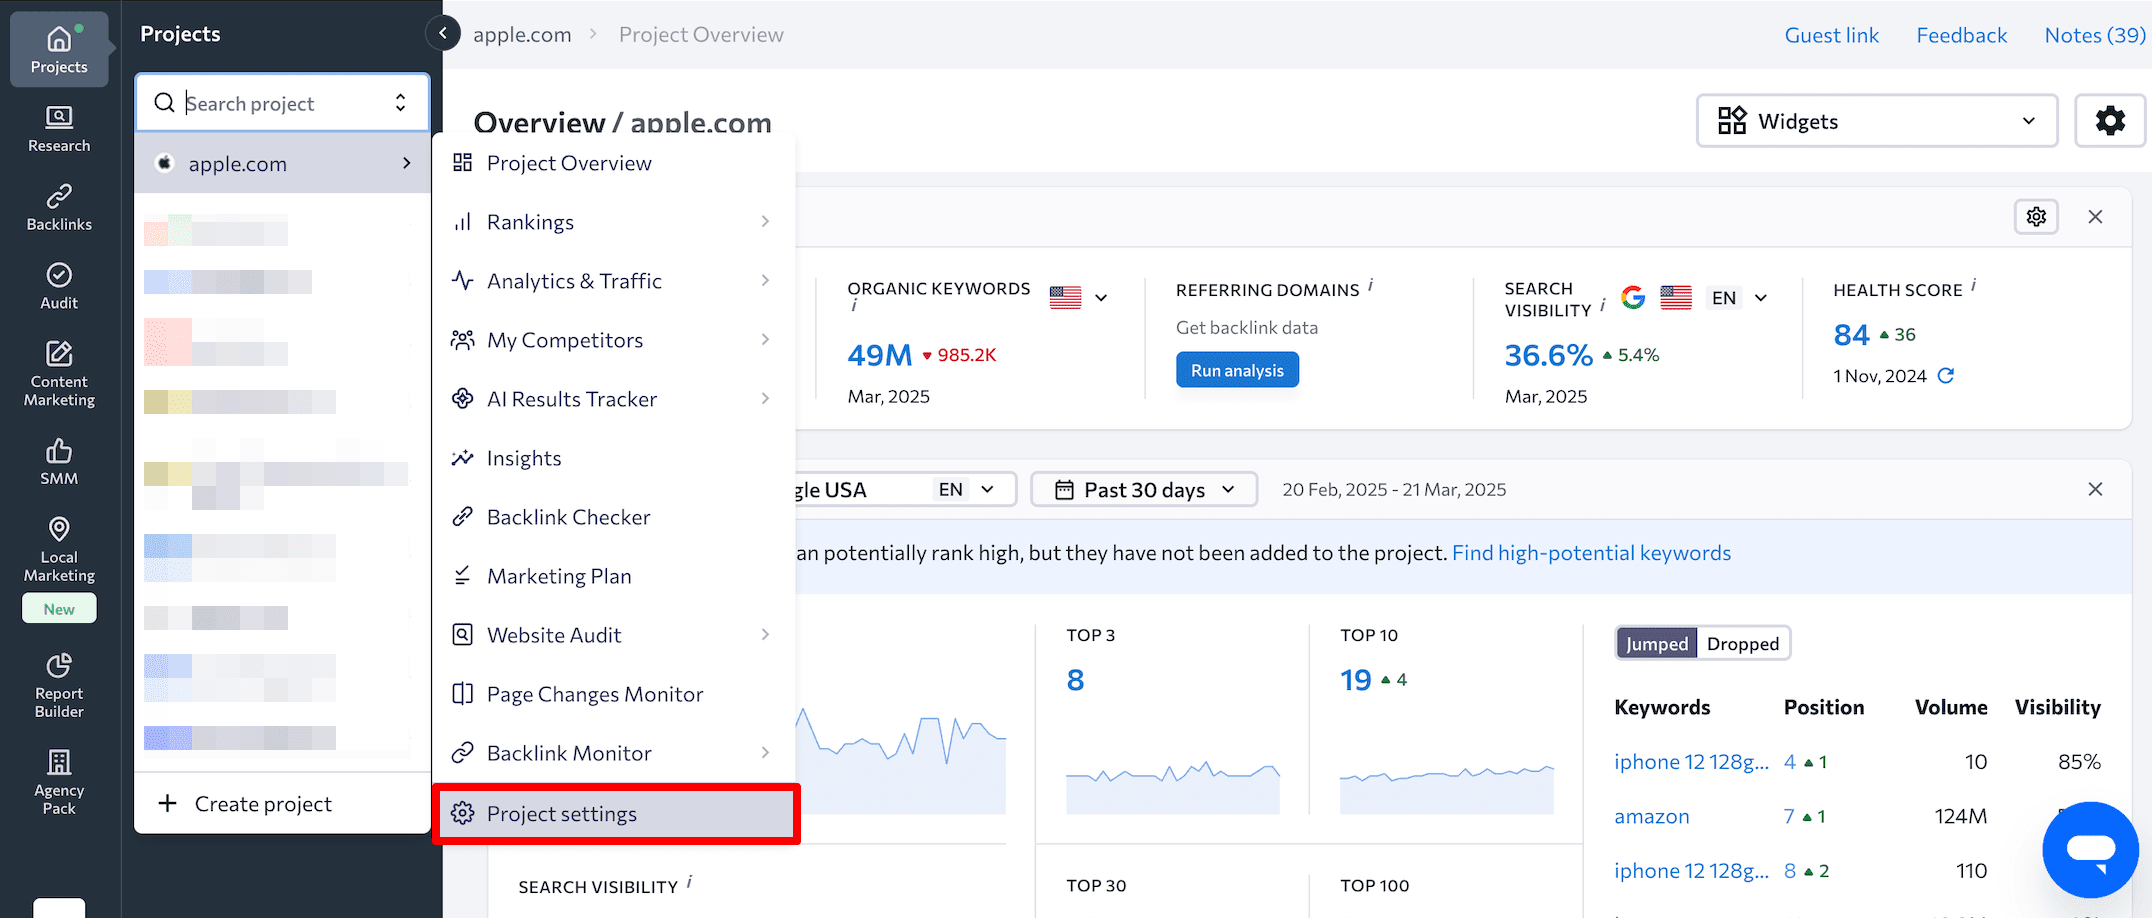
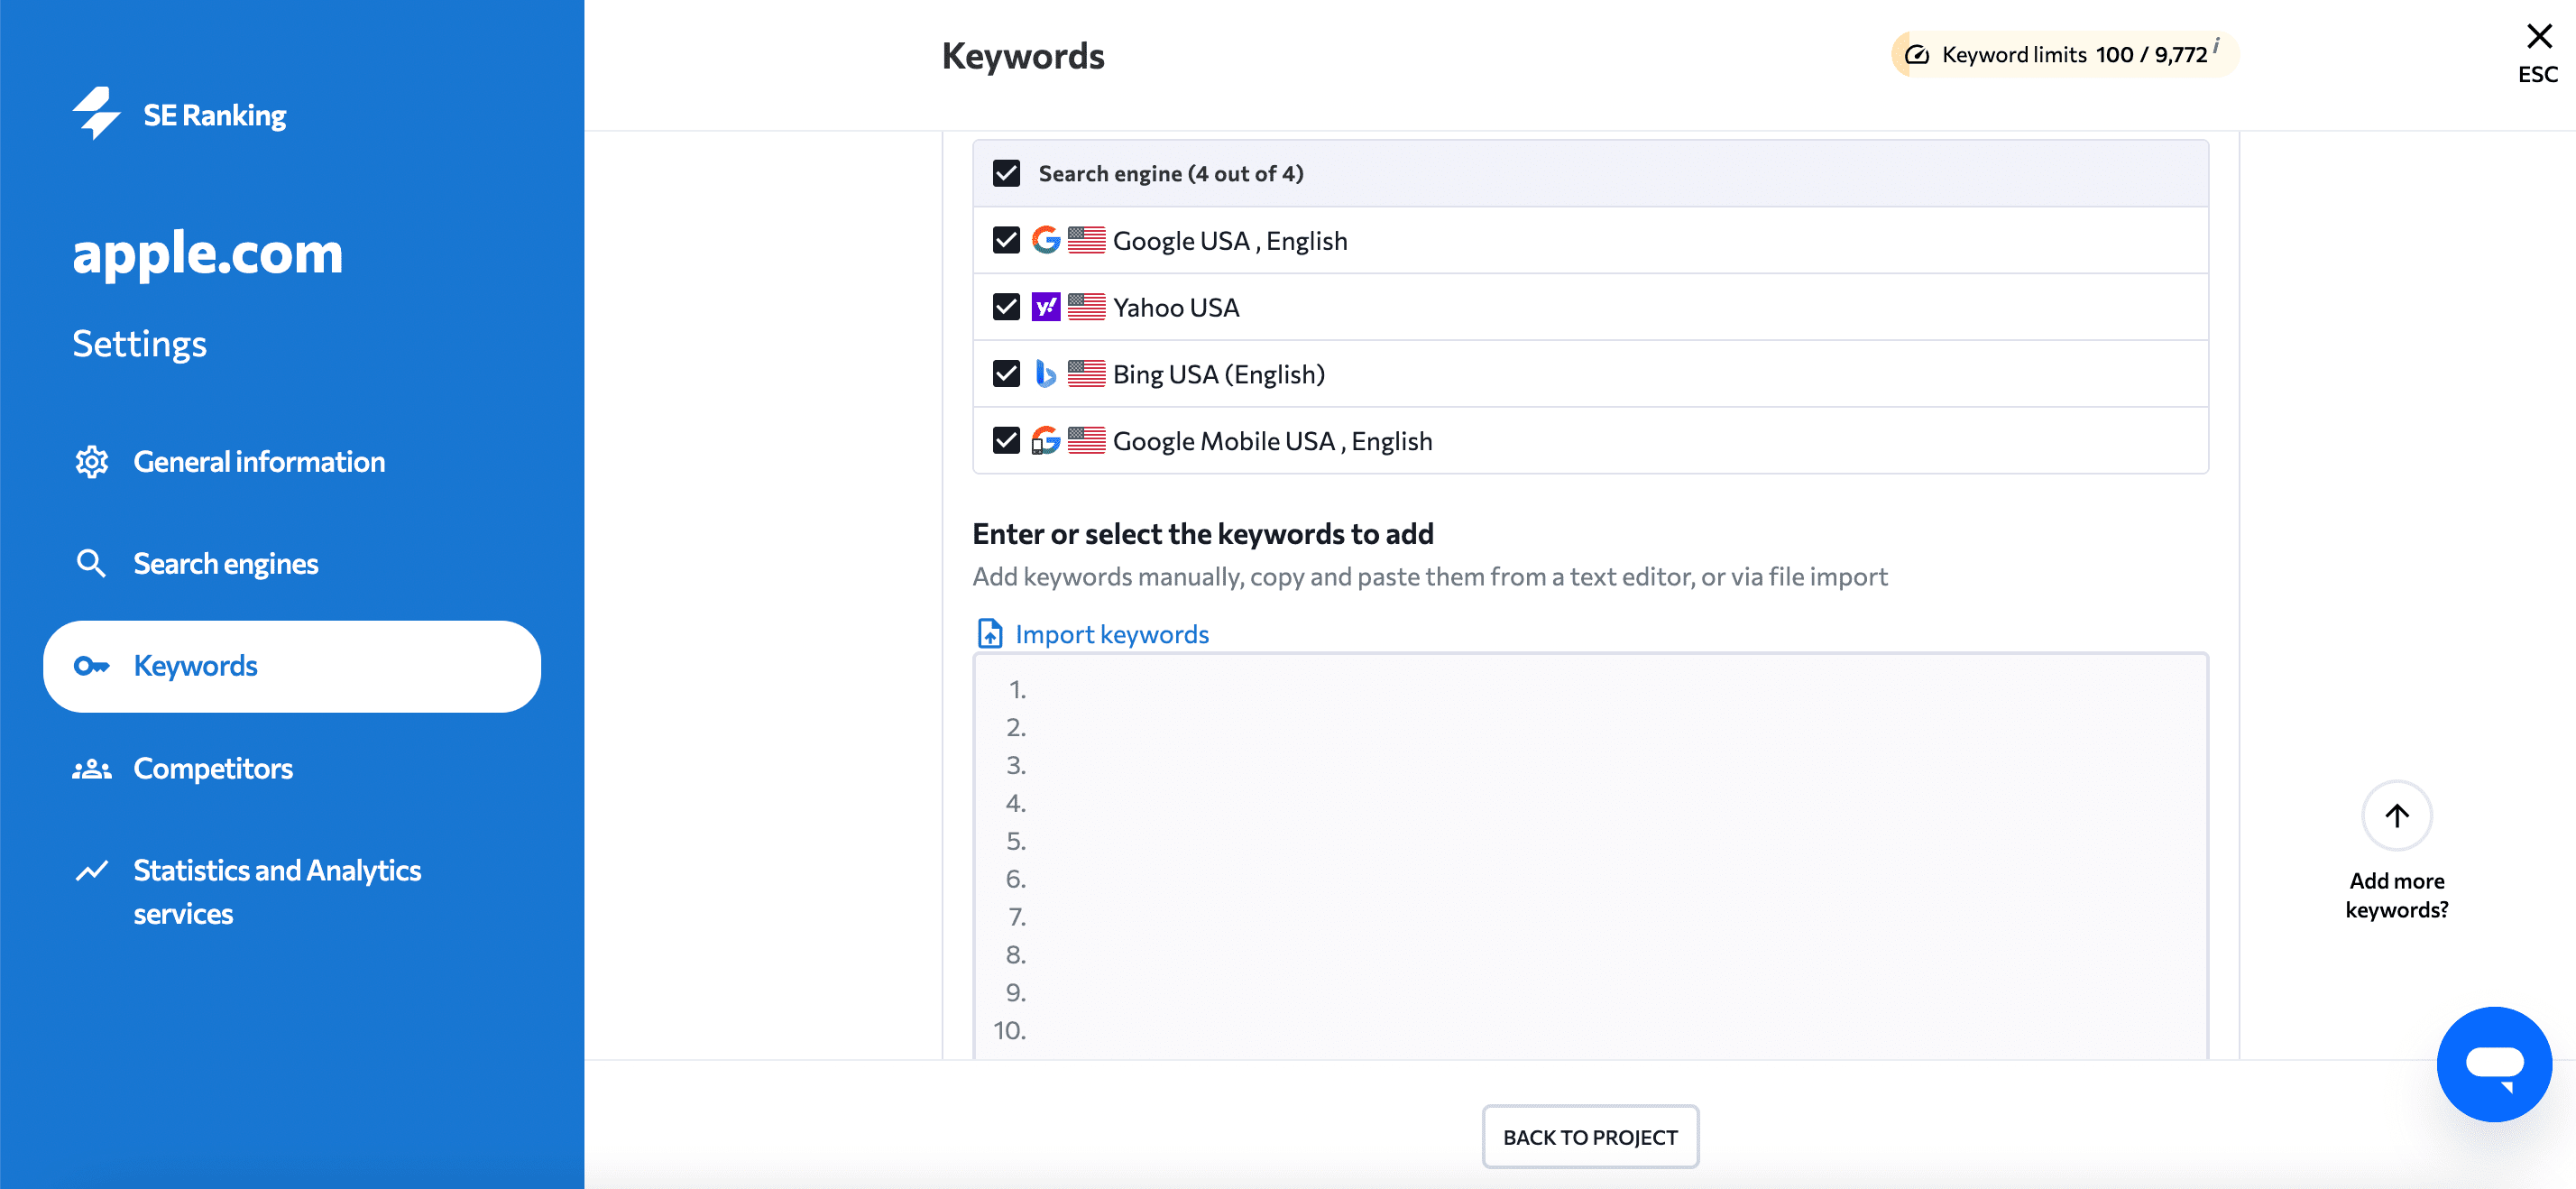
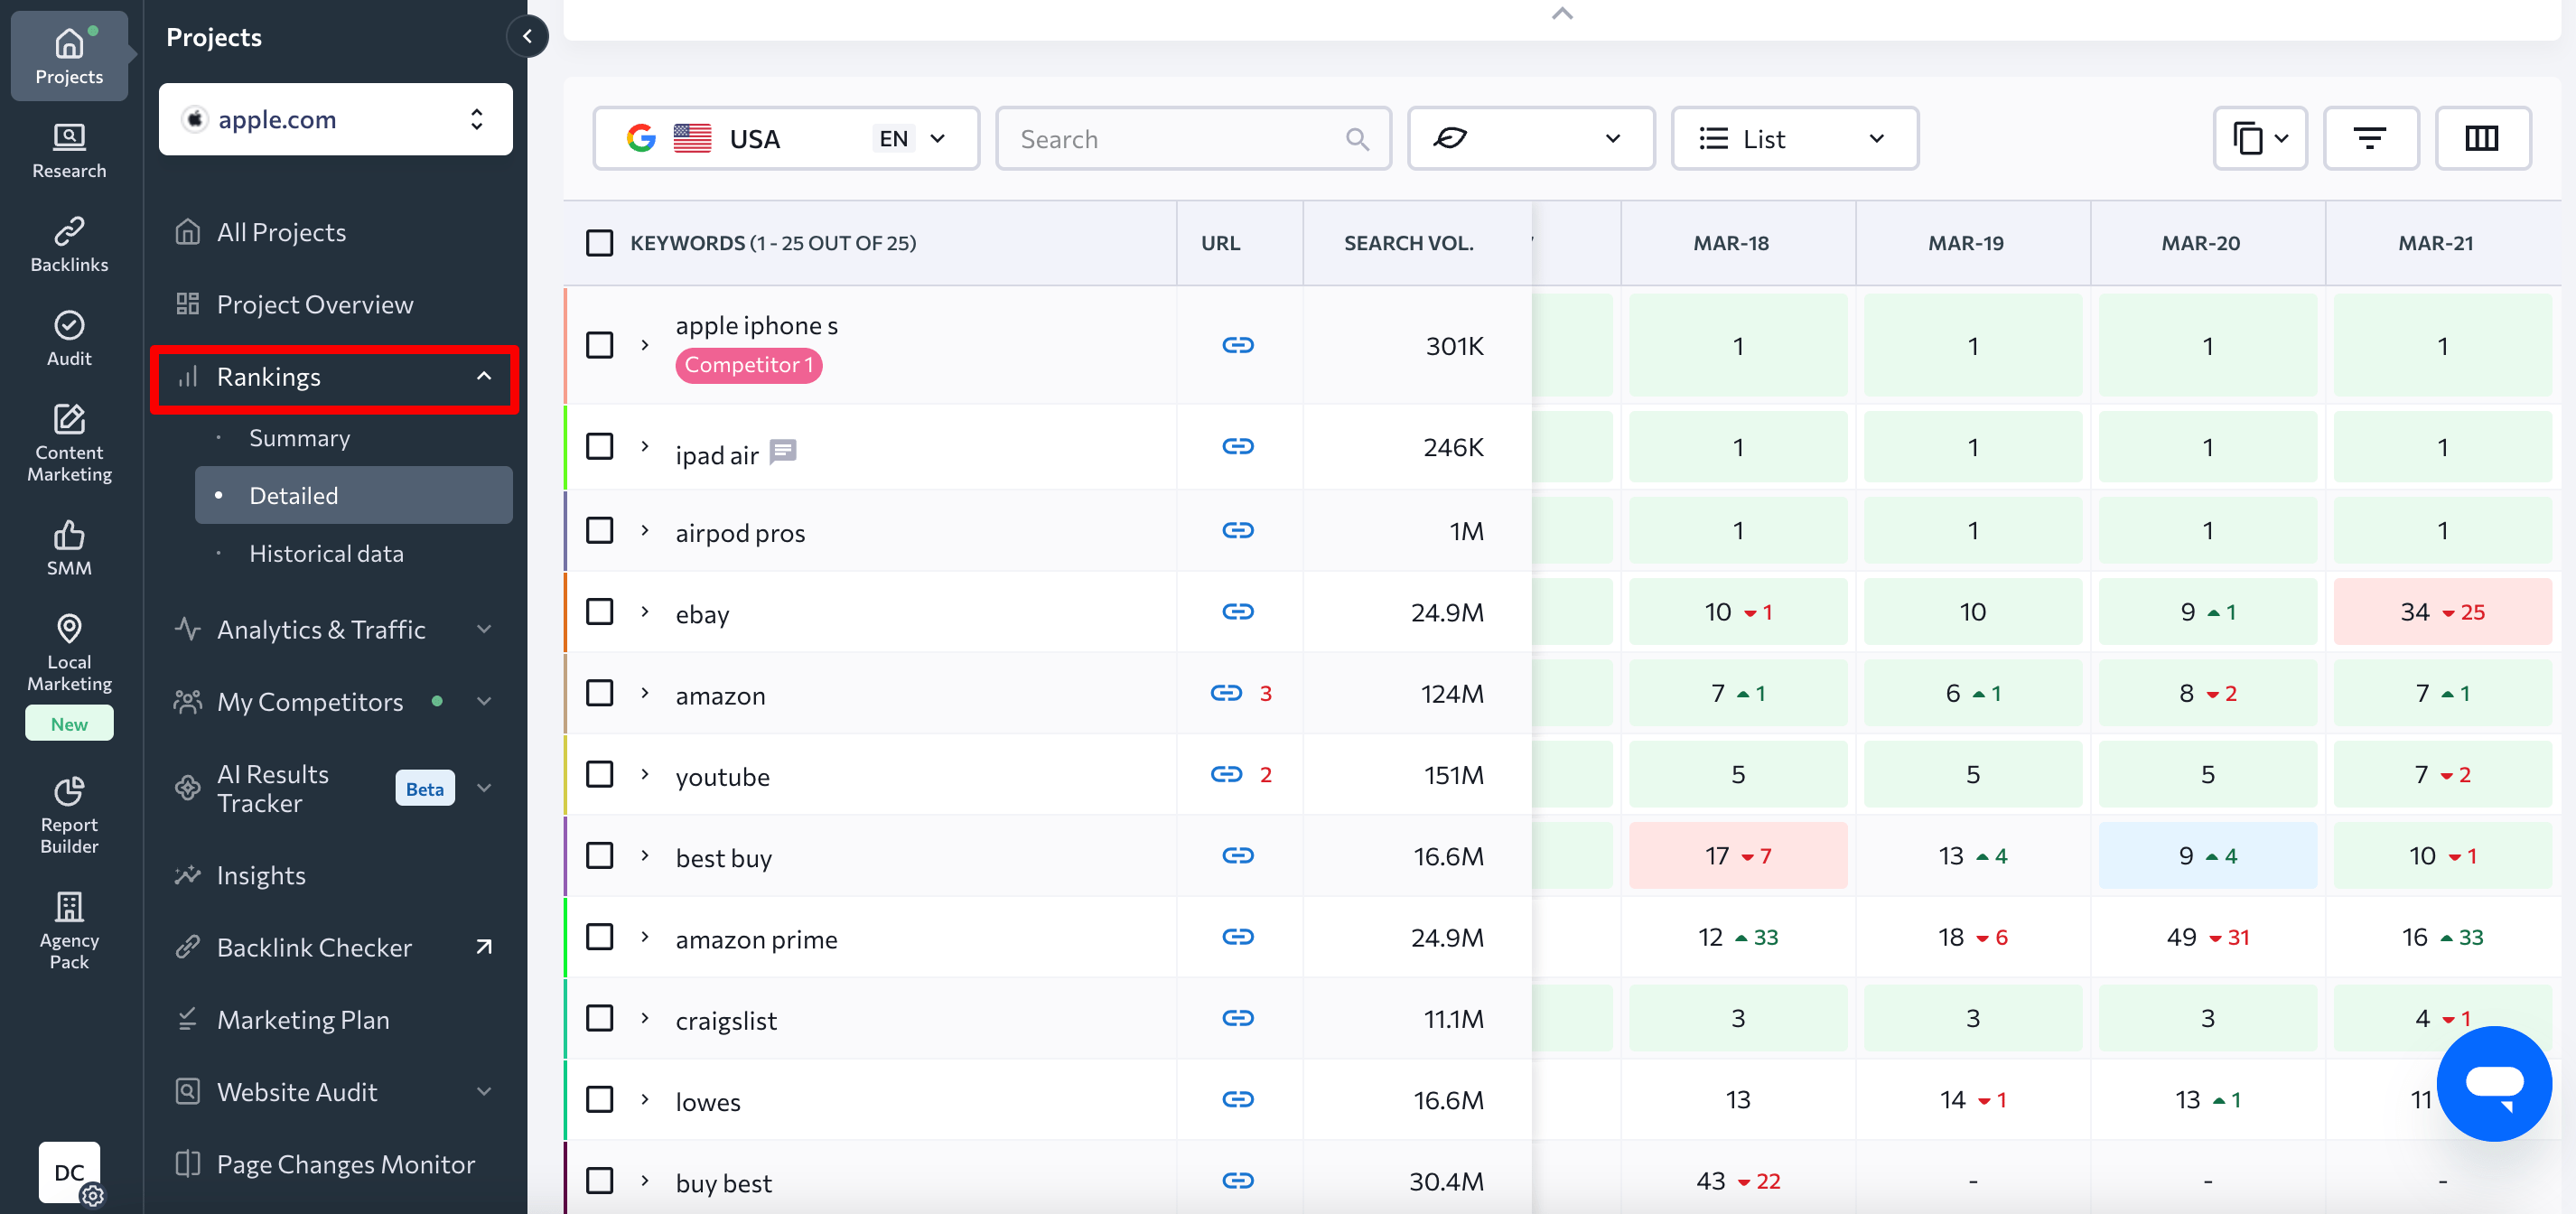
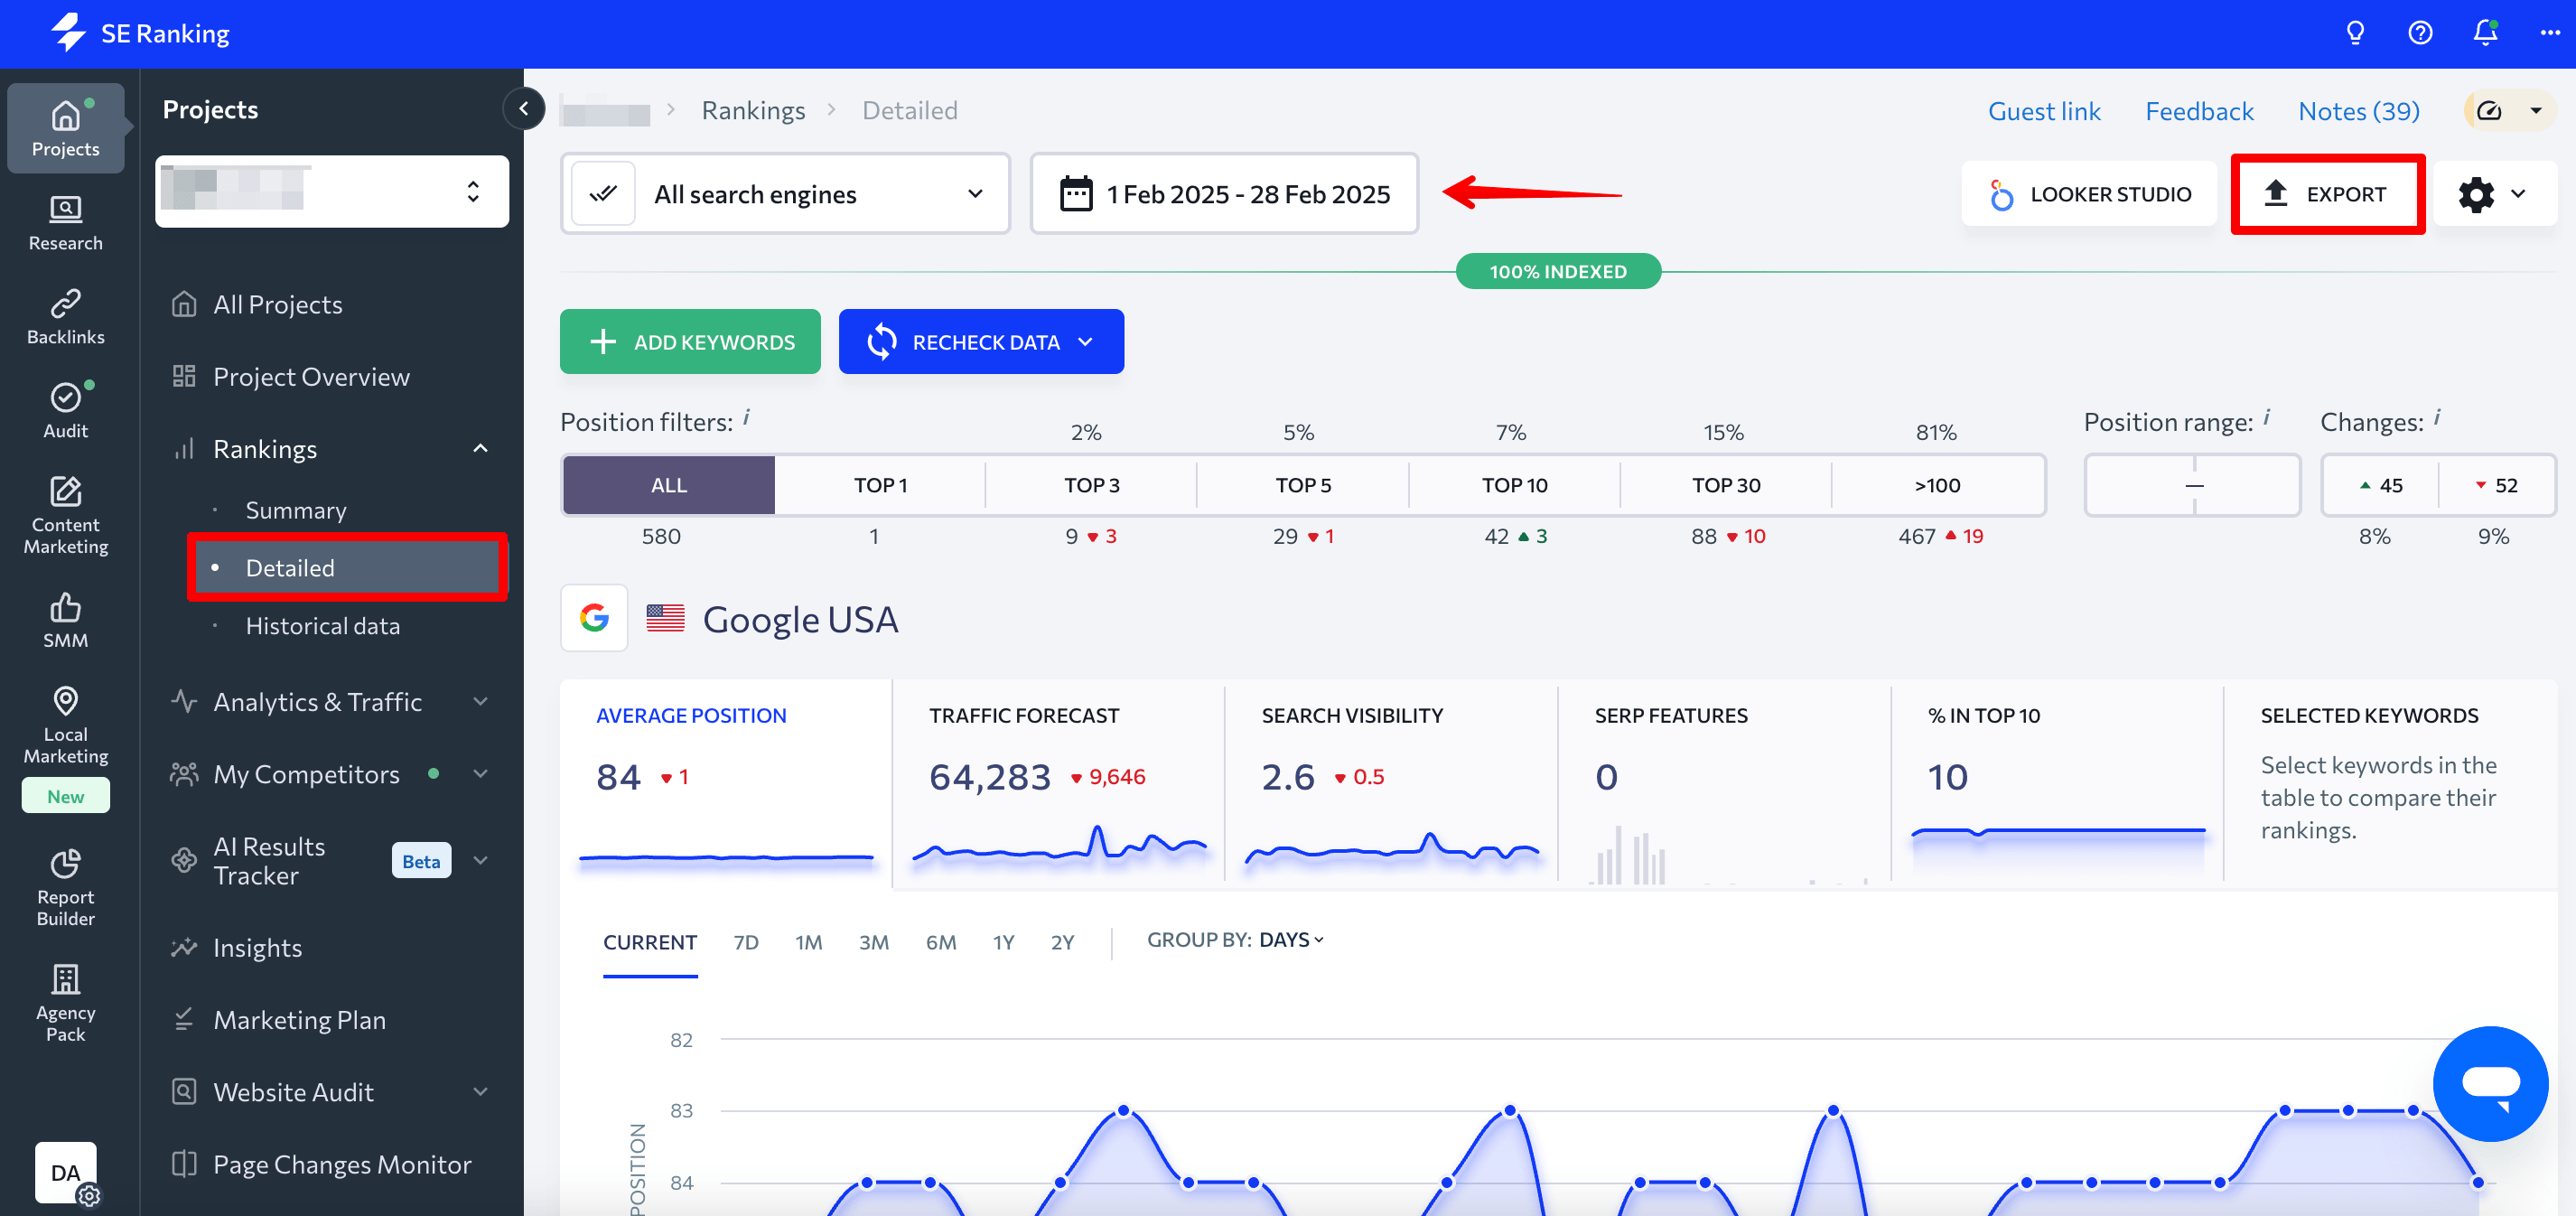
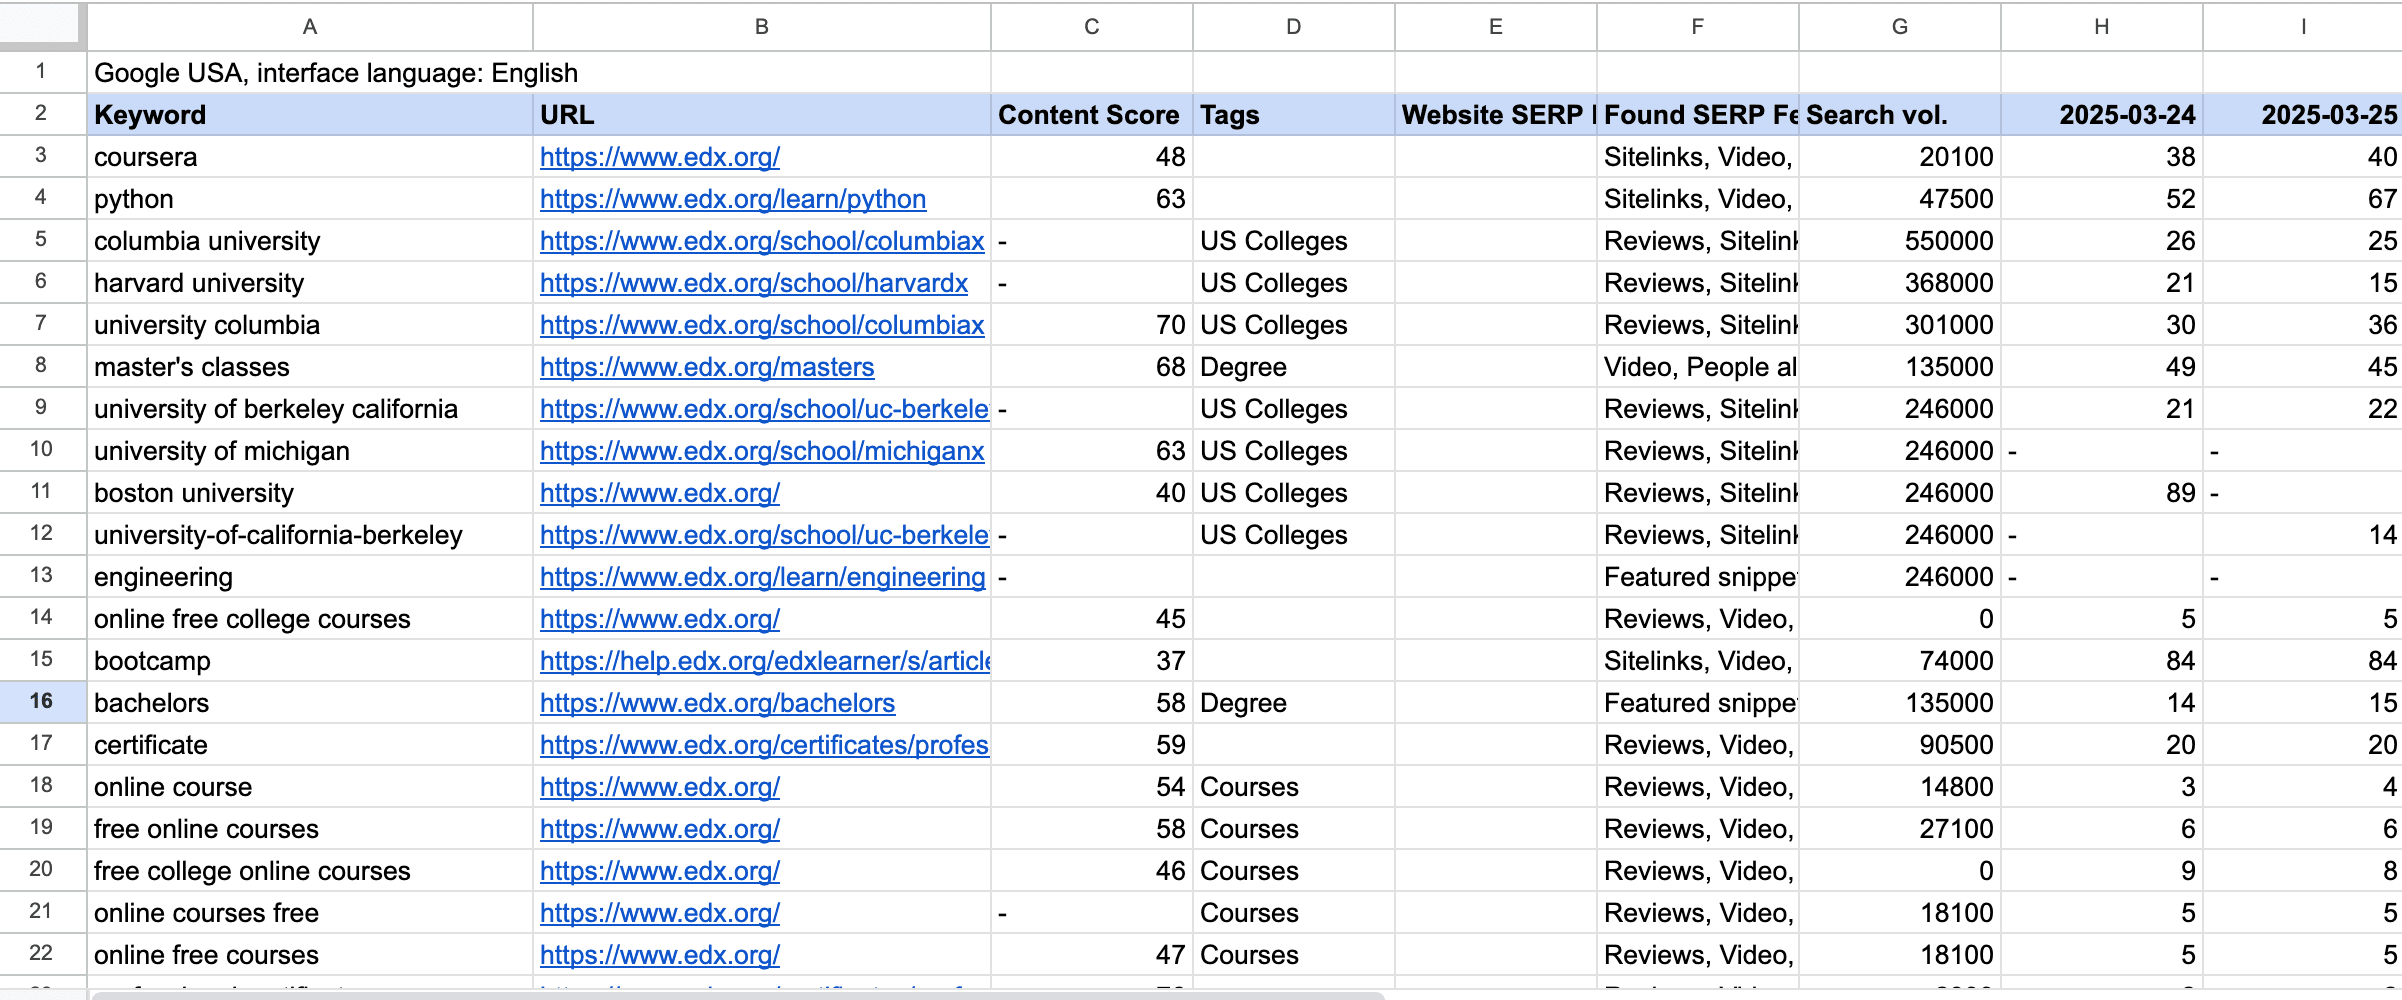
All keyword rankings, plus data on SERP features, search volume, and the content score, will be displayed in the Detailed tab under the Rankings section. For more meaningful insights, give it at least a month to gather enough data for reliable analysis.
Step 2. Add your target keywords to SE Ranking’s AI Results Tracker
Once you’ve created a project and added keywords to Rank Tracker, go to the AI Results Tracker tool, then select from the project the keywords you want to track AI Overviews for.
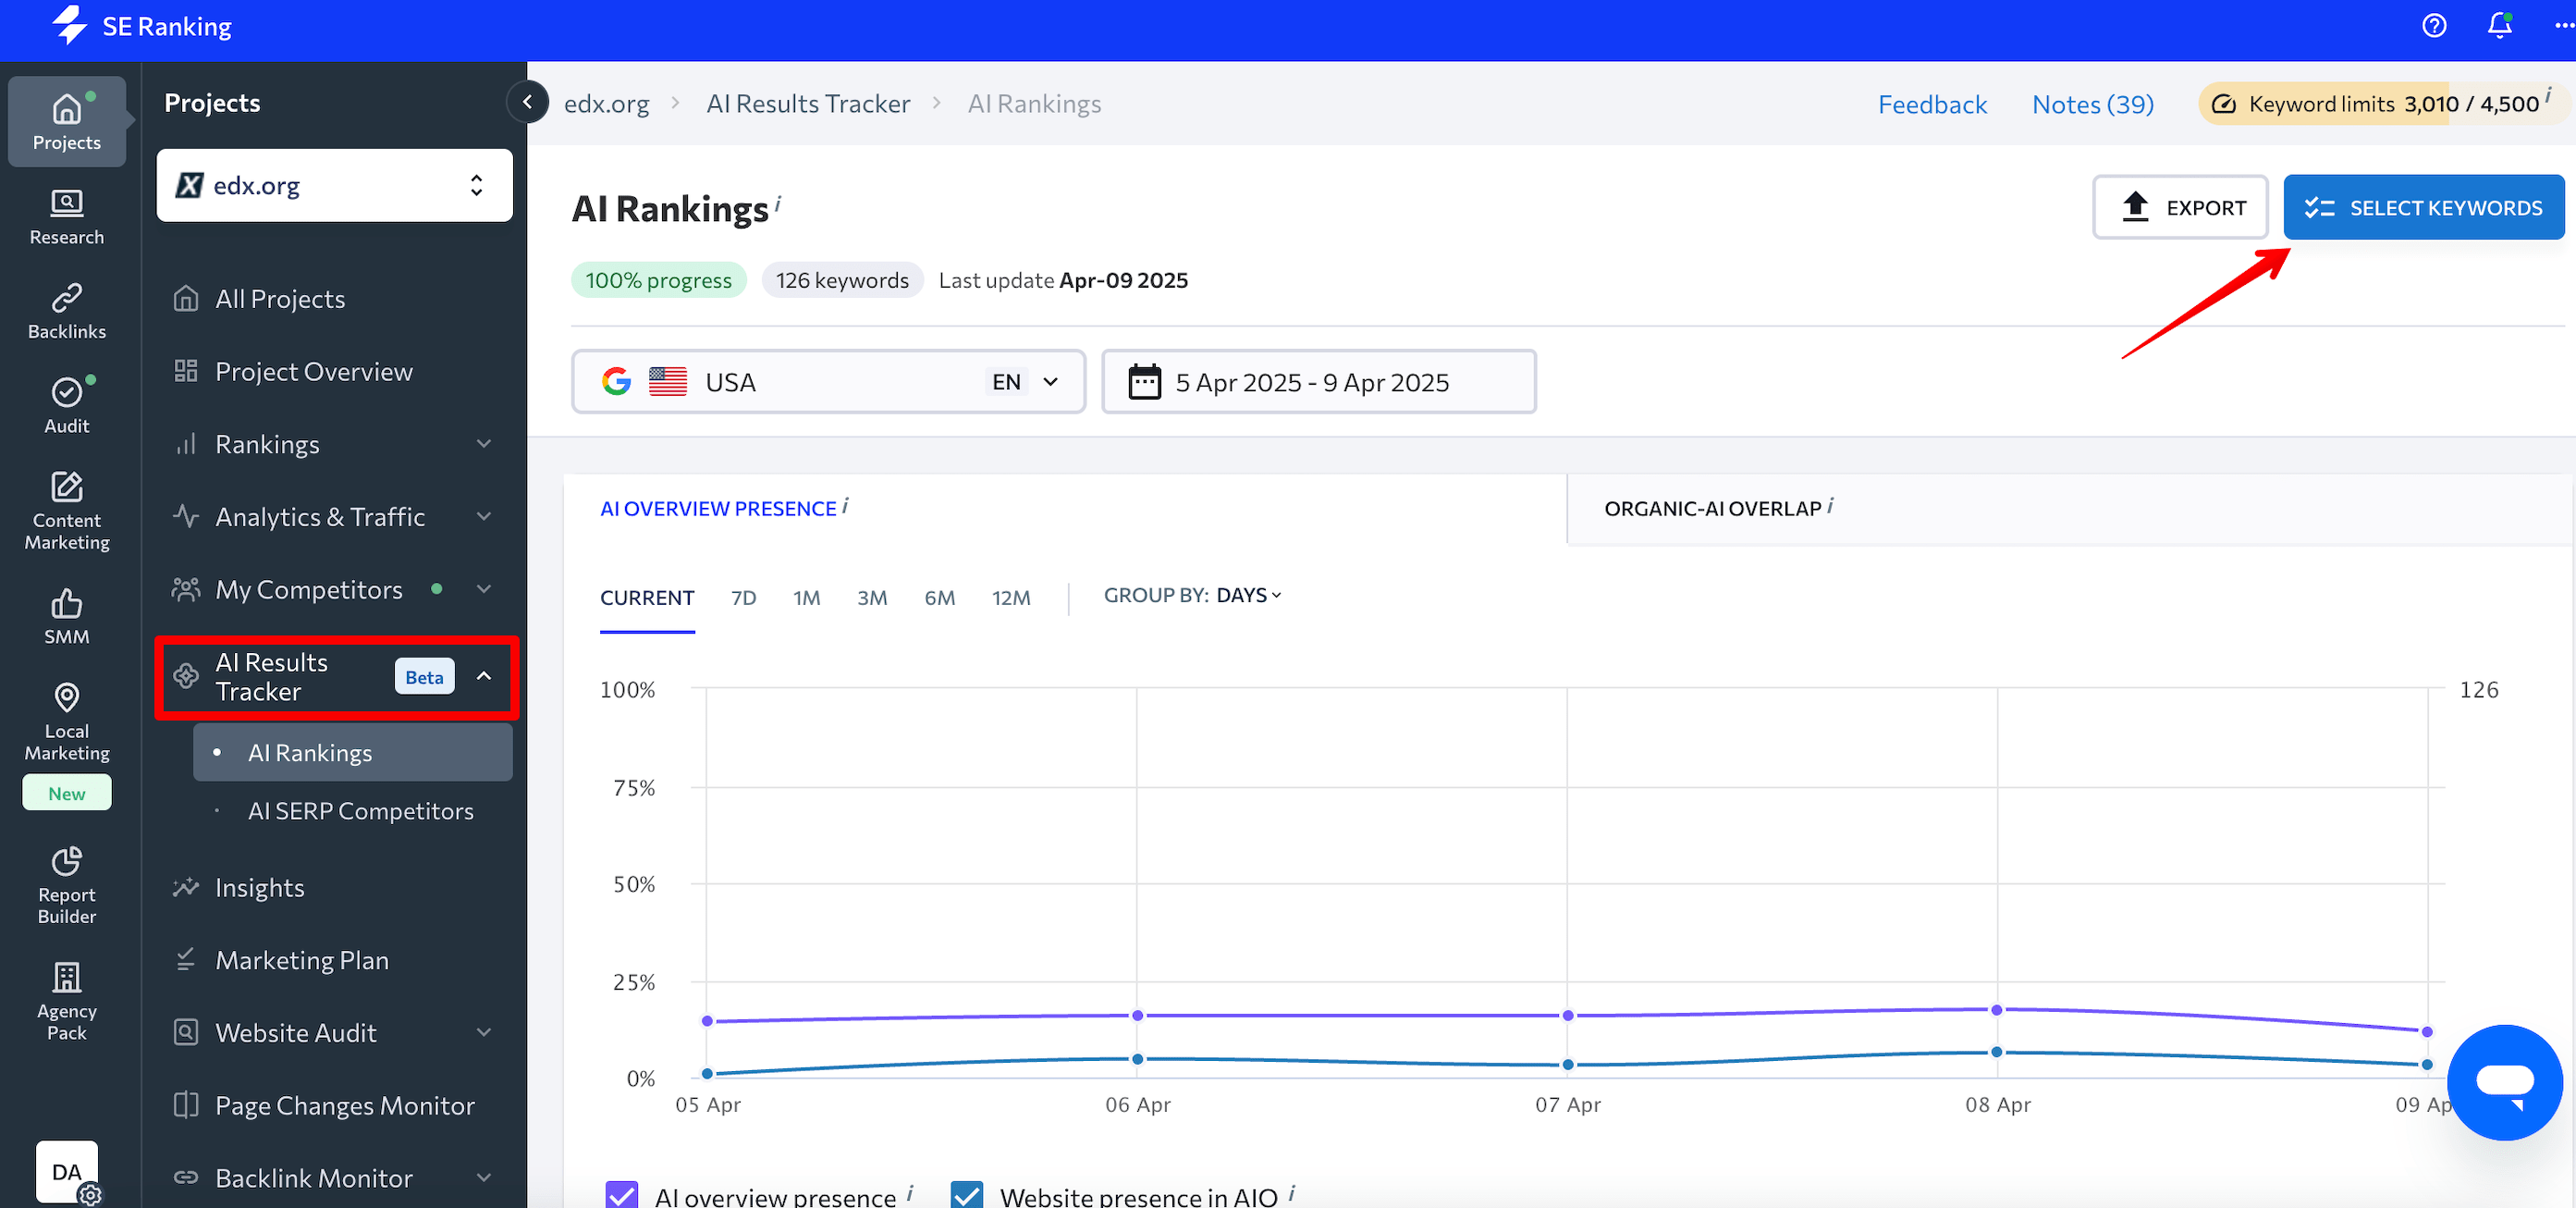
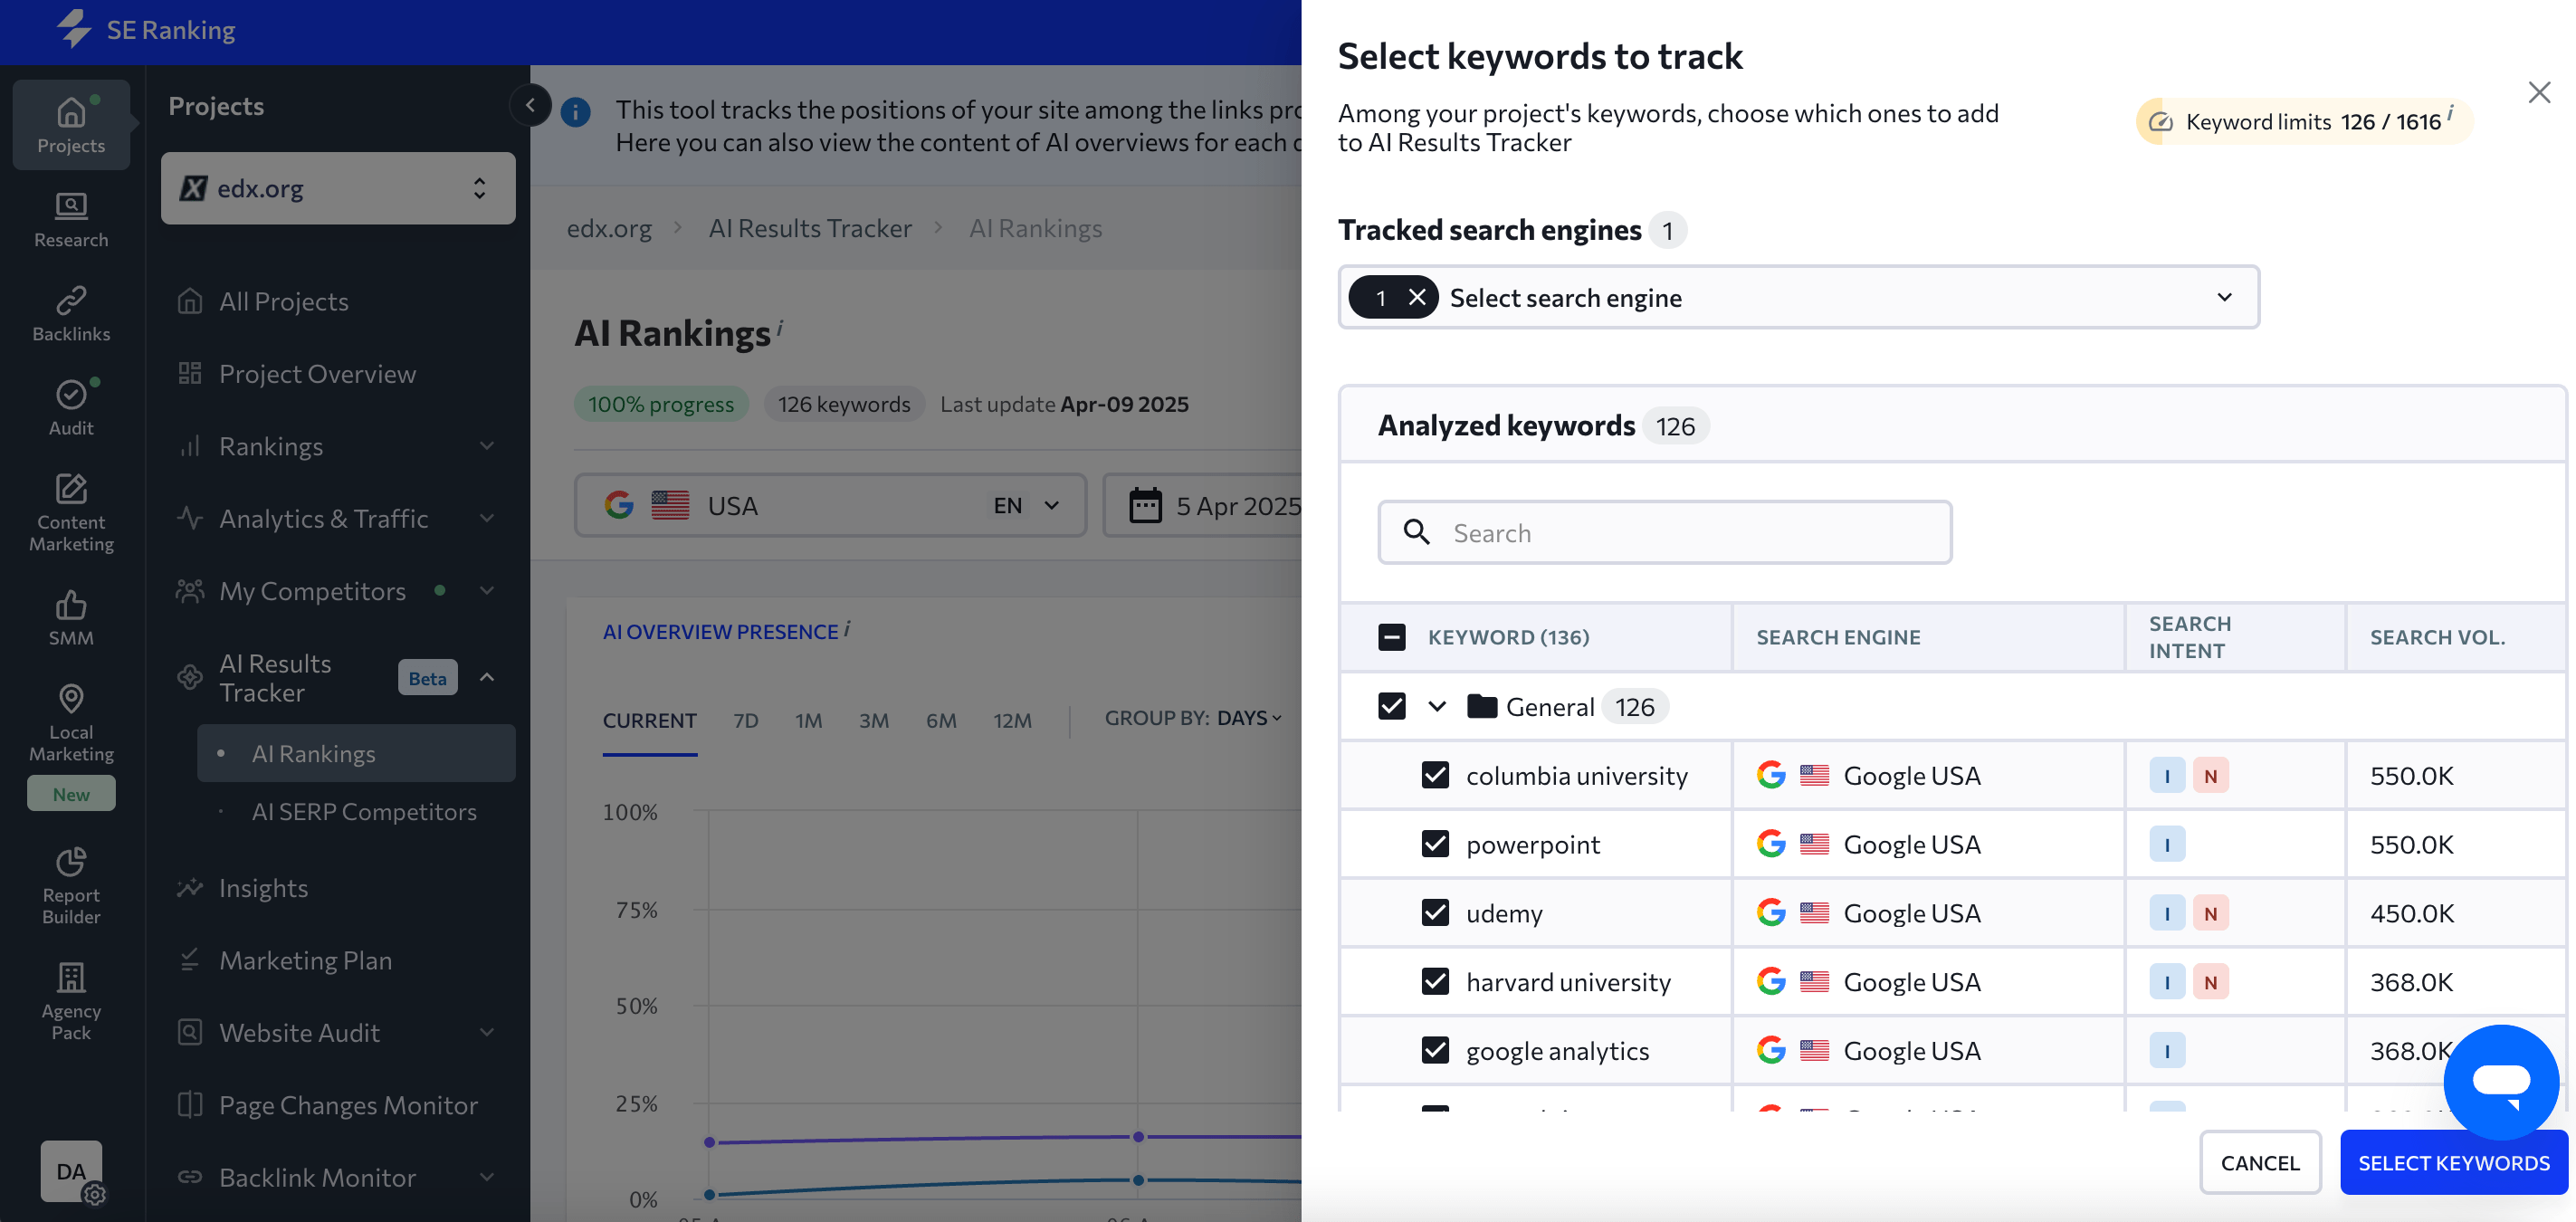
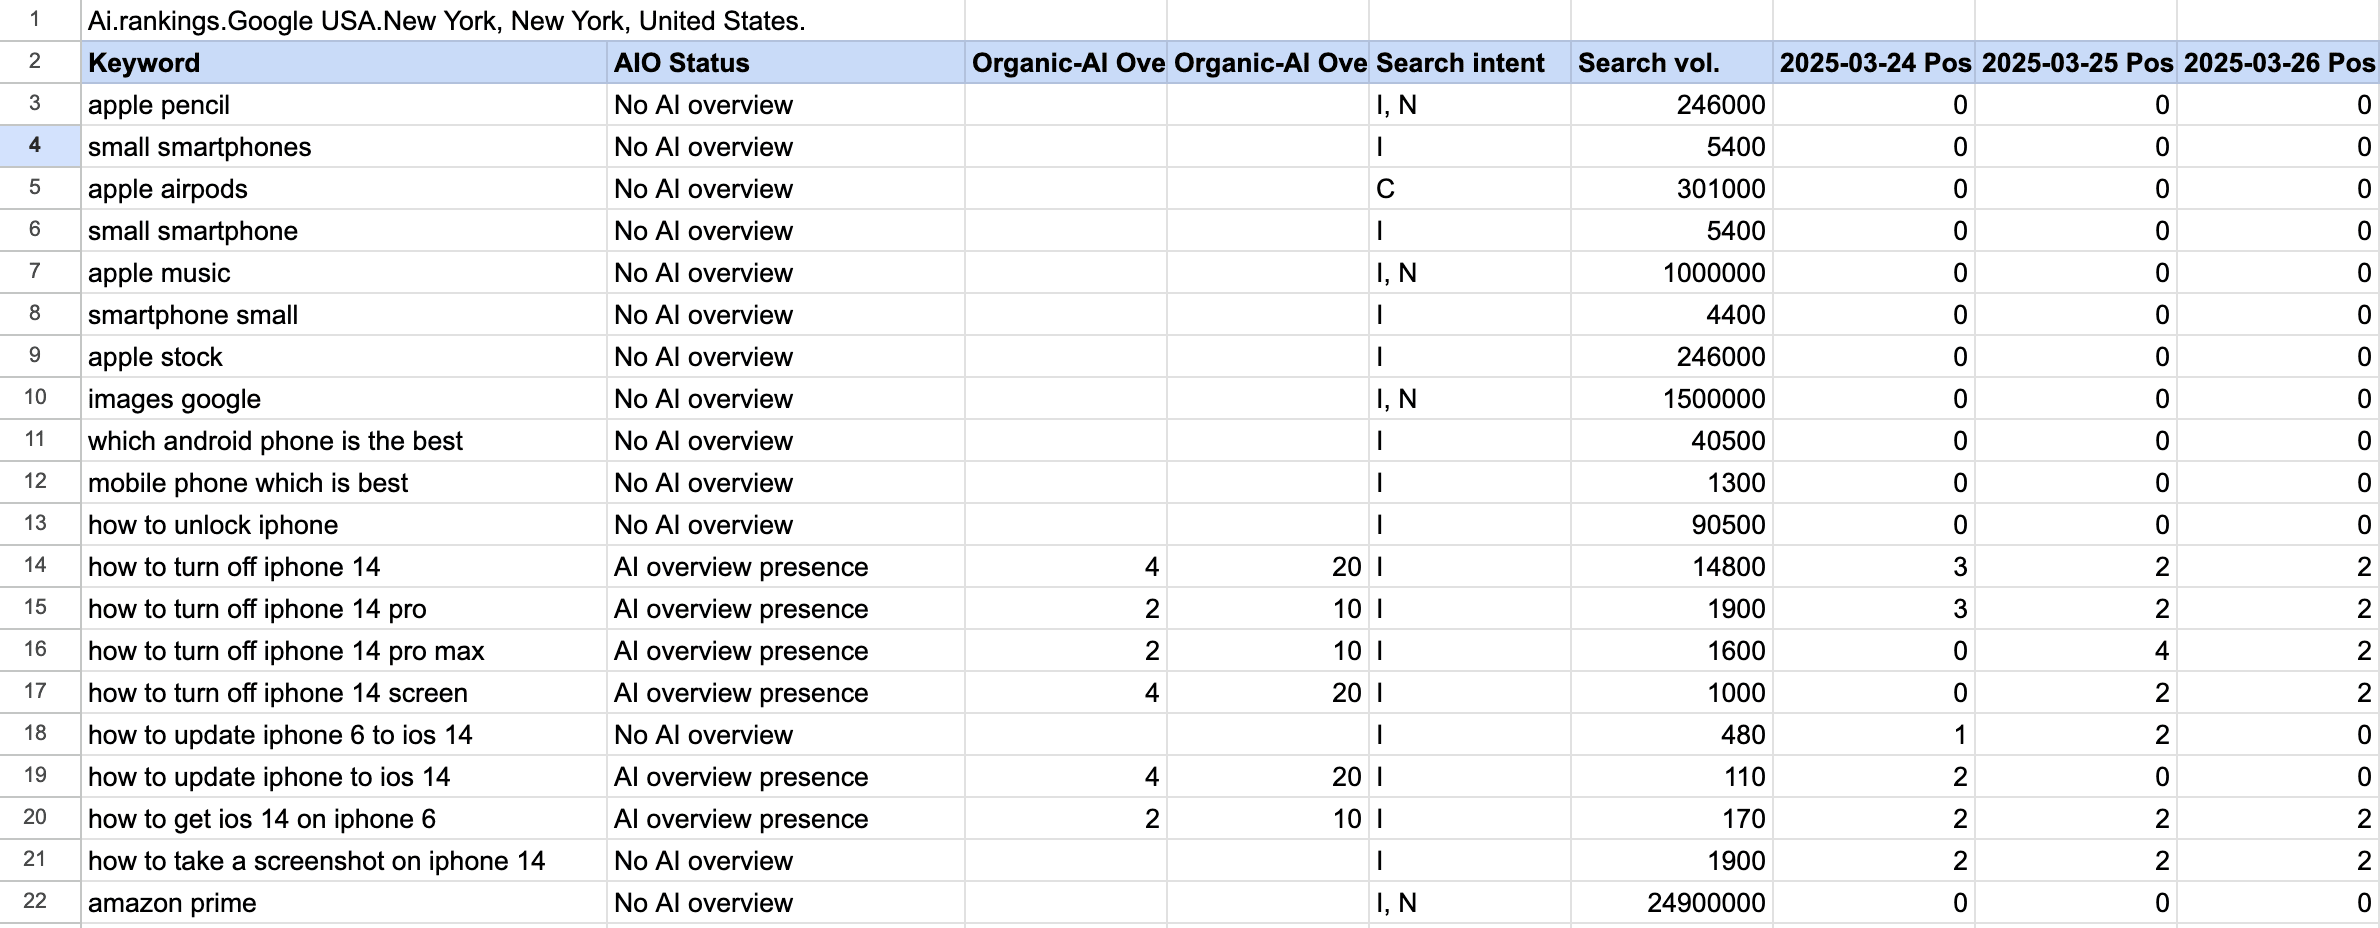
The tool tracks AIO status, your site’s daily ranking, and even shows additional data like search intent, search volume, and other essential metrics.
Tip: First, focus on keywords with informational search intent and higher search volume. AIOs appear more frequently for informational queries, and higher search volumes bring in more clicks (especially if you’re ranking well). Both give you better insights. Try to balance these two factors as you look at your data.
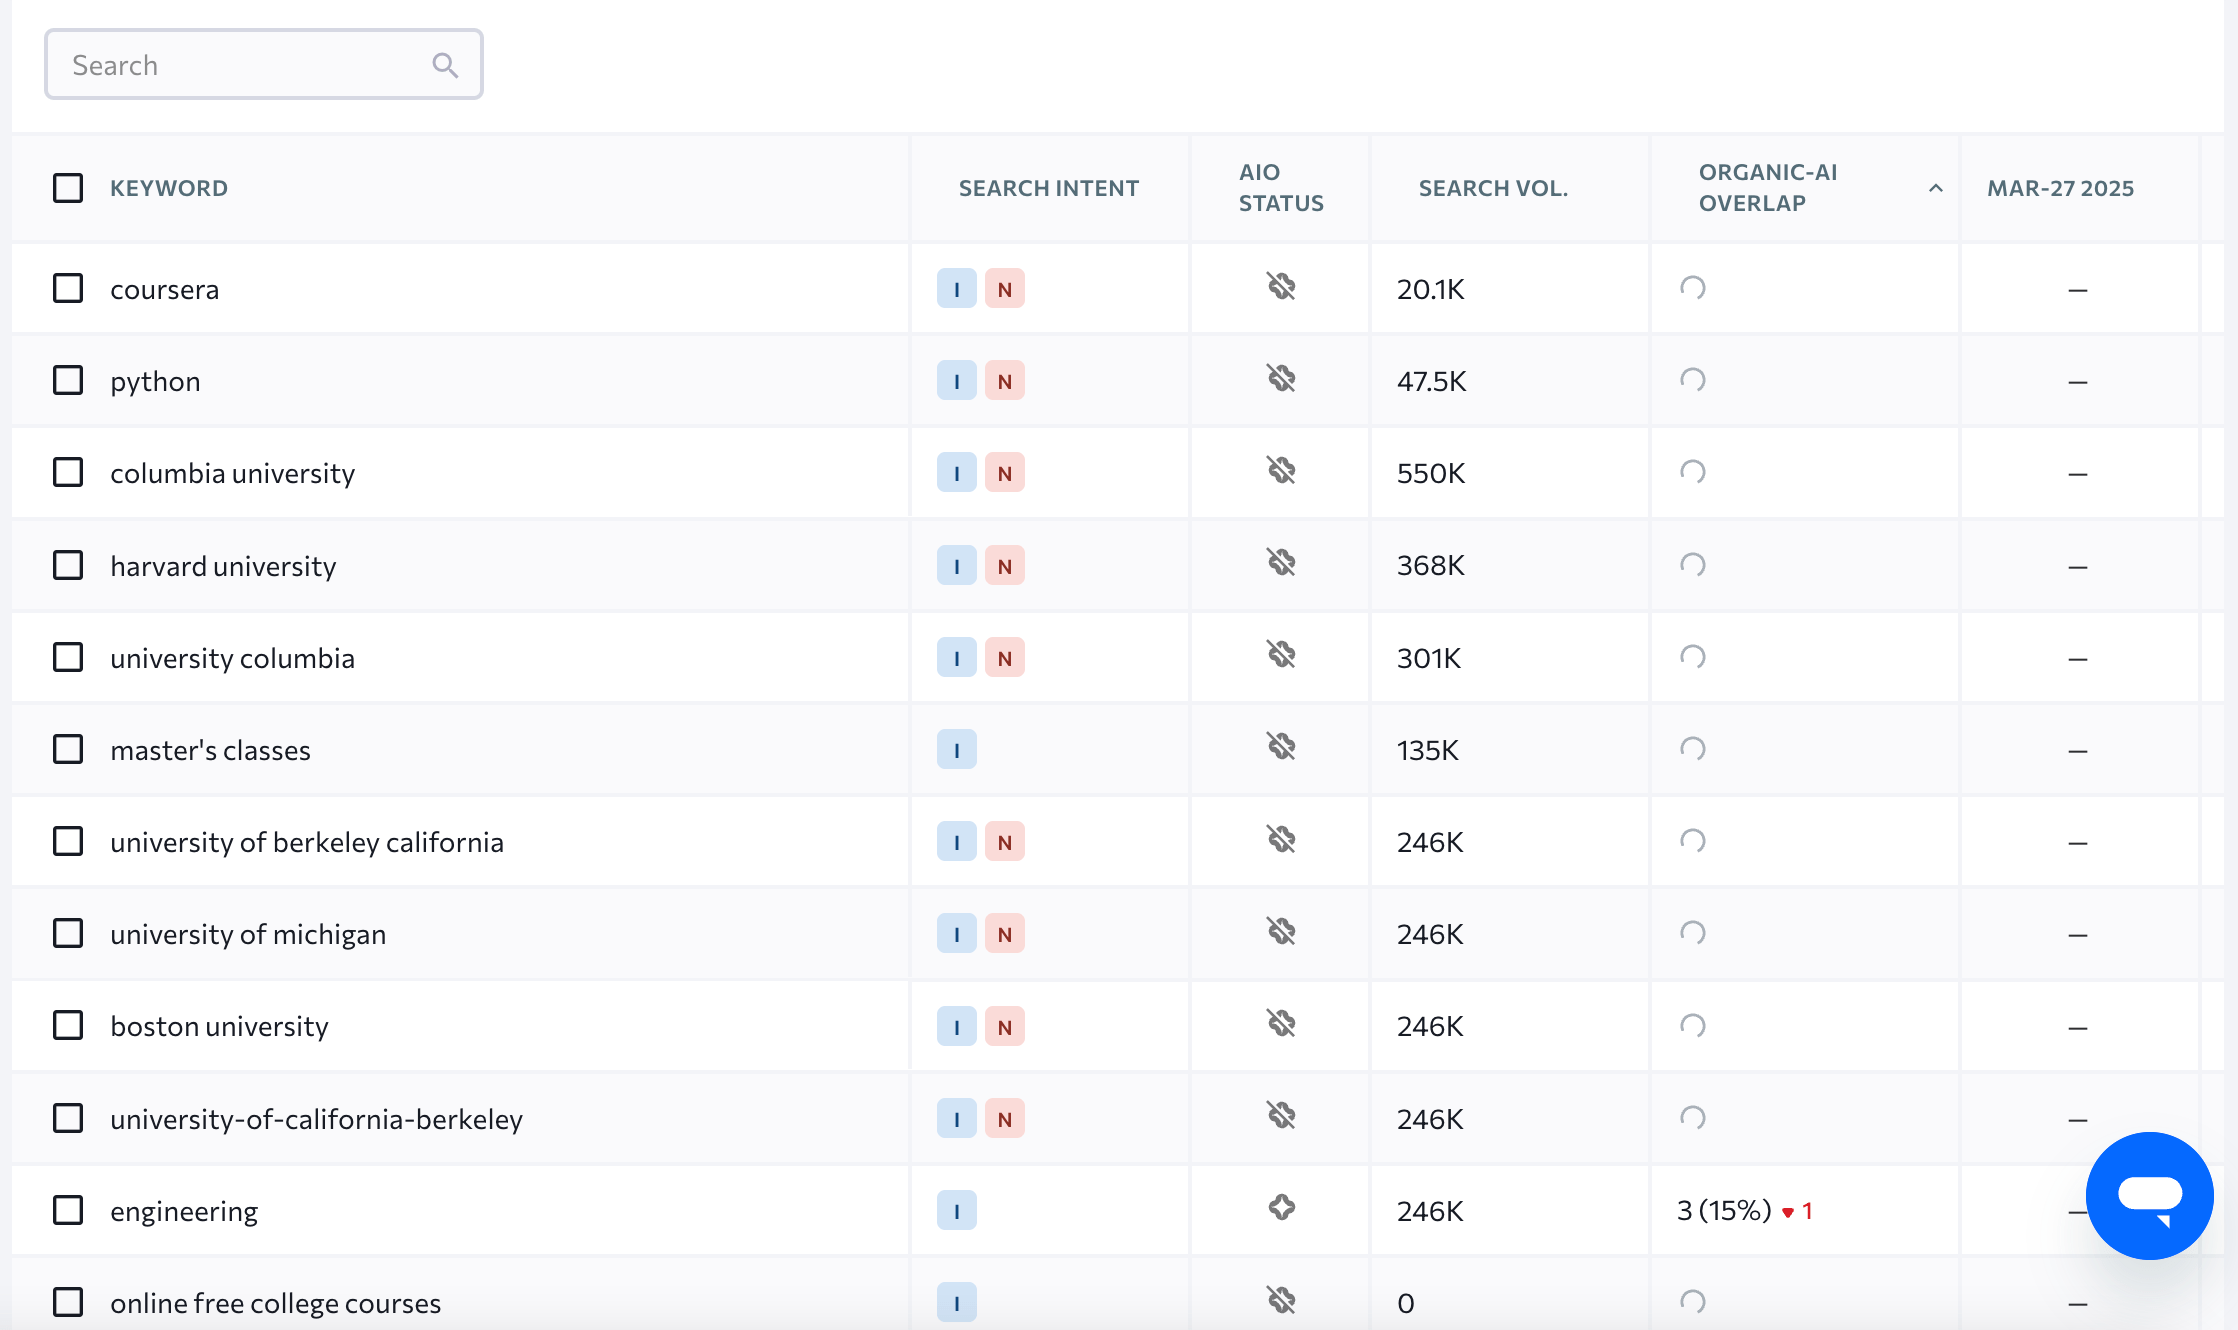
Note: Due to the dynamic nature of AI Overviews, it’s best to allow at least a month of data collection to ensure you have enough for meaningful analysis. This will give you a 30-day overview of your rankings, allowing for a more accurate AI Overview analysis.
Step 3. Use Google Search Console to check actual traffic
Here’s where Google Search Console becomes your best friend. Check out this guide to setting up GSC to learn how to connect your site if you haven’t already.
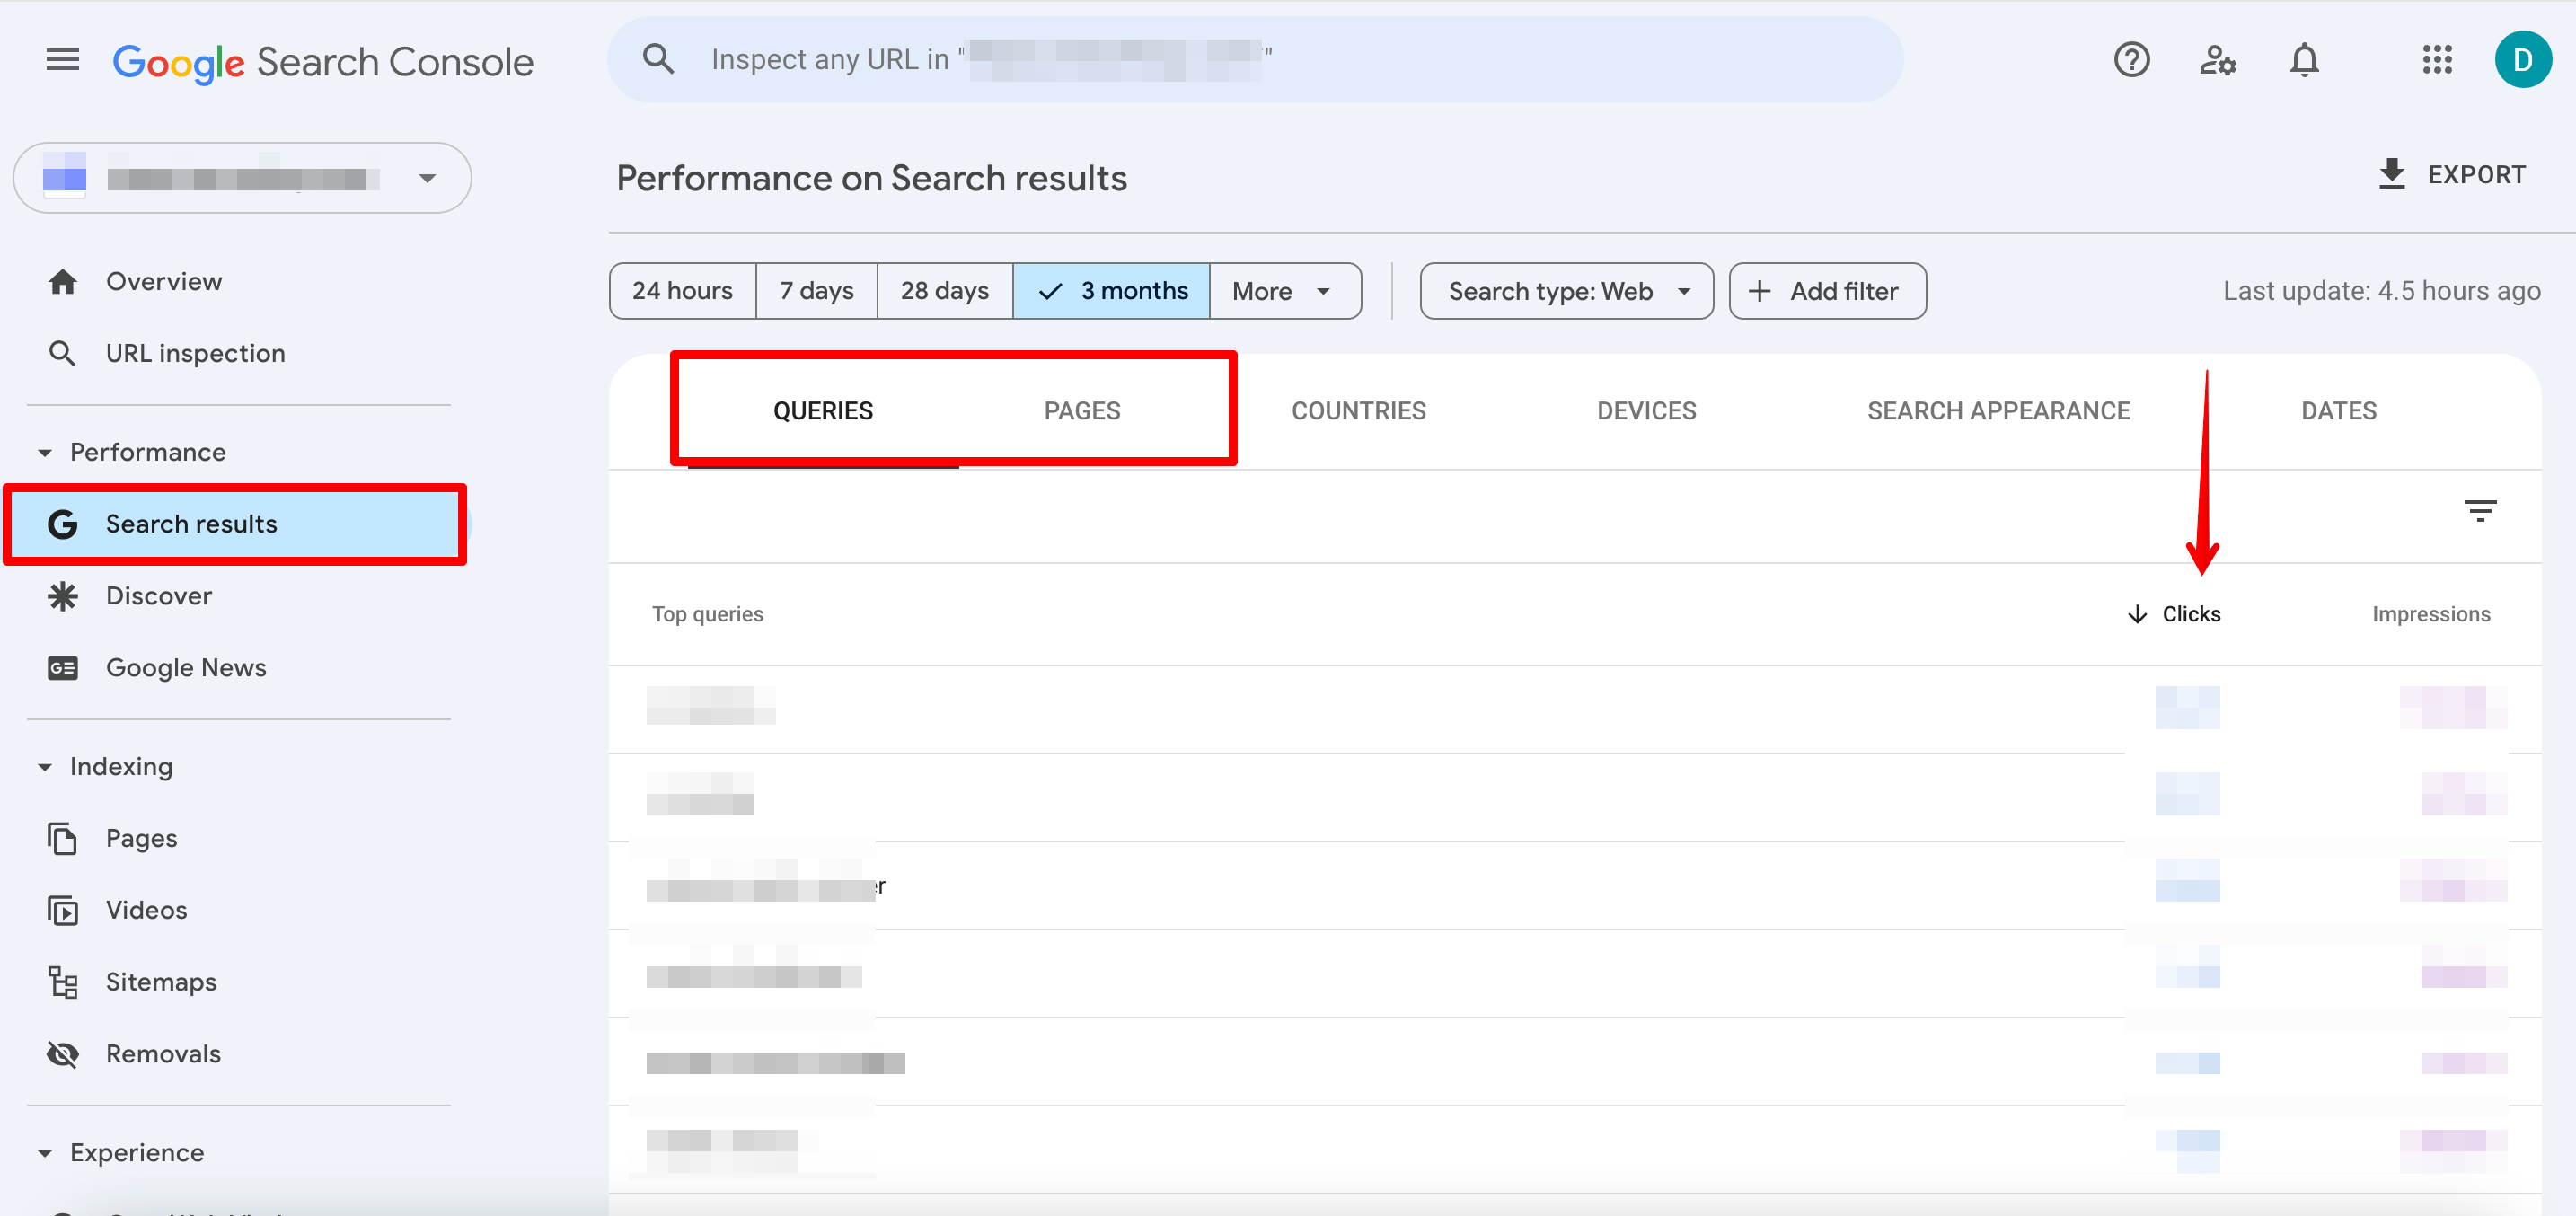
If your site is already being tracked in GSC, go to the Search results section to view clicks by query and page. Breaking it down by URL is usually more accurate and captures a higher volume of click data.
This data is essentially your website traffic, but it’s limited. We’ll describe why later.
Step 4. Export data from all your tools
- Export AIO data from SE Ranking’s AI Tracker. Select a one-month period, then click the export button and choose the CSV option.
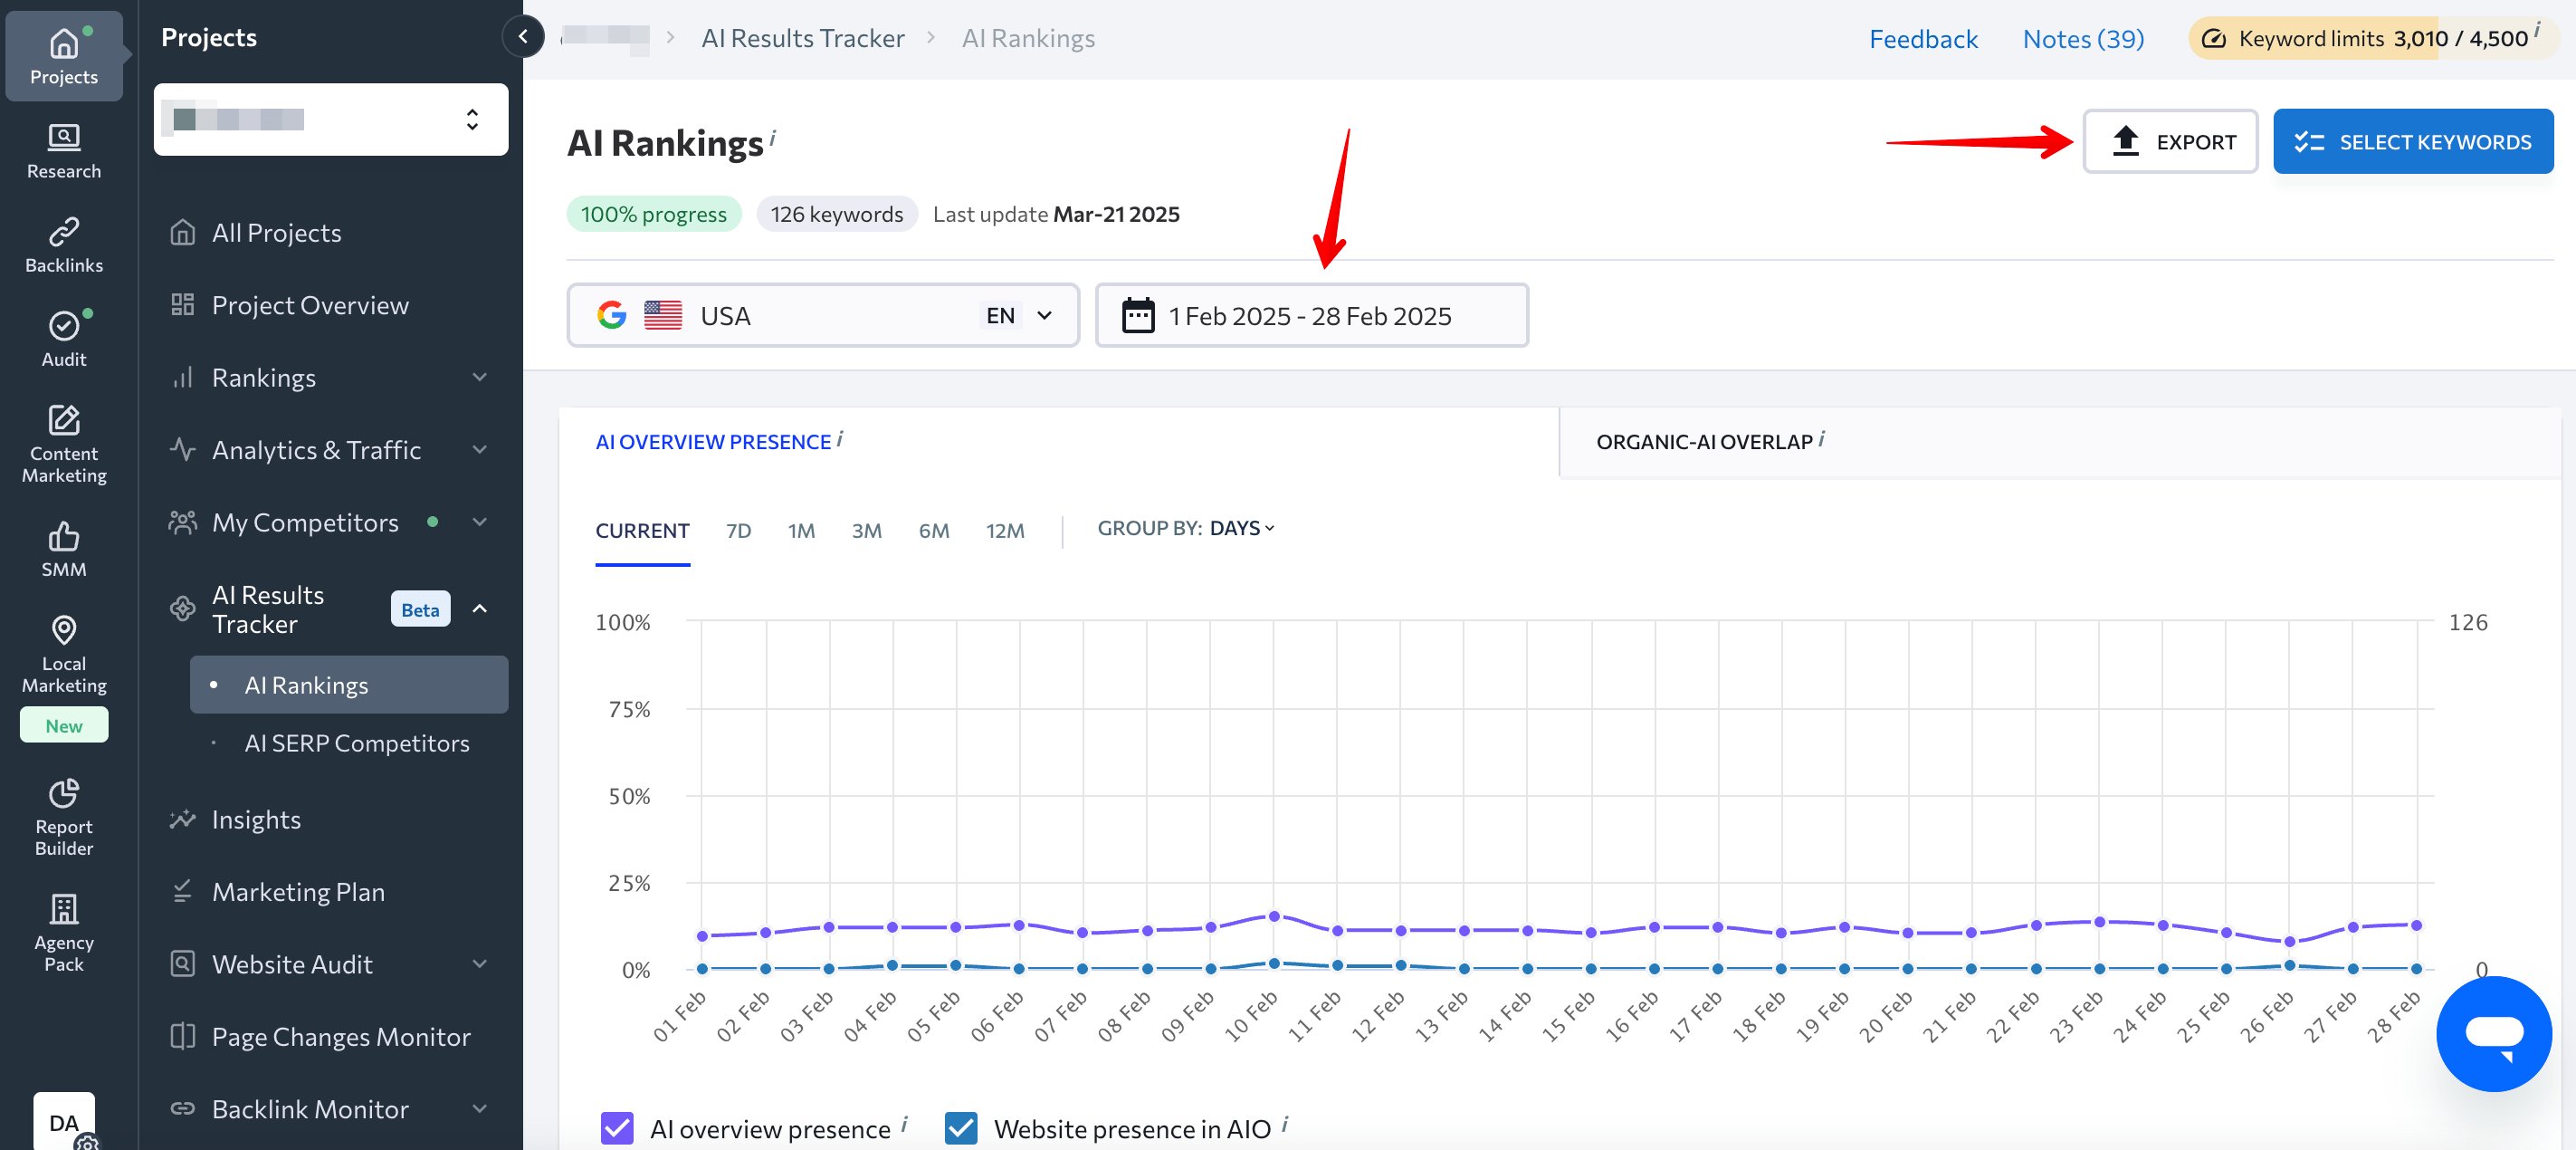
The exported file will look something like this:
- Similarly, export the month’s ranking data from the Rank Tracker’s Detailed tab.
Here is the exported file:
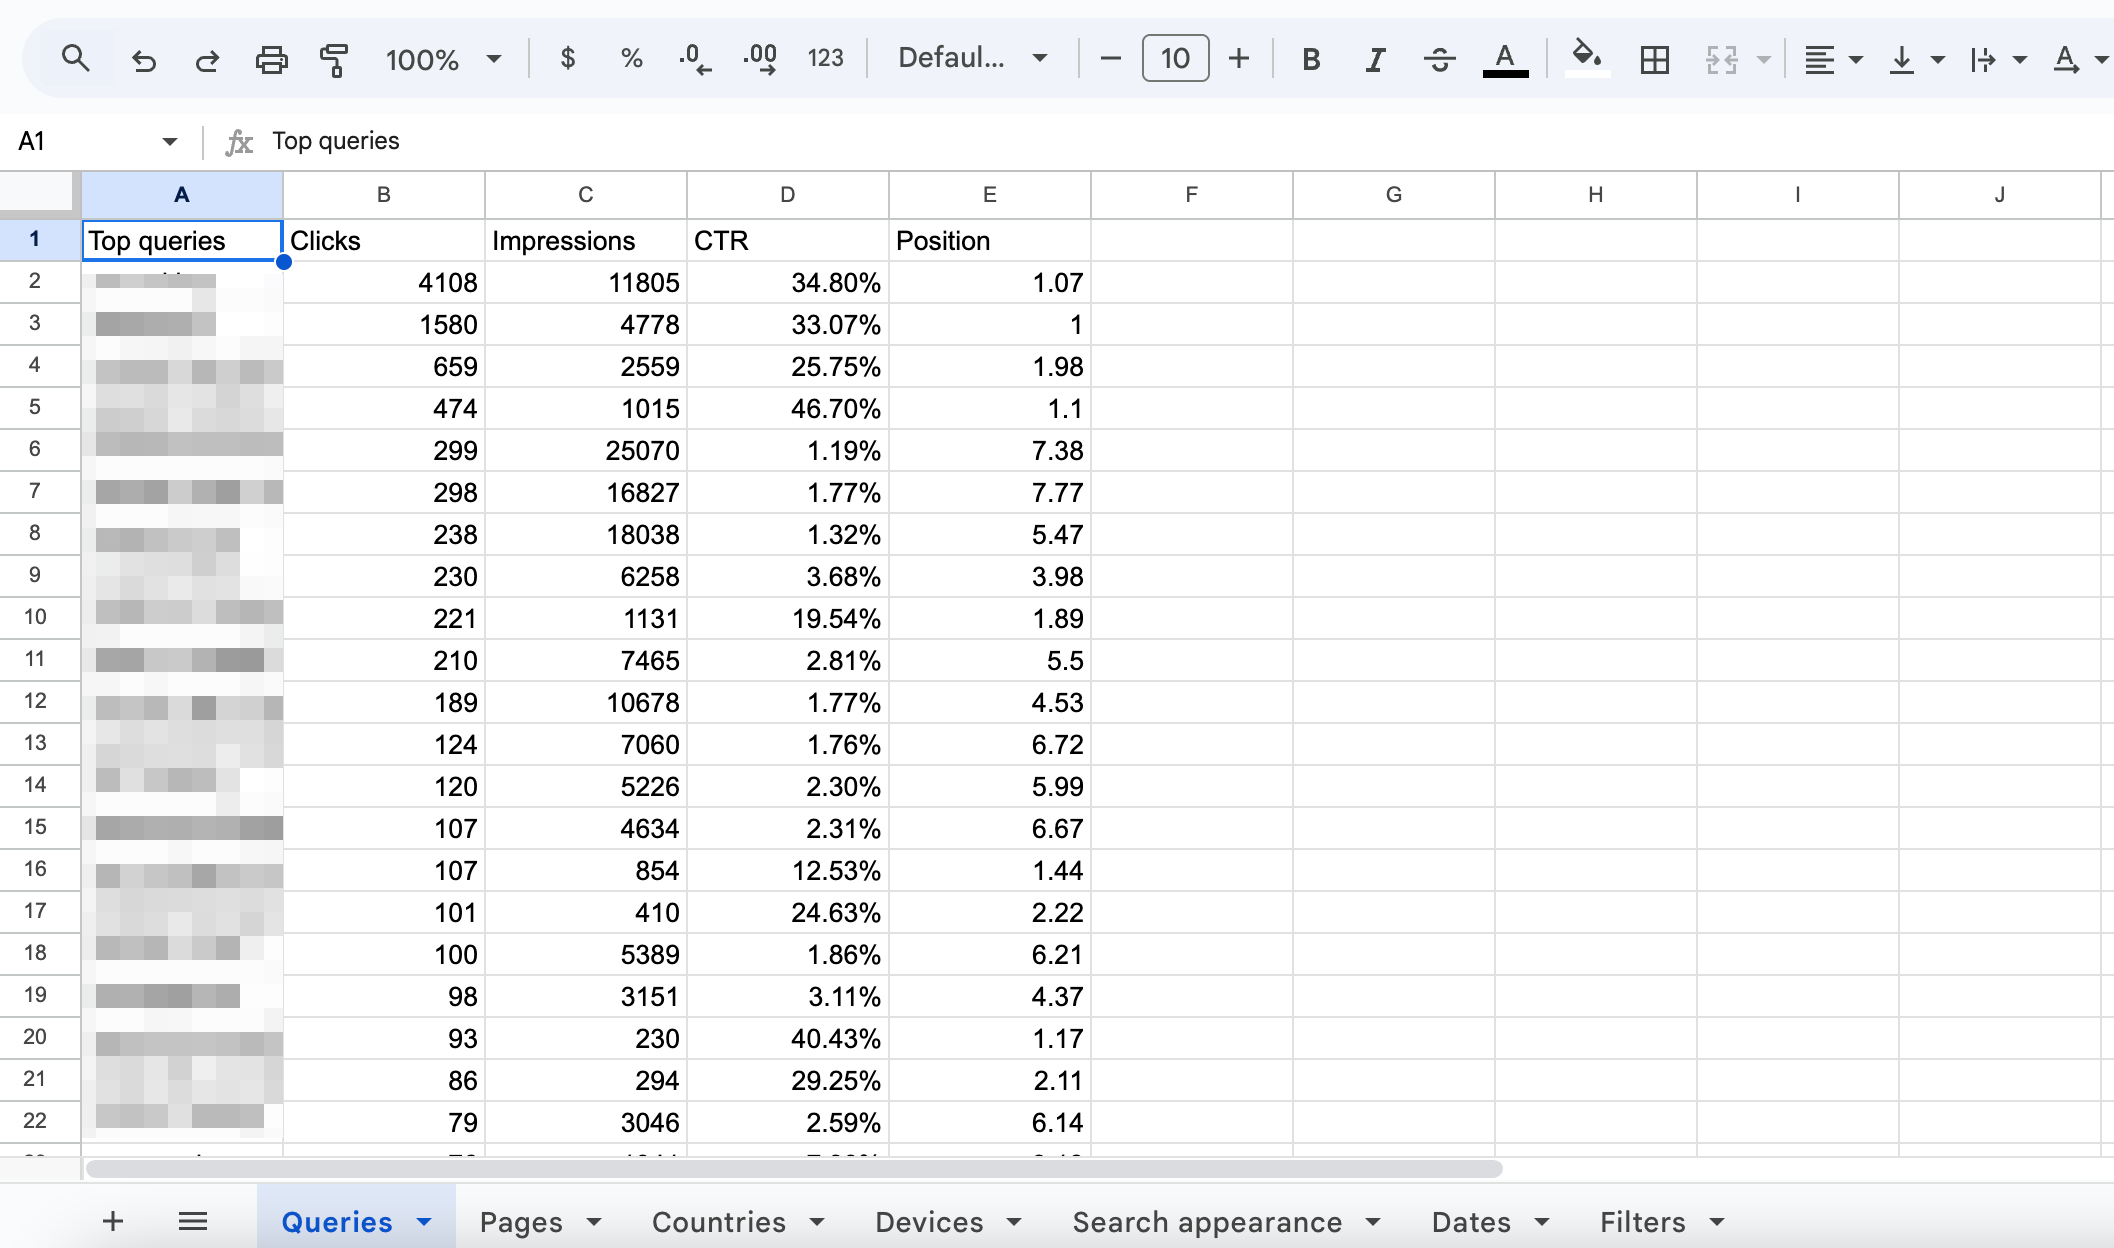
- Export GSC data by page and query.
Filter all data by country—in this case, the United States, just like in the AI Results Tracker and Rank Tracker. Also, select the same time period across all tools so your data stays consistent.
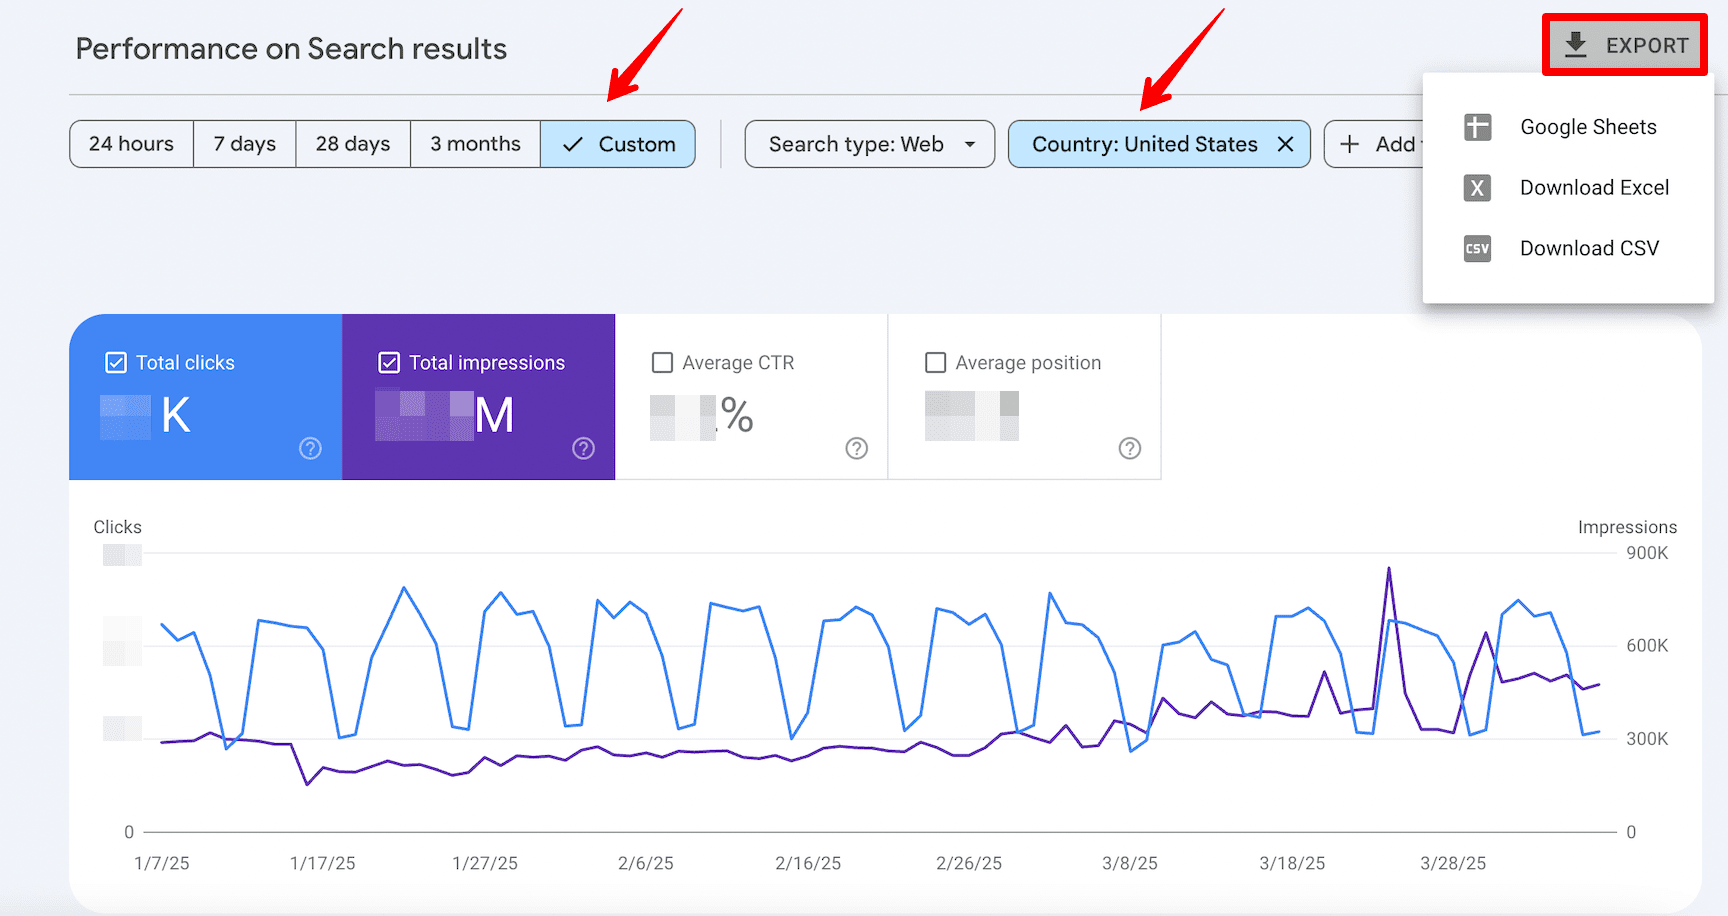
This is an example of what the table will look like.
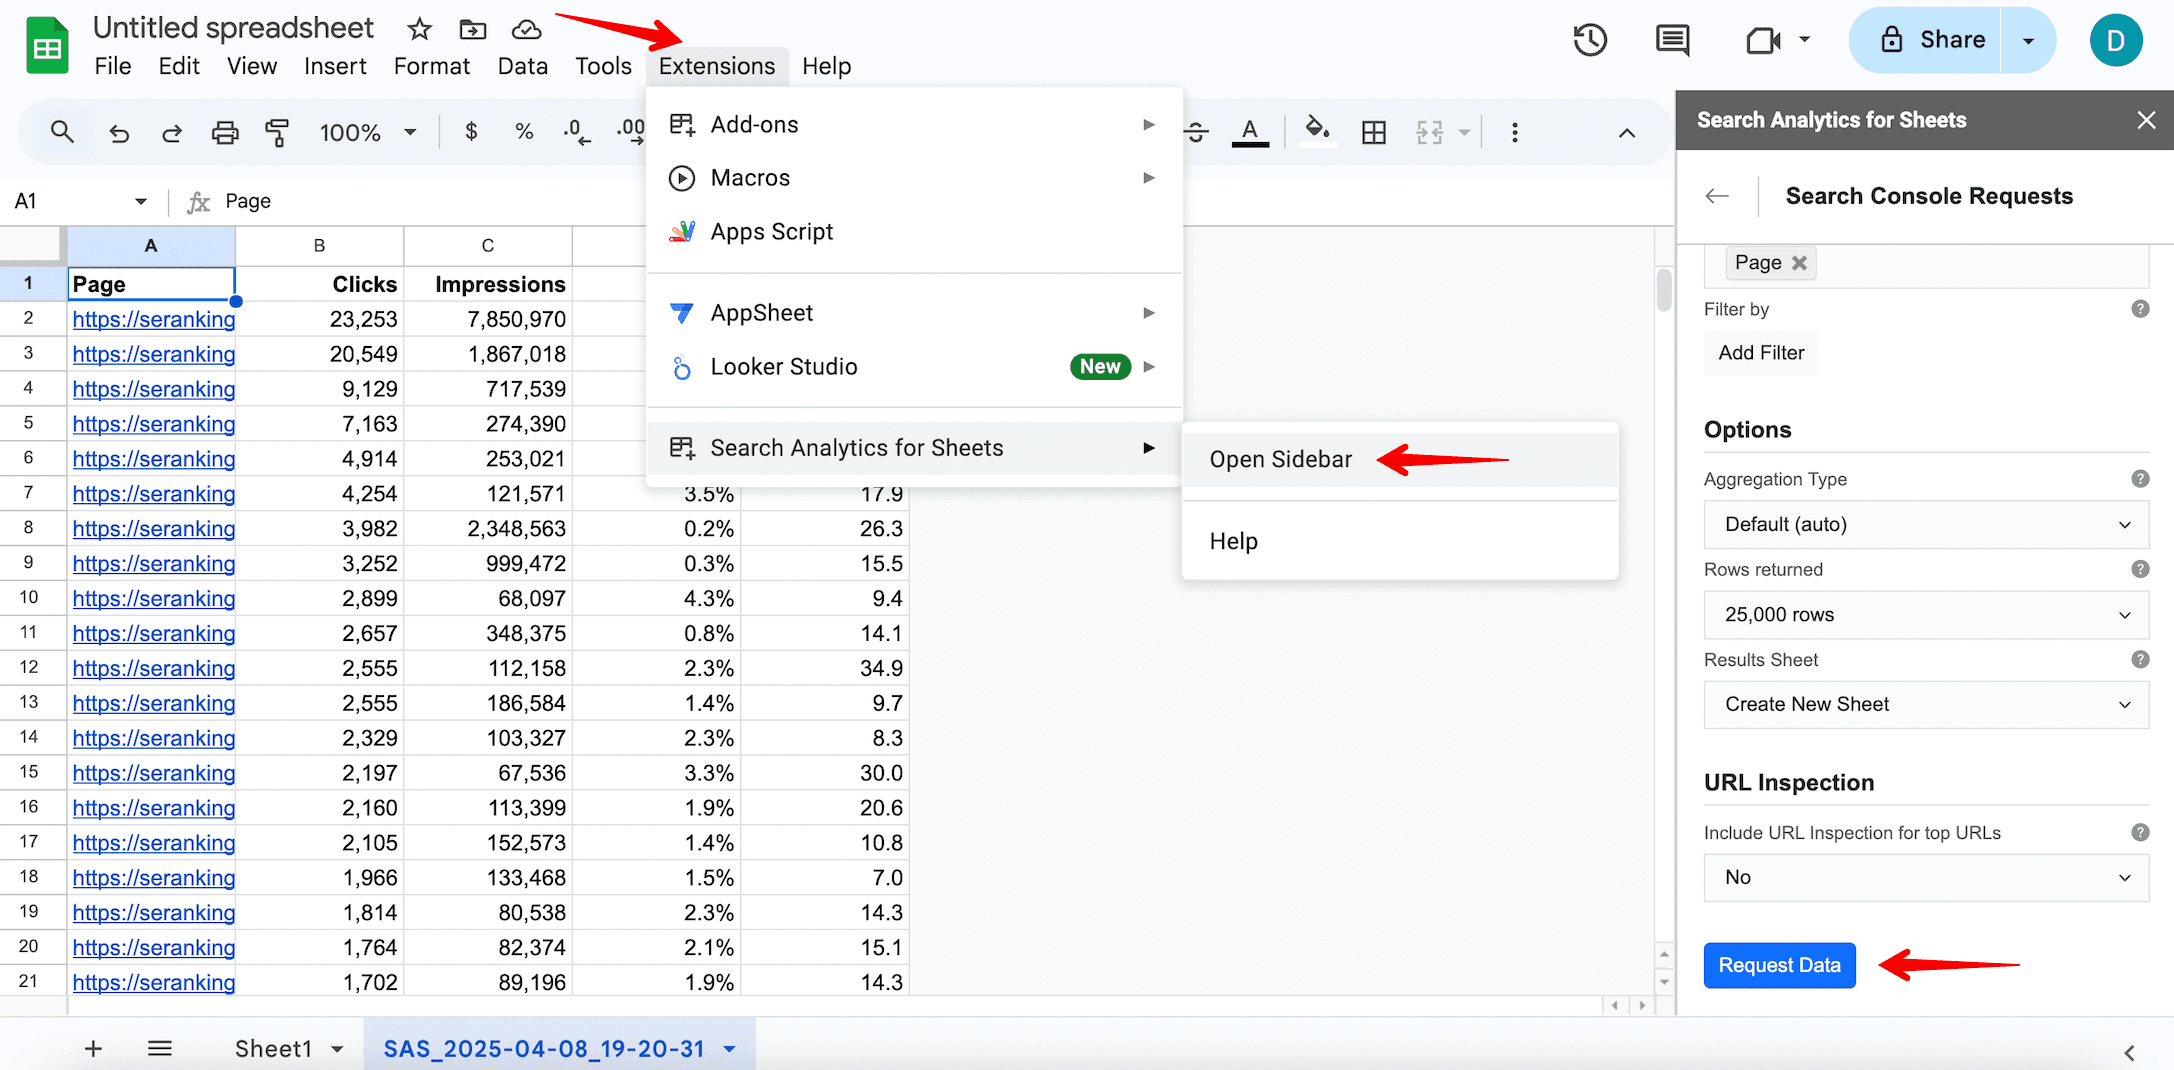
Alternatively, you can export the data using the Search Analytics for Sheets extension. You don’t need to open Google Search Console in advance. Just go to Extensions in Google Sheets, select the add-on from the list, and request the data. The add-on quickly brings the data you need into your spreadsheet in seconds.
Step 4. Merge the data
This gives you a comprehensive view of your SERP presence and traffic data.
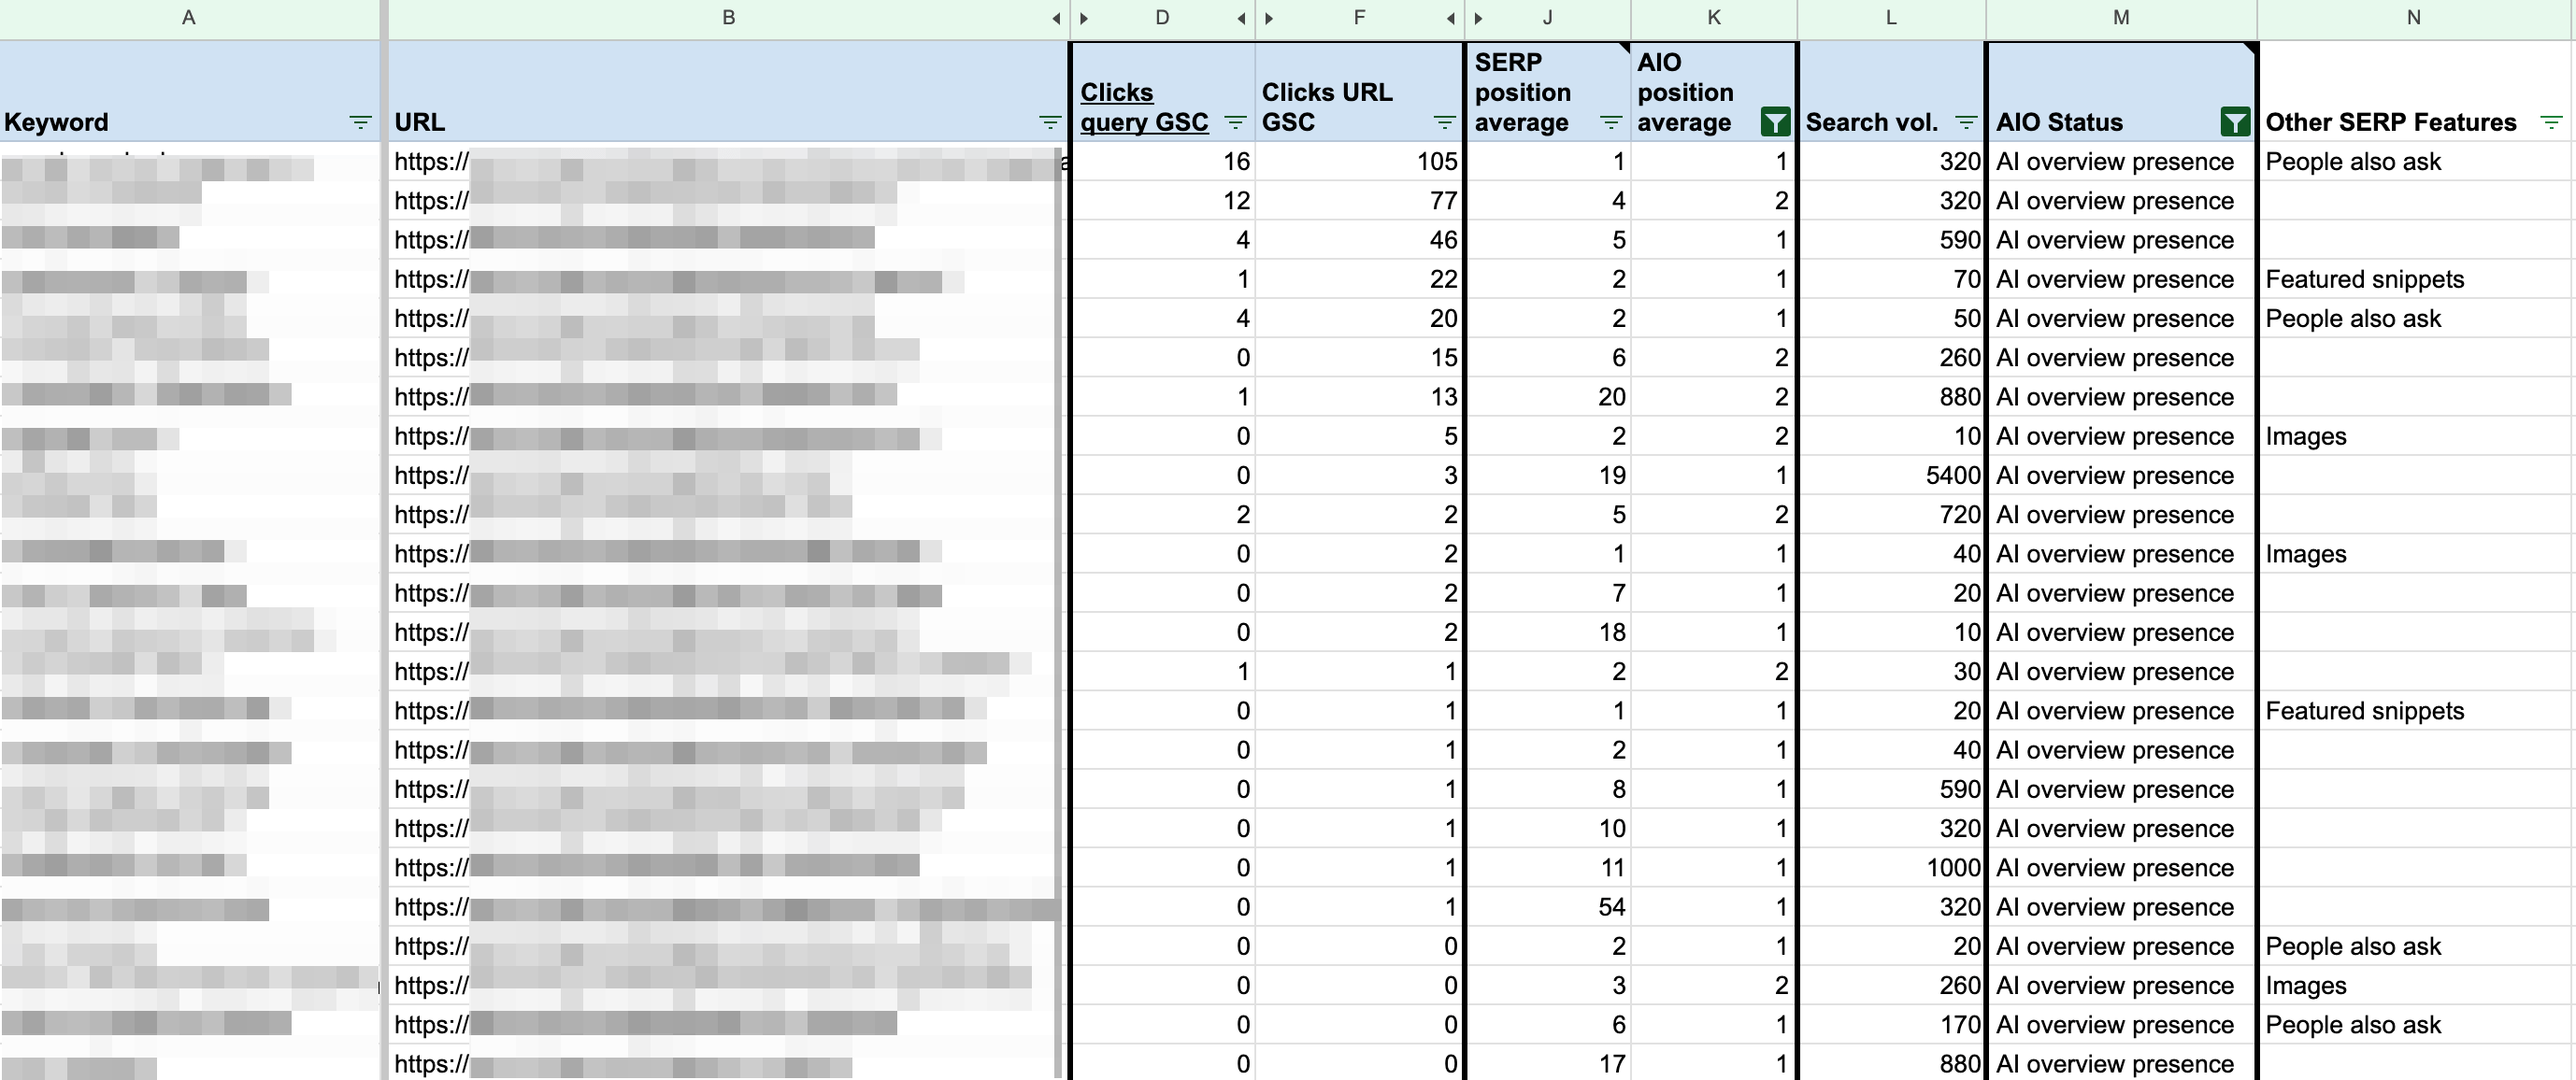
To run a quality analysis, make sure your table includes the following columns:
- Keyword
- URL
- Clicks by query (data from Google Search Console)
- Clicks by URL (data from Google Search Console)
- Average organic position (data from Rank Tracker) *Note: the data is provided for each day separately, so you’ll need to calculate the average yourself.
- AIO status (data from AI Tracker)
- Average position of AIOs (data from AI Tracker) *Note: the data is provided for each day separately, so you’ll need to calculate the average yourself.
- Search volume (data from Rank Tracker or AI Tracker) or Impressions (data from Google Search Console). *This column is optional and helps you gauge keyword traffic potential.
- Other SERP features (data from Rank Tracker)
Start by adding data from the three tables into separate tabs in Google Sheets. Then, use the =VLOOKUP formula, or an alternative, to merge everything into one view.

Once you’ve added all the data, your table should look something like this:
Step 5. Review all the data in your table to make an informed decision
Filter the keywords by their presence in AI Overviews and choose the ones you rank in the top 1–3 positions for in search. This helps you focus on the keywords and pages most likely to attract significant traffic.
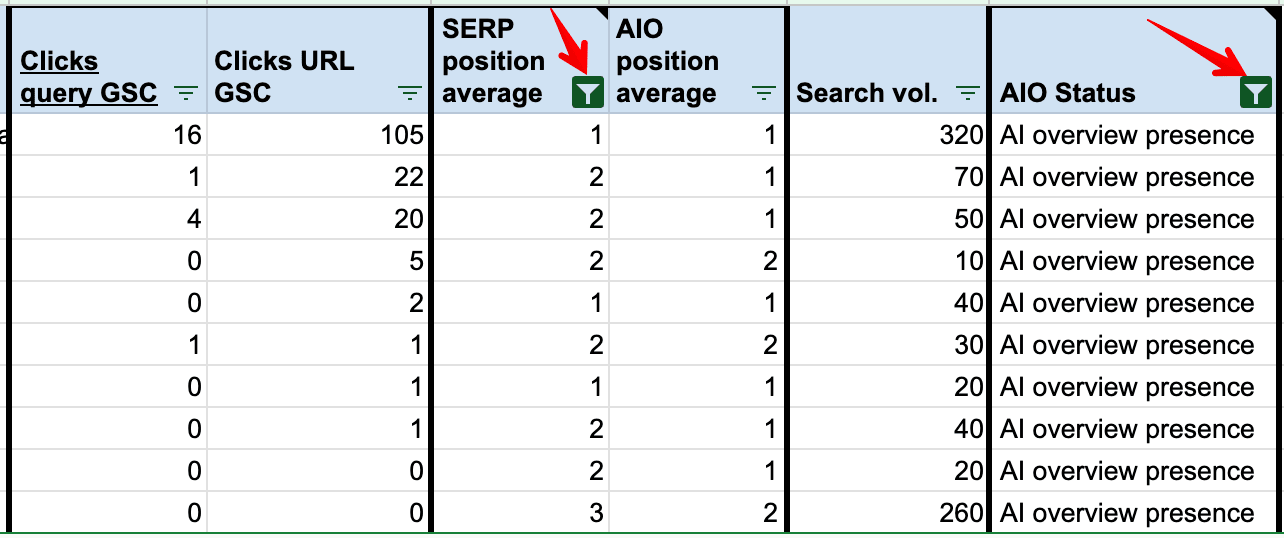
Now you can use this data to run a comprehensive analysis of how AI Overviews are affecting your website traffic.
- If your site consistently ranks at the top of the search results but you’re experiencing a drop in traffic, AI Overviews could be the culprit. See if your website appears in AIOs. If you’re listed as a source but not receiving very many clicks, it could mean that the AIO snippet answers the user’s query effectively and that clicking through isn’t necessary. If your site isn’t included—consider optimizing for AIOs.
- Compare different data periods to see if there’s an actual drop or if it’s just part of your usual traffic pattern. You can do a year-over-year comparison and look over the same period prior to the rollout of AI Overviews (if you have this option). If your traffic has dropped despite stable rankings in organic search, this could indicate that AI Overviews are pulling in your previous users.
- If the page has high rankings but low traffic with no AI Overviews, look closely at Google Ads or other SERP features like featured snippets. These frequently appear in the top spots of search results, sometimes taking up even more space than AI Overviews. This can impact your traffic tremendously.
- Keep search volume in mind. If it’s low, limited traffic is expected. However, if search volume is high and clicks remain low, AI Overviews might be diverting traffic away from your site.
- Finally, if you’ve completed all the previous steps and still can’t figure out what caused the drop (especially despite stable rankings), check whether the search intent and demand remained consistent (e.g., the topic is still relevant). Check for major changes in the regular SERP, like new competitors that might be drawing clicks away from your site.
These are just a few key insights you can uncover with this analysis. Your next steps will depend on your goals and how deep you want to go with the data.
You can make AIOs work in your favor instead of losing traffic by becoming one of the top sources featured in AIOs. This increases your chances of driving clicks to your pages. Read our article on how to optimize your site for AI Overviews to learn more.
Limitations and issues with analyzing AI Overviews and traffic
Consider the following factors when analyzing the impact of AI Overviews on your traffic:
- Data merging challenges: It can be tricky to merge data from your tracked keywords with traffic data from specific queries. This is because Google Search Console often provides limited query-level data, making it difficult to pinpoint which keywords drive traffic. This is even more noticeable if you’re trying to analyze the impact of AI Overviews on your rankings and clicks, especially since AIOs often show up for low search volume, long-tail queries.
- Dynamic nature of AI Overviews: AI Overviews are highly dynamic and can change frequently, affecting the visibility and ranking of your pages. You can gauge their impact better by using average monthly data instead of daily fluctuations.
- Traffic from untracked keywords: Your website can get a ton of traffic from non-targeted keywords, especially if it features a blog or informational content. Since you might not be actively tracking these queries, it’s easy to overlook them. Additionally, due to GSC’s limitations, you often can’t see which queries drive traffic, especially if they aren’t included in the report data.
- Location consistency: If your data spans multiple countries or regions, it can skew your results and make it harder to assess how AI Overviews are impacting your traffic in a specific region. To get accurate insights, make sure all your data comes from the same geographic location. For example, if you’re tracking rankings in the US, your traffic and click data should also be filtered to the US.
Note: SE Ranking’s AI Results Tracker currently only tracks AI Overview data in the USA. But we’re planning to add the UK and other European countries soon—stay tuned!
Keep all of these factors in mind to get a more comprehensive and accurate understanding of the impact of AI Overviews on your organic traffic.
Wrapping up
We hope the methods above help you conduct a thorough and accurate SEO analysis. By using three powerful tools—Google Search Console, SE Ranking’s Rank Tracker & AI Tracker, and Google Sheets—you can collect high-quality data in one place in just a matter of minutes.
We also frequently share our research, custom methods, and guides on our blog. Stay tuned for more insights!

