120+ SEO & marketing stats for 2026
Summarize this blog post with:
No matter how you approach SEO, one truth holds for all strategies: smart decisions come from hard facts. This is why we’ve compiled a list of over 120 current and verified SEO stats on everything from technical and local SEO to content performance, link building, and overall search visibility.
As you explore these insights, try to adapt your SEO strategies to them and always look out for the latest trends as they unfold.
Disclaimer: We used data from several sources. Some of the statistics in this post come directly from SE Ranking datasets. We also included insights from previous SE Ranking research studies and surveys, along with carefully selected, up-to-date statistics from reputable sources across the web.
1. General SEO statistics
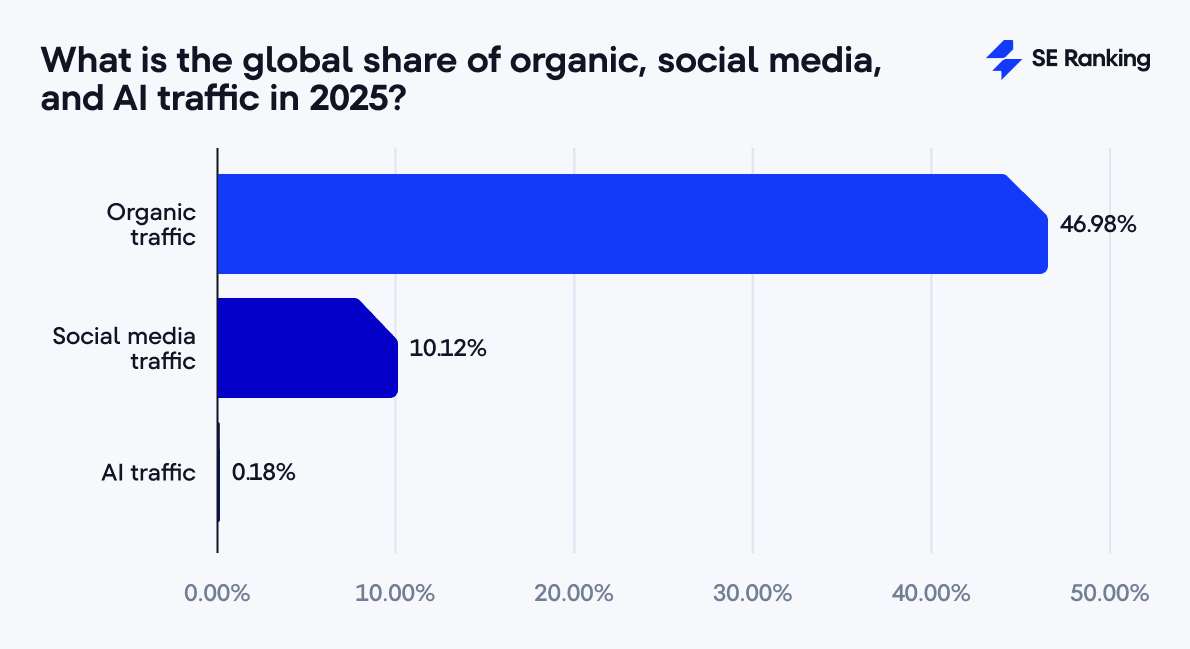
- Organic traffic represents 46.98% of all traffic, decreasing by 3.65% in 2025 (SE Ranking, 2025).
- The CTR for position 1 on SERPs is 39.8%, followed by 18.7% for position 2, 10.2% for position 3, and 7.4% for position 4 (FirstPageSage, 2025).
- The #1 organic result is 10x more likely to receive a click compared to a page in the #10 spot (Backlinko, 2025).
- The top websites in the US by traffic are Google, YouTube, Wikipedia, Reddit, and Facebook (SE Ranking, 2025).
- Among searchers, 70% have informational intent, 22% commercial intent, 7% navigational intent, and 1% transactional intent (SE Ranking, 2025).

- Conversion rates vary by page type, with white papers leading at 4.6%, followed by case studies at 3.5%, and landing pages at 3.1% (FirstPage, 2025).
- The Related Searches is the most popular SERP feature, appearing in 85% of cases, with Review rich results coming in second at 79% (SE Ranking, 2025).

- 58% of SEOs report a significant increase in industry competition due to AI (Influencer Marketing Hub, 2025).
- The global SEO market was valued at $82.3 billion in 2023 and is expected to grow to $143.9 billion by 2030 (Research and Markets, 2025).
- SEO proved highly effective for digital marketers in 2024, with 91% reporting a positive impact on website performance and marketing goals (Conductor, 2025).
2. Search engine statistics
- Google dominates the global search market with an 82.24% share, while Bing gets 10.67% of global traffic. In turn, Yahoo and Yandex hold shares of 2.69% and 2.18%, respectively (Statista, 2025).
- An estimated 5.9 million searches are conducted on Google every minute, totaling approximately 8.5 billion searches per day (Statista, 2024).
- The Google Search index includes hundreds of billions of webpages and exceeds 100,000,000 gigabytes in size (Google).
- Around 94% of all webpages receive no traffic from Google (SE Ranking, 2025).

- Only 1% of webpages receive over 10 clicks per month (SE Ranking, 2025).
- “YouTube” is the most searched keyword worldwide (SE Ranking, 2025).
- 21.1% of Google.com traffic comes from the United States, followed by Japan with 6.46%, and India in third place with 5.58% of visits to the search engine (Statista, 2025).
- The distribution of Google search volume by topic is as follows: Arts & Entertainment (17%), Computers & Technology (14%), E-commerce & Shopping (7%), Games (7%), and Science & Education (6%) (SparkToro, 2024).
- The top 10,000 Google queries represent 46% of total search demand, with just 148 terms contributing to nearly 15% of the search volume (SparkToro, 2024).
- Nearly 23% of Google users select from autocomplete suggestions when conducting searches (Backlinko, 2025).
- 50% of Google searchers click on a search result within 9 seconds, while 25% do so within just 5 seconds (Backlinko, 2025).
3. Content and on-page SEO statistics
- Guides & ebooks, webinars, and roundups are among the most effective content formats, achieving success rates of 27%, 26%, and 26% respectively (Orbit Media, 2025).
- 48% of marketers publish new content 2-4 times per month (Orbit Media, 2025).
- Most content marketers enhance their blog posts with visual and supporting elements: 88% include images, 60% use statistics, 45% feature contributor quotes, and 26% embed videos (Orbit Media, 2025).
- The average blog post length is approximately 1,333 words (Orbit Media, 2025).
- AI-generated content now accounts for 17.3% of content in Google’s top 20 search results, a significant increase from 2.3% in 2020 (Orginality.ai, 2025).
- On average, companies that use AI produce 42% more content each month (17 articles compared to 12 for those not using AI) (Ahrefs, 2025).
- Content marketers typically use AI for the following: idea generation and editing (66%), headline writing (58%), and outlining (54%) (Orbit Media, 2025).
- 11.3% of content marketers plan to invest over $45,000 per month in content marketing this year, which is up from 4.1% in 2024 (Siege Media, 2025).
- The majority of keywords get very little traffic, with nearly 74% having 10 or fewer searches per month (SE Ranking, 2025).
- Only 0.024% of keywords exceed 100,000 searches per month (SE Ranking, 2025).
- Titles with 40 to 60 characters tend to achieve the highest CTR in organic search results (Backlinko, 2025).
- URLs that include words related to a target keyword earn a 45% higher CTR than those that don’t include target keyword terms (Backlinko, 2025).
- On average, the most visited websites in the U.S. appear for 143.4M keywords, with YouTube topping the list at 301M keywords (SE Ranking, 2025).
- Approximately 44% of Google searches are related to branded terms, while 56% involve unbranded, generic queries (SparkToro, 2024).
4. Technical SEO statistics
- As of November 2025, just 54.6% of websites meet the overall Core Web Vitals (Chrome UX Report, 2025).
- 23% of websites have pages that do not link to their XML sitemap in the robots.txt file, and over 17% have sitemaps containing redirecting URLs (3XX). Furthermore, around 15% of websites are missing an XML sitemap altogether (SE Ranking, 2025).

- Only 26% of websites use alt text for their images (SE Ranking, 2025).
- 36% of websites feature oversized images (SE Ranking, 2025).
- 50% of websites give their pages duplicate meta descriptions, and 54% use duplicate title tags (SE Ranking, 2025).
- Among websites with CSS issues, 58% have oversized CSS files, 49% use uncompressed files, 44% lack minification, and 18% do not have CSS caching enabled (SE Ranking, 2025).

- 36% of websites have pages with a 4XX error, and 18% contain broken images that won’t load (SE Ranking, 2025).
- 32% of website owners permit AI platforms to access their content, while 29% restrict specific platforms, and 11% completely block AI scrapers to safeguard their content (NewzDash, 2025).
- 98.9% of websites use JavaScript as the client-side programming language (Web Technology Surveys, 2025).
- Minification of JavaScript files is the top technical issue for approximately 50% of websites (SE Ranking, 2025).

5. Link building and backlink statistics
- Approximately 40.7% of SEOs believe content marketing is the most effective method for achieving long-term, passive link-building results (uSERP, 2025).
- The #1 result in Google has an average of 3.8x more backlinks than positions #2-10 (Backlinko, 2025).
- On average, 63% of backlinks point to the homepage, while the remaining 37% are distributed across other pages (SE Ranking, 2025).
- About 3 out of every 10 backlinks a website gets have a medium or high toxicity, meaning they can pose a threat to your website (SE Ranking, 2025).
- Around 95% of all pages have zero backlinks (Backlinko, 2025).
- 52.7% of SEOs consider service and product pages the most important for link acquisition (Editorial Link, 2025).
- 80% of SEOs report that a backlink typically takes about 2-6 weeks to impact search rankings (Editorial Link, 2025).
- Link-building costs vary widely, ranging from below $200 to $1,200 per link (Siege Media, 2025).
- For most businesses, the lifetime value of a link falls between $5,000 and $15,000 (Siege Media, 2025).
- Around 86% of the guest posting sites are low quality, meaning they are below 10K monthly traffic and DR 40 (Buzzstream, 2025).
- 91.9% of SEOs are convinced their competitors buy backlinks (Editorial Link, 2025).
- In 2024, 73.3% of content marketers said link building played a significant role in their content strategies, but by 2025, that number dropped to 53.3% (Siege Media, 2025).
6. Local SEO statistics
- Approximately 14% of all keyword searches are made to find local information or businesses (SE Ranking, 2025).
- For local searches, 42% of users click on results displayed within the Google Maps Pack (Backlinko, 2025).
- Businesses with a complete Google Business Profile are 70% more likely to attract visitors and 50% more likely to be considered for a purchase (Google).
- Before choosing a local business, 74% of consumers check reviews on at least 2 sites (BrightLocal, 2025).
- Consumers usually read online reviews on Google (83%), Yelp (44%), and Facebook (BrightLocal, 2025).
- 35% of people use Instagram to get local business information, while 34% use TikTok (SOCi Consumer Behavior Index, 2025).
- 59% of consumers only consider using a local product or service if it’s rated 4 stars or more (BrightLocal, 2025).
- 89% of consumers are more likely to choose a business that responds to all reviews, while only 44% would choose one that ignores reviews (BrightLocal, 2025).
- 96% of consumers are open to writing a business review (BrightLocal, 2025).
- The most important factors for local organic rankings, according to SEOs, are having dedicated service pages, geographically relevant content, and high-quality backlinks (Whitespark, 2025).
- When two users in different cities search the same local “near me” keyword, AI Mode delivers almost completely different results. Only about 23% of the websites overlap, and the specific pages (URLs) almost never match (SE Ranking, 2025).
- Adding a city name (e.g., “restaurants in Denver”) to the local query nearly doubles AI Mode stability, with about 50–55% of websites repeating across different AIM responses (SE Ranking, 2025).
7. Mobile search statistics
- There are 5.78 billion unique mobile phone users worldwide, which translates into 70.1% of the global population (We Are Social, 2025).
- Since 2020, mobile devices and smartphones have consistently driven over 50% of global website traffic, reaching a peak of 62.73% in 2025 (Statista, 2025).
- Globally, Google dominates the mobile search market with a 94.35% share, followed by Yandex at 2.03% and Baidu at 0.83% (StatCounter, 2025).
- People spend an average of 5 hours 16 minutes per day using mobile devices (Harmony, 2025).
- Mobile apps that reference AI in their name, subtitle, or description now generate more than 17 billion downloads worldwide—up from just 5 billion in 2019 (Sensor Tower, 2025).
- ChatGPT is the most downloaded mobile app in the world with 903 million downloads (Statista, 2025).
- Video apps comprise 75.9% of monthly global mobile data consumption (Statista, 2025).
- By 2028, nearly 70% of worldwide digital ad revenue is expected to come from mobile (Statista, 2025).
8. Video and visual marketing statistics
- In the U.S., videos appear in 78% of Google search results pages (SE Ranking, 2025).
- 94.6% of people watch online videos each week (We Are Social, 2025).
- 89% of businesses incorporate video as part of their marketing strategy (Wyzowl, 2025).
- 62% of video marketers report that using video has helped decrease the number of support inquiries they receive (Wyzowl, 2025).
- 51% of video marketers report using AI tools to create or edit marketing videos, while 49% haven’t adopted them yet (Wyzowl, 2025).
- In the U.S., images appear in 35% of Google search results pages (SE Ranking, 2025).
- Marketers report that short-form videos (21%), images (19%), and live-streamed videos (16%) provide the highest ROI (Hubspot, 2025).
- 91% of marketers plan to maintain or increase their investments in podcasts and audio content in 2025 (Hubspot, 2025).
- 30% of marketers focus on short-form video content (Reels, TikTok videos), while 29% primarily create text-only posts (Planable, 2025).
9. E-commerce marketing statistics
- Globally, there are more than 24 million e-commerce websites (MARKINBLOG, 2025).
- The US leads in the number of e-commerce sites with 12 million. It is then followed by the UK (1.1 million), Brazil (0.7 million), and Germany (0.7 million) (MARKINBLOG, 2025).
- Around 56.5% of internet users make online purchases each week (We Are Social, 2025).
- The main factors driving online purchases include free shipping (50.7%), discounts and coupons (38.9%), and positive customer reviews (32.2%) (We Are Social, 2025).
- The most used shopping sites (by the average monthly global traffic) are Amazon (2.71B visits), Temu (1.63B visits), and AliExpress (646M visits) (We Are Social, 2025).
- Top Google shopping searches are iPhone, Samsung, Nike, Amazon, and Adidas (We Are Social, 2025).
- 87% of consumers have been influenced to purchase a product or service after watching a video (Wyzowl, 2025).
- 19% of product-related searches result in a click on Google Shopping listings (Backlinko, 2025).
- Every hour, Google Shopping Graph updates over 2 billion listings to give users fresh and accurate results (Google, 2025).
- Approximately 2 billion people worldwide shop online, contributing to $4.2 trillion in global e-commerce sales (Siteefy, 2025).
10. SEO salary statistics
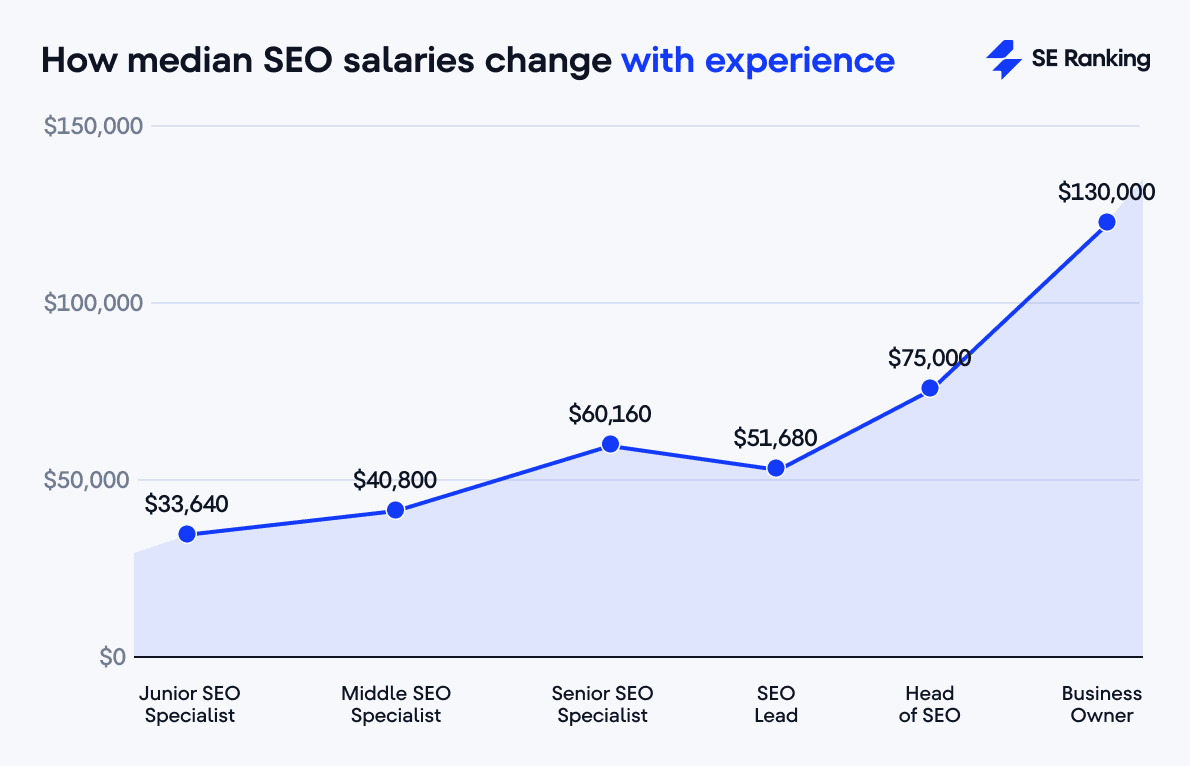
- The median salary for SEO specialists worldwide is $51,680 (SE Ranking, 2025).
- In the U.S., SEO professionals earn roughly 60% more than their counterparts in the EU (SE Ranking, 2025).
- Freelance SEOs make a median income of $58,000, about 14.4% higher than employed SEO specialists, who earn $50,675 (SE Ranking, 2025).
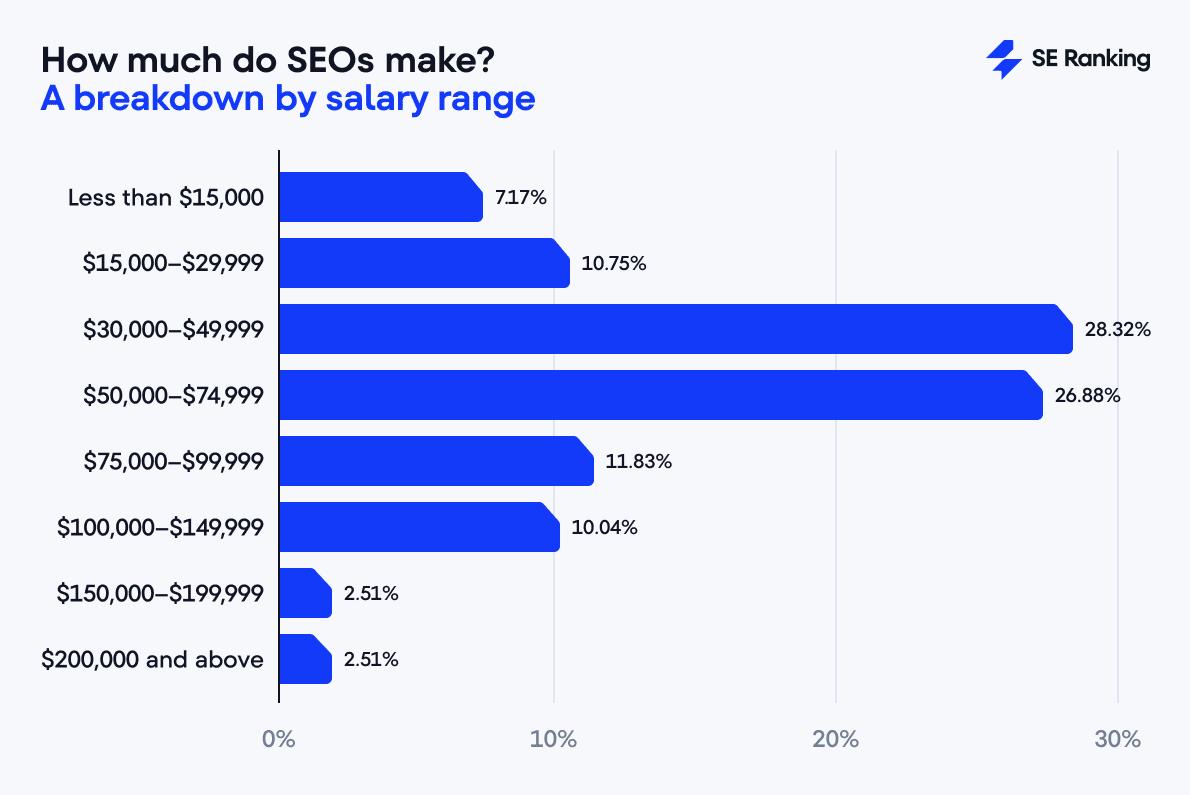
- SEO salaries generally increase with experience: junior specialists average $33,640, senior specialists $60,160, while SEO heads and business owners earn $75,000 and $130,000, respectively (SE Ranking, 2025).
- Around 64.5% of SEO professionals worldwide received a pay raise in the past year (SE Ranking, 2025).
- Nearly 40% of freelance SEOs believe their earnings are competitive, compared with just 24% of in-house specialists (SE Ranking, 2025).
- SEO managers earn, on average, 41.5% more than specialists without managerial responsibilities (SE Ranking, 2025).
- Only 13.7% of freelance SEOs maintain a standard 40-hour workweek, whereas half of in-house SEOs do (SE Ranking, 2025).
11. Social media statistics
- In 2025, social media users surpassed 5.66 billion, compared to only 1.9 billion users in 2014 (We Are Social, 2025).
- Social platforms account generate 10.12% of global traffic (SE Ranking, 2025).
- Around 50% of all Google searches feature at least one social media platform in the top 10 organic results. The platforms that appear most frequently are Reddit (37%), YouTube (19.8%), Quora (8%), LinkedIn (5%), and Instagram (2.6%) (SE Ranking, 2025).
- In Google’s AI Overviews, social media sites appeared in 20% of queries, whereas in AI Mode, the share increased to 36%. Across both formats, the platforms most frequently referenced were YouTube, Reddit, Quora, LinkedIn, and Medium (SE Ranking, 2025).
- In ChatGPT responses, 53.89% include at least one social media platform, with Reddit, LinkedIn, Medium, and YouTube being the most commonly cited (SE Ranking, 2025).
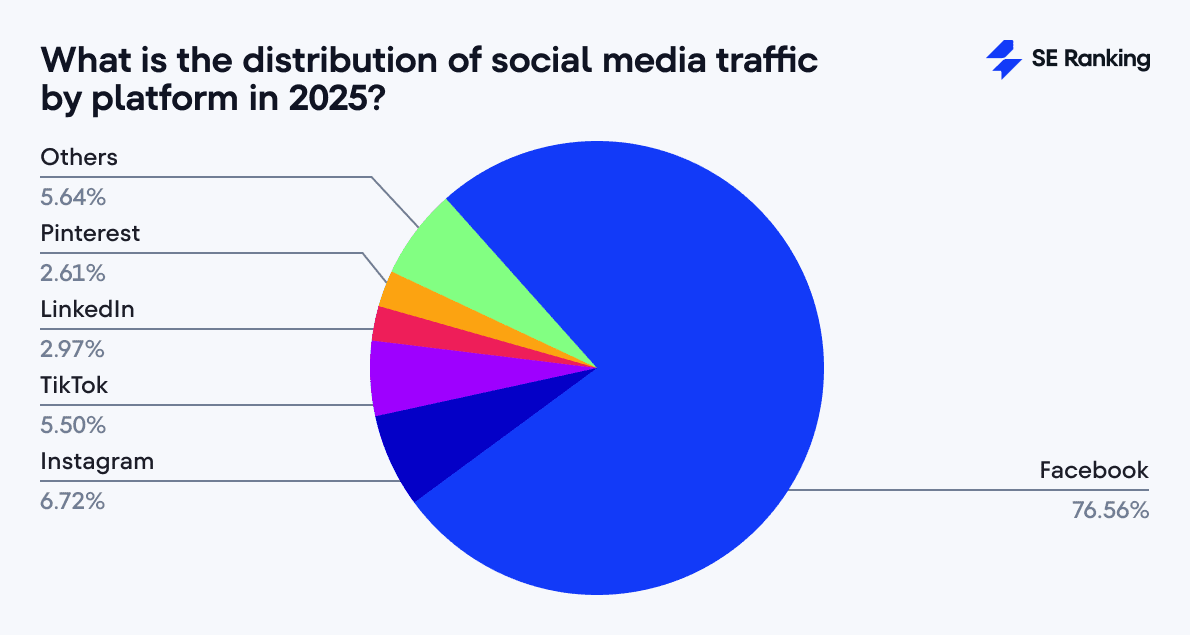
- Facebook dominates with 76.56% of all social media traffic, followed by Instagram (6.72%), TikTok (5.50%), LinkedIn (2.97%), and Pinterest (2.61%). Combined, these 5 platforms account for nearly 95% of all social-driven visits (SE Ranking, 2025).
- TikTok is the fastest-growing source of social search traffic in 2025. While it accounts for a relatively small 5.50% of social referrals, its traffic has increased 5x since the beginning of 2025 (SE Ranking, 2025).
- TikTok has the highest median engagement rate at 1.73%, significantly surpassing Instagram at 0.36%, Facebook at 0.04%, and X (formerly Twitter) at 0.015% (Rival IQ, 2025).
- 96.9% of people used at least one social media platform within the past month (We Are Social, 2025).
- The average time on social media per day by internet users worldwide is 2 hours and 21 minutes (Statista, 2025).
- The average person uses about 6-7 social media platforms per month (Statista, 2025).
- The most popular social networks by monthly active users are Facebook (3.07 billion), Instagram (3 billion), WhatsApp (3 billion), YouTube (2.58 billion), and TikTok (1.99 billion) (Statista, 2025).
- 37.5% of marketers manage social media solo, highlighting how lean social media operations remain despite growing platform demands (Planable, 2025).
- 40% of social media teams struggle with content reviews and approvals, making it the top workflow bottleneck (Planable, 2025).
- 38% of marketers only plan content 1 week ahead, with just 14% planning 3+ months in advance (Planable, 2025).
- Approximately 81% of marketers say increased exposure is the top benefit of social media marketing, with 71% mentioning increased traffic and 62% citing generated leads as additional advantages (Statista, 2025).
8422 views