Social media traffic 2025: How does it compare to organic and AI traffic channels?
For years, “search” was synonymous with Google. But in 2025, this is no longer true. Search has fragmented.
Now, it happens everywhere: through traditional search engines, in AI assistants, and across feeds on social media platforms. When you have a question, you might type it into Google, drop it into ChatGPT, or swipe through TikTok for answers.
To measure the role of social platforms in search, we conducted a new research study. Our findings show that social media is no longer just a marketing channel; it’s part of search itself.
Let’s take a closer look at the numbers.
-
Social platforms account for a meaningful share of website traffic.
They now generate 10.12% of global traffic. In comparison, organic search still leads at 46.98% but has lost 3.65% in just eight months, since the beginning of 2025. AI traffic remains tiny at 0.18%, though it is rising quickly.
-
Social platforms now directly shape organic search results.
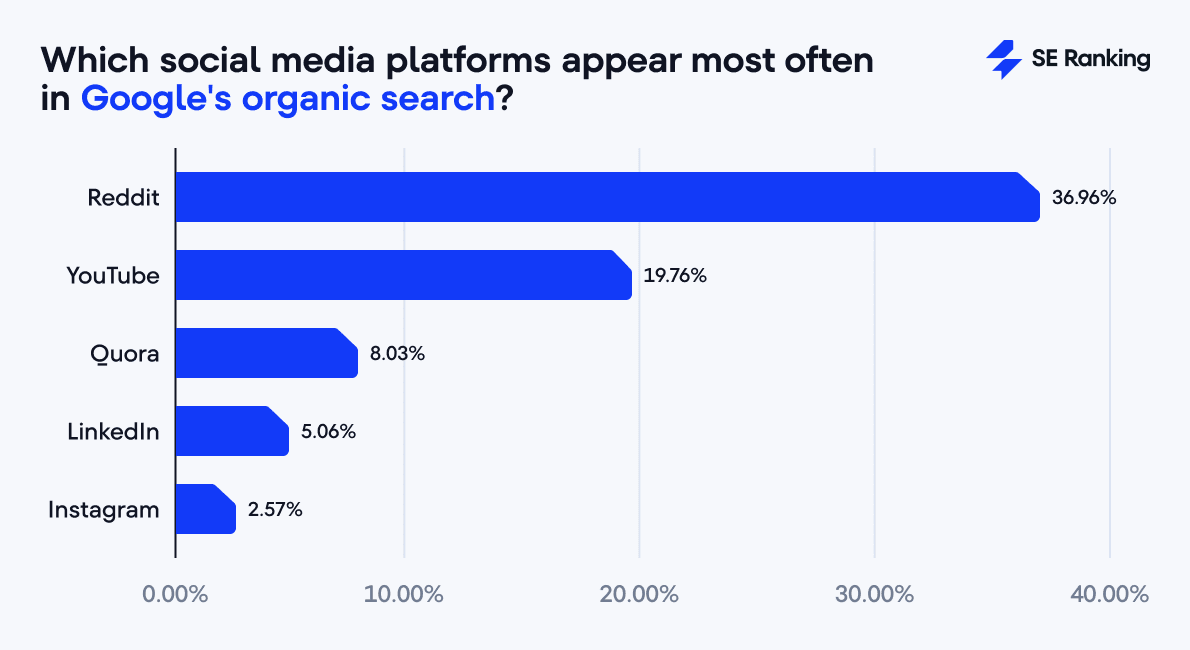
Around half of all Google searches (50.3%) include at least one social media platform among the top-10 organic results. The most visible are Reddit (37%), YouTube (19.8%), Quora (8%), LinkedIn (5%), and Instagram (2.6%).
-
AI-generated answers often reference social media platforms.
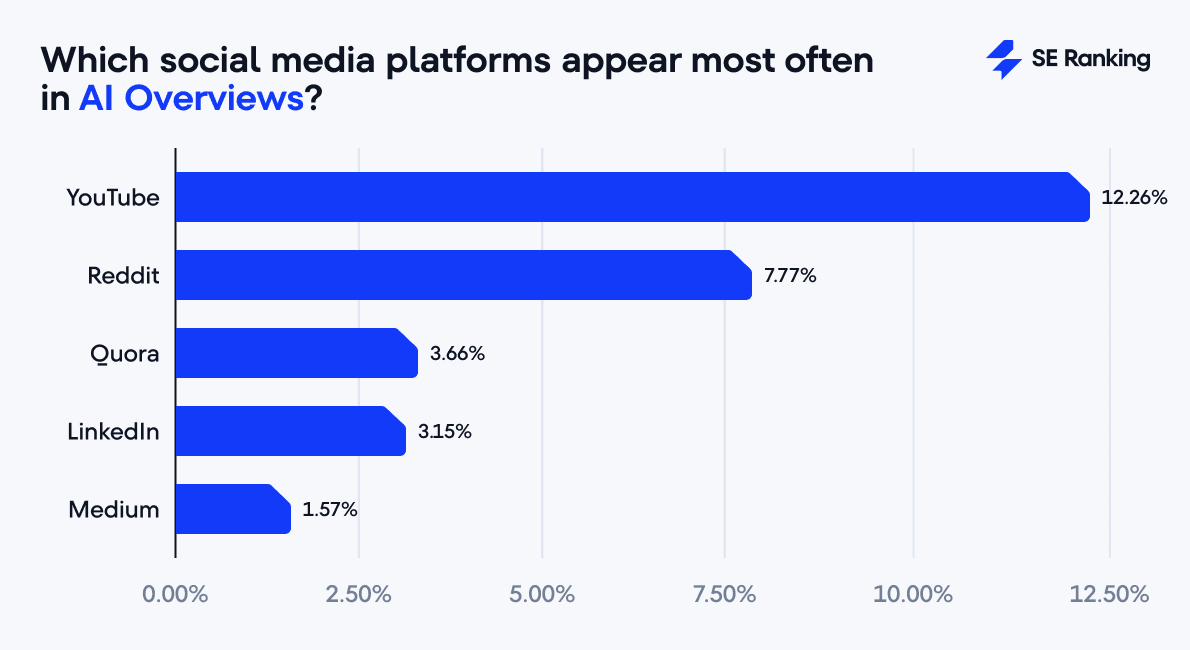
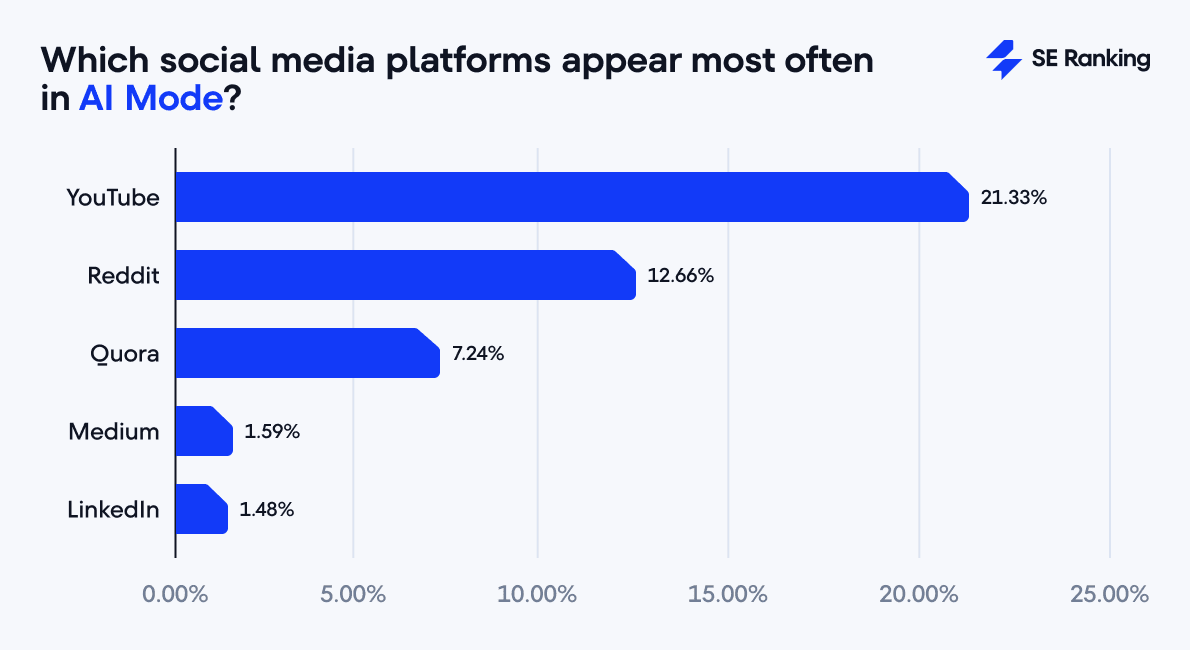
In Google’s AI Overviews, at least one social site appeared for 20% of queries, while in AI Mode, that figure rose to 36%. The most cited platforms in both cases were YouTube, Reddit, Quora, LinkedIn, and Medium.
-
The majority of social media traffic comes from a limited set of platforms.
Facebook leads with 76.56% of all social traffic, followed by Instagram (6.72%), TikTok (5.50%), LinkedIn (2.97%), and Pinterest (2.61%). Together, these five generate nearly 95% of social-driven visits, leaving little room for other social platforms.
-
TikTok is the fastest-growing source of social search traffic in 2025.
Although it holds a modest 5.50% share of social referrals, its traffic nearly increased fivefold from January to August 2025. Users are increasingly turning to TikTok for answers and recommendations, not just entertainment.
-
X/Twitter’s role as a traffic driver is shrinking.
It contributes just 1.80% of social referrals in 2025. Policy shifts, rebranding, and moderation decisions are likely the key factors behind this decline.
-
Social media traffic differs across regions.
In the U.S., it accounts for 15.23% of visits, well above the global average, while in the UK it makes up just 6.14%. This means the American market generates over twice as much social traffic share.
Global data: Organic vs. social. vs. AI traffic
When we look at how people are finding websites today, three channels stand out: traditional search engines, social media platforms, and AI tools. Each plays a different role, and the balance between them is starting to shift.
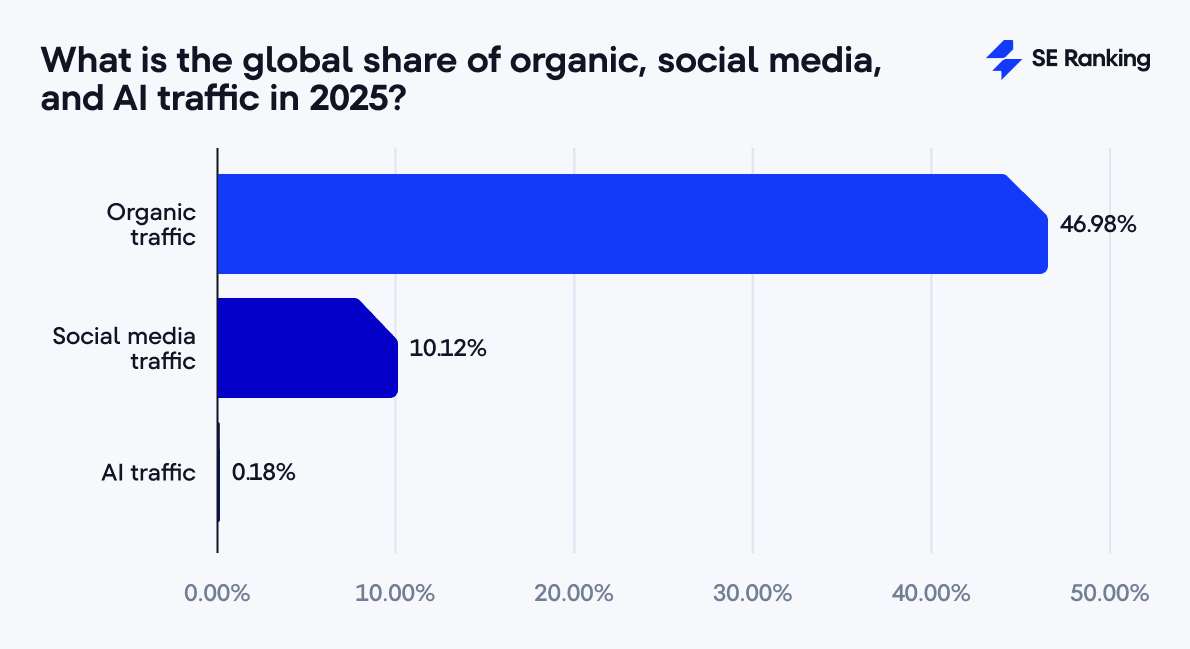
The biggest driver is still organic search, which accounts for 46.98% of all traffic worldwide. That means nearly one in two visits to a website still begins with an organic search engine.
But what’s important is the trend: organic’s share is slowly declining, falling from 49.15% in January to 45.50% in August. It’s a 3.65% slide over just eight months, with the sharpest drop between April (47.24%) and May (45.77%).
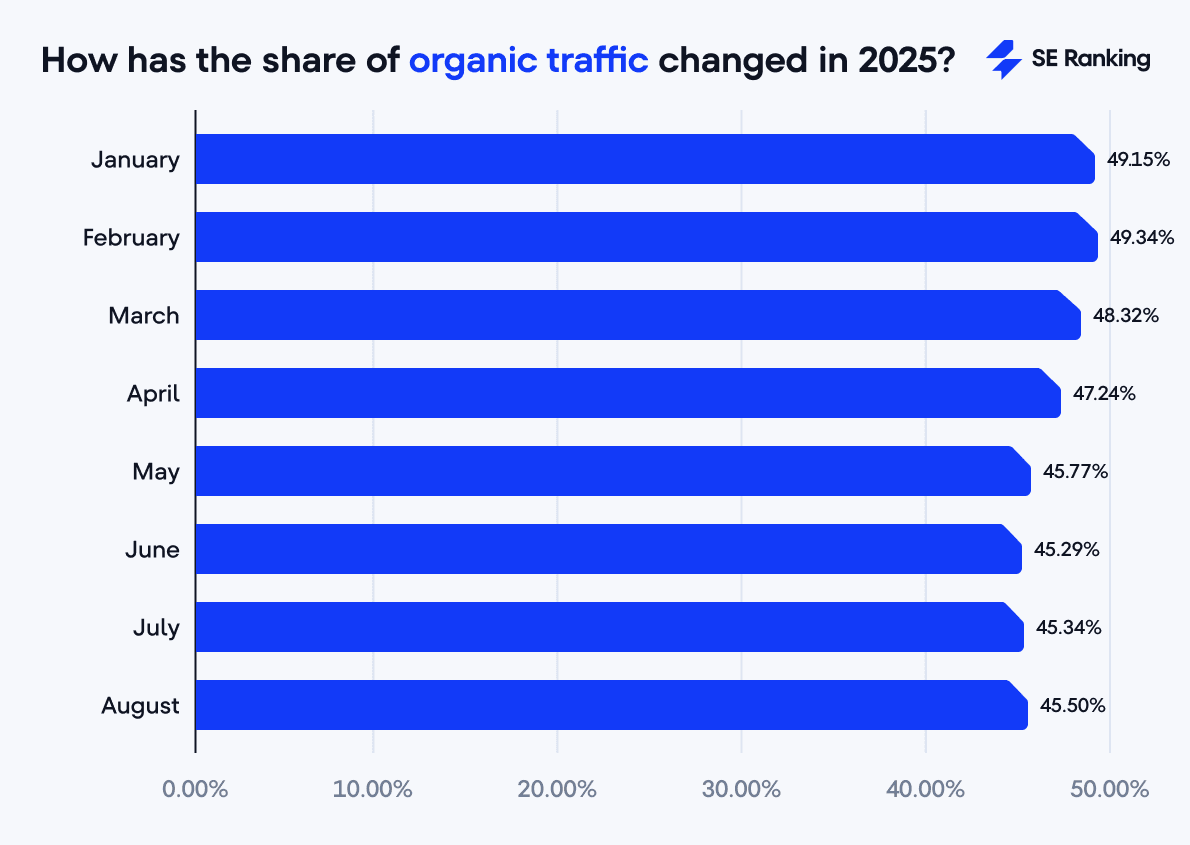
Note: The dip in organic share might not be purely performance-related. Part of it could be seasonal, since web traffic tends to ease off during the summer months. Another factor might be attribution changes, where visits once marked as organic are now being counted under other channels.
Next is social media, which makes up 10.12% of traffic. That might sound small compared to organic search, but it’s significant. In practical terms, if you lined up ten visitors, at least one of them likely came from a social platform.
Social’s share peaked at 11.50% in March and then eased through the summer, reaching 9.47% in August.
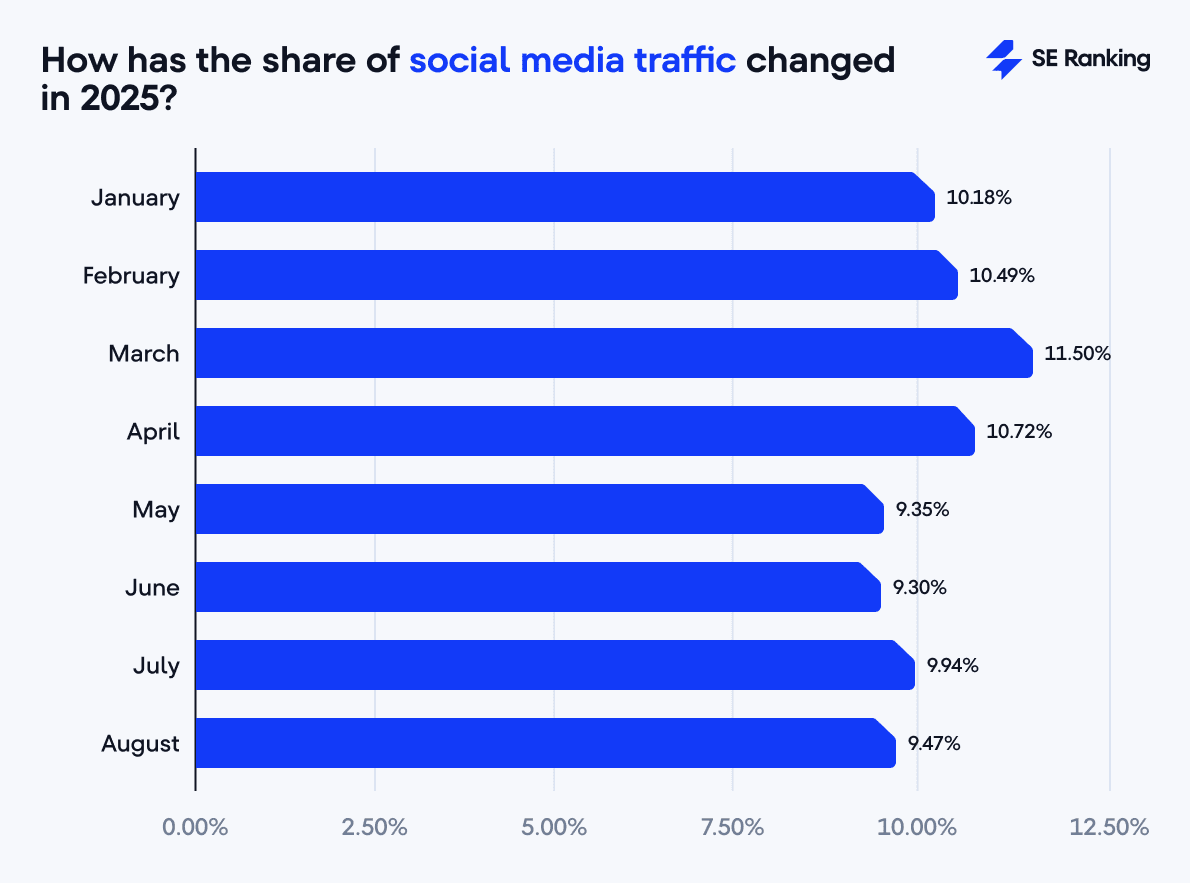
Social isn’t replacing organic search, but it’s becoming a steady alternative way for people to discover content.
Finally, there’s AI traffic, which is still in its very early days as a source of website visits.
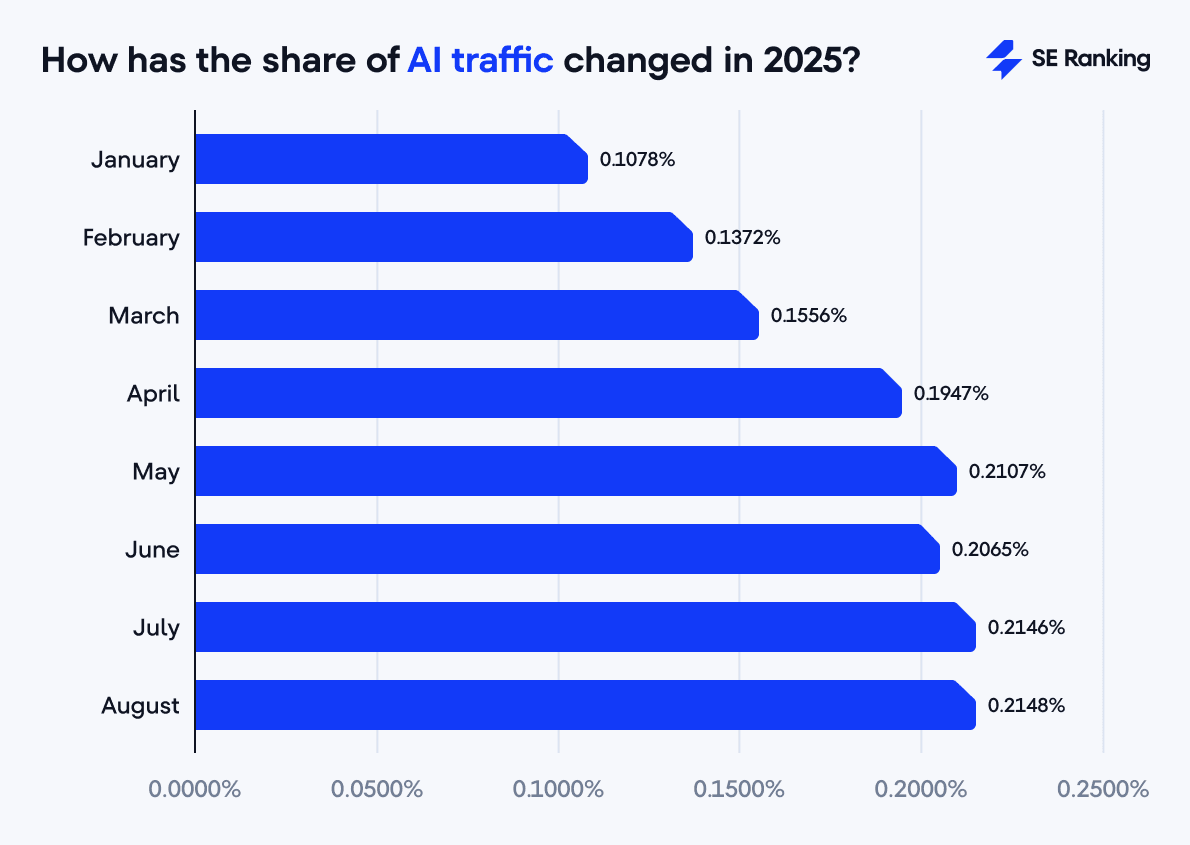
Across all the sites we studied, referrals from AI platforms made up 0.18% of traffic. On its own, that’s tiny. But the growth rate shows a more complete picture: AI traffic nearly doubled in the first eight months of 2025, from 0.11% in January to 0.21% in August. Even though the numbers are small, this pace suggests AI could become a more noticeable traffic source sooner than many expect.
A total of 99.24% of websites receive traffic from organic search, 82.52% from social media, and 68.94% from AI search.
Overall, organic search remains the primary channel through which people reach websites, but social media and AI now contribute a strong share as well. In fact, our data shows that 64.08% of websites attract visitors from a combination of all three sources: organic, social, and AI.
How often do social media platforms appear in search?
Our research shows that social media platforms are deeply embedded in modern search results across traditional engines, AI Overviews (AIOs), and AI Mode (AIM) responses.
1. Google organic search
For half of the analyzed queries (50.3%), at least one social media platform appeared in the top-10 organic results. The most visible platforms were:
2. AI Overviews
Google’s AI-generated answers also frequently cite social media platforms. At least one such site was mentioned in 20% of the analyzed queries. The top five were:
3. AI Mode
In AI Mode responses, social platforms were even more prominent. At least one was mentioned in 36.3% of queries. The leading platforms were:
Key takeaway: In all three environments (Google organic search, AIOs, and AIM), social media platforms appear consistently. This confirms that social media is no longer just a place for community and conversation; it now plays a defining role in how search itself works.
Top 8 social media platforms by traffic in 2025
To begin with, let’s take a look at the overall distribution of traffic generated by social platforms in 2025 worldwide.
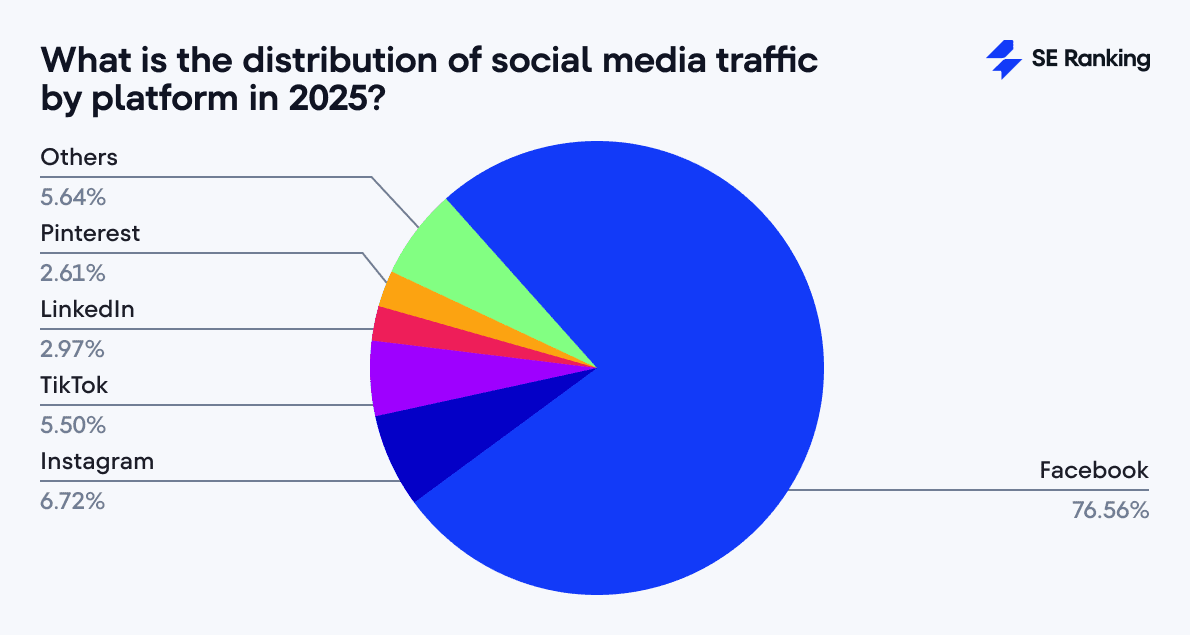
As you can see, Facebook is the clear leader here, making up 76.56% of all social referrals (7.75% of total traffic). It is then followed by Instagram (6.72%), TikTok (5.50%), LinkedIn (2.97%), and Pinterest (2.61%). Together, these five platforms account for around 95% of all traffic coming from social media, leaving only small shares for YouTube (1.86%), X/Twitter (1.80%), Reddit (1.37%), and others.
This ranking shows two important things: first, Facebook still dominates social referrals by a wide margin, and second, most of the remaining traffic is concentrated among a handful of platforms. The long tail of smaller networks contributes very little in comparison.
Now let’s break down how each social platform’s traffic is moving this year, and what those shifts could mean going forward.
As we’ve mentioned above, Facebook is by far the largest source of social media referrals in 2025. It drives 7.75% of total global traffic, which equals almost 77% of all visits coming from social platforms.
Over the first eight months of the year, its share rose from 7.84% in January to a peak of 9.08% in March, then declined through the summer to 6.85% in August.
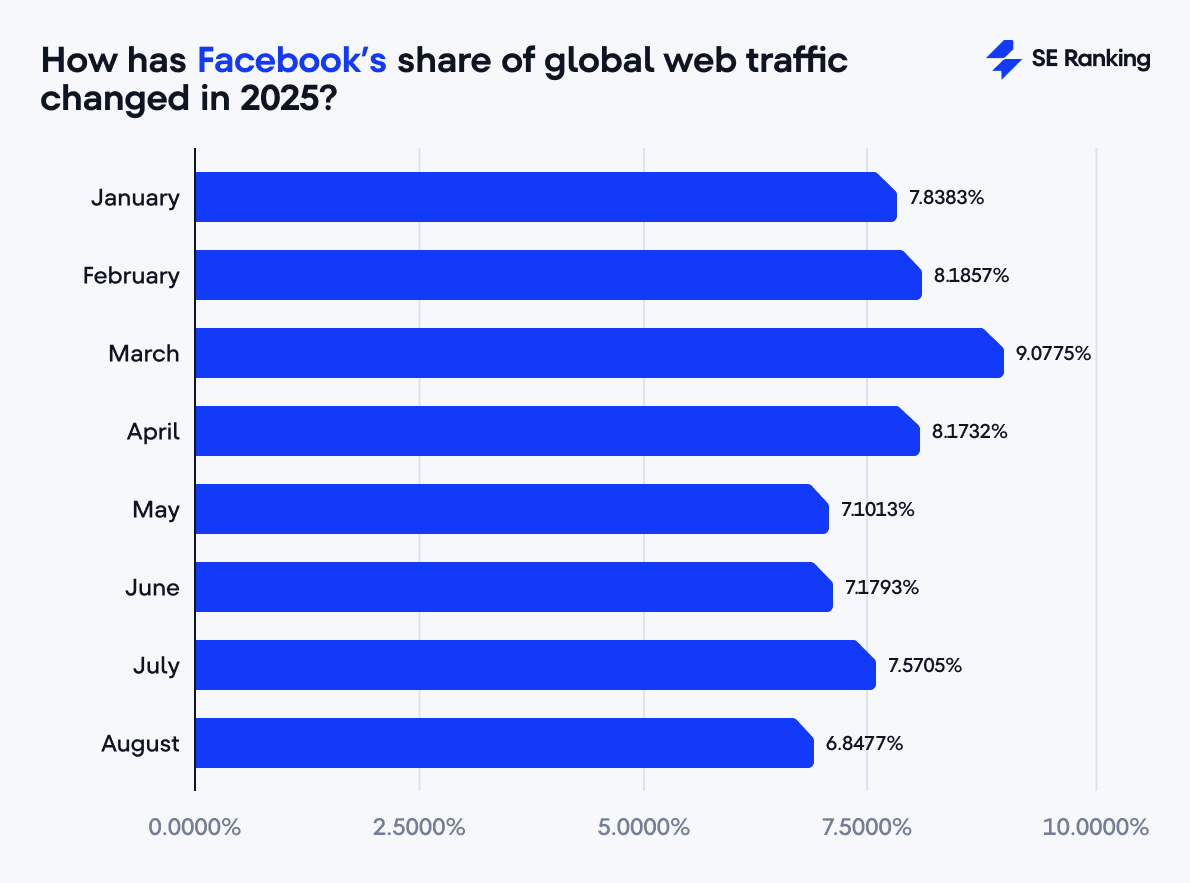
Even with this swing, it remains the single most dependable social source at scale.
Instagram ranks second, generating 0.68% of global traffic (6.76% of social referrals). The platform’s share steadily slipped over the eight months of 2025, dropping from 0.78% in January to 0.57% in August.
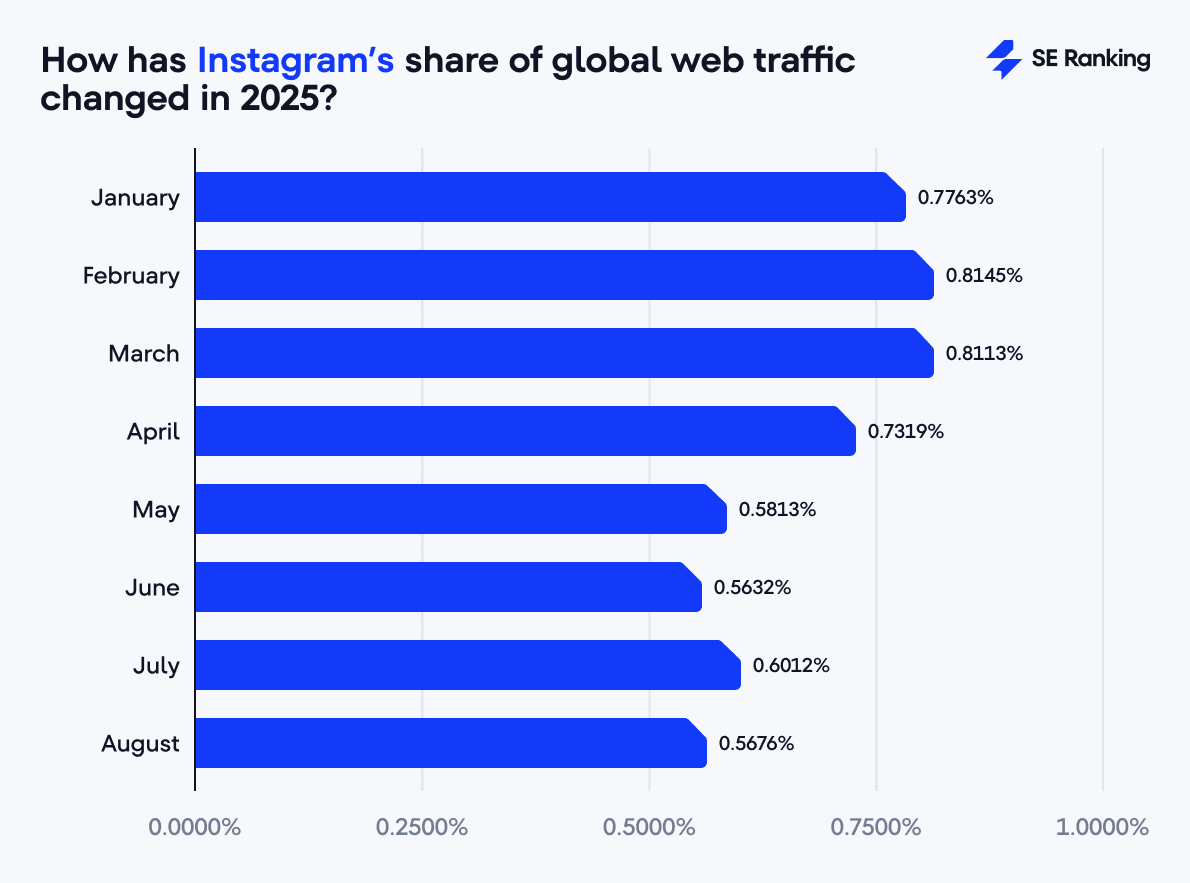
Compared to Facebook, Instagram sends far less traffic, but it remains the second-largest social traffic source worldwide.
TikTok
TikTok is the fastest-growing traffic driver among social platforms in 2025. It accounts for 0.56% of global traffic overall (5.52% of social referrals), but the growth trend is remarkable. From 0.23% in January to 1.09% in August, it had nearly a fivefold increase, with the steepest gains in summer.
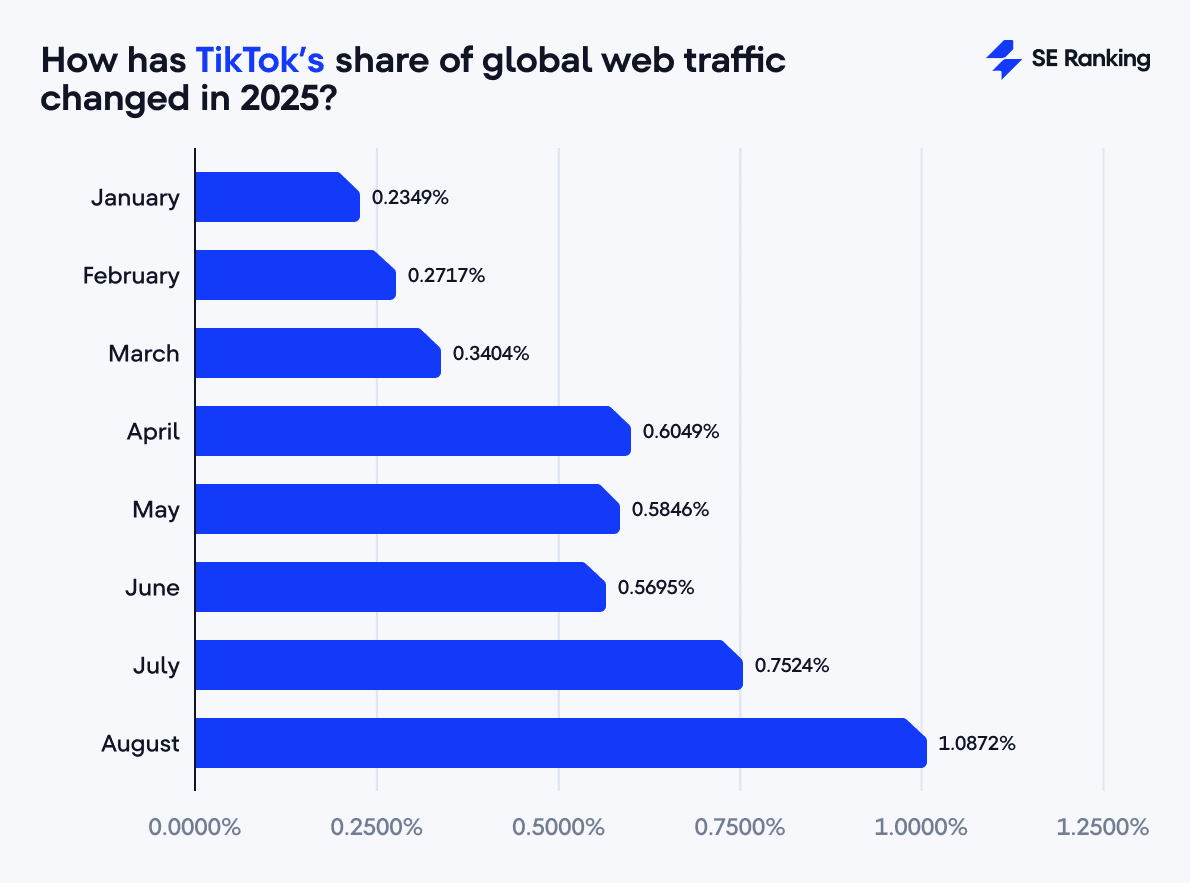
Users aren’t just watching short videos anymore; they’re actively searching for answers, recommendations, and how-to content. This makes TikTok an increasingly important referral channel, especially for brands targeting younger audiences.
LinkedIn holds the fourth position globally, driving 0.30% of total traffic and 2.98% of social referrals. It held steady through spring (~0.33%) and then slipped to 0.22% in August, likely reflecting seasonal trends of lower engagement on this platform during the summer months.
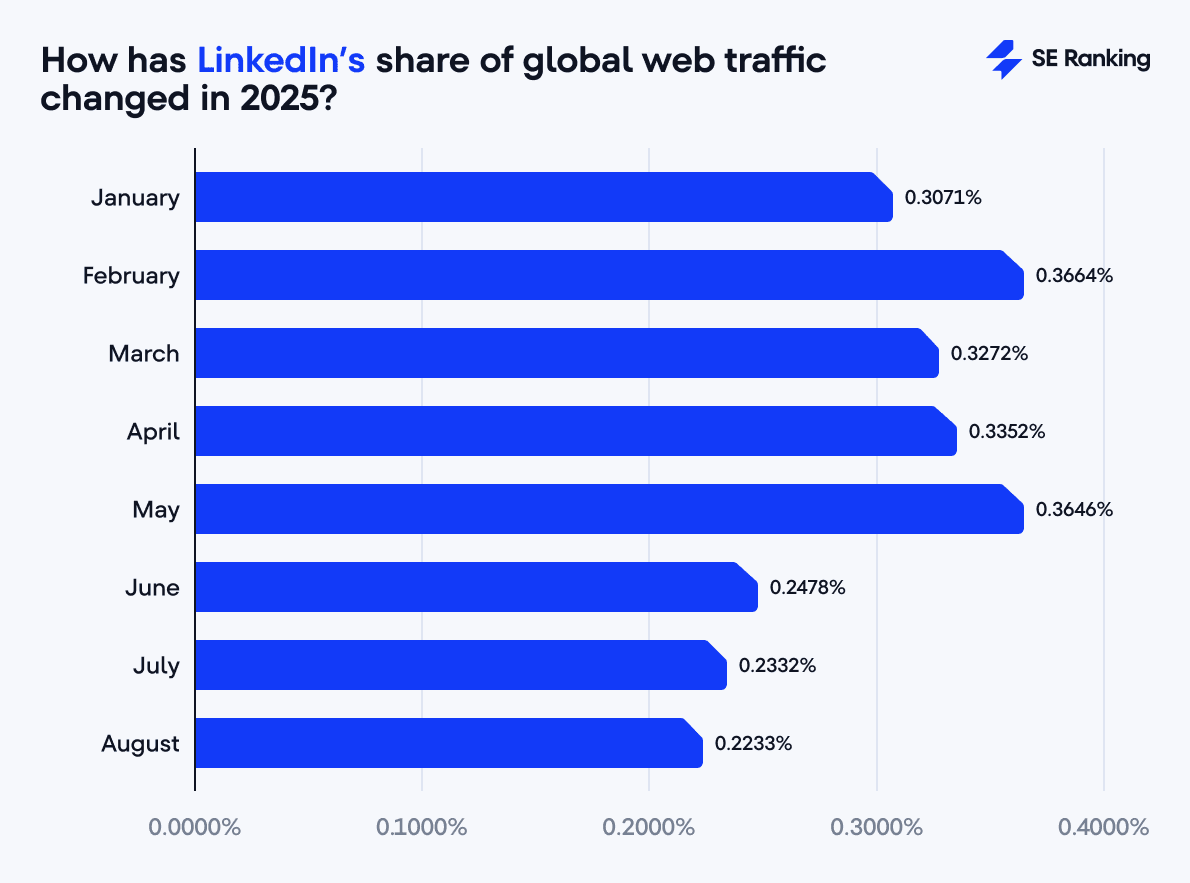
While LinkedIn does not deliver massive traffic volumes, its importance comes from audience quality. The platform’s focus on professional and business content makes it a trusted environment for B2B marketing, thought leadership, and industry-specific visibility.
Pinterest holds fifth with 0.26% of total traffic (2.63% of social). After a flat start (0.33–0.34% through April), Pinterest declined in late spring/summer to 0.16% in August, once again showing clear seasonality.
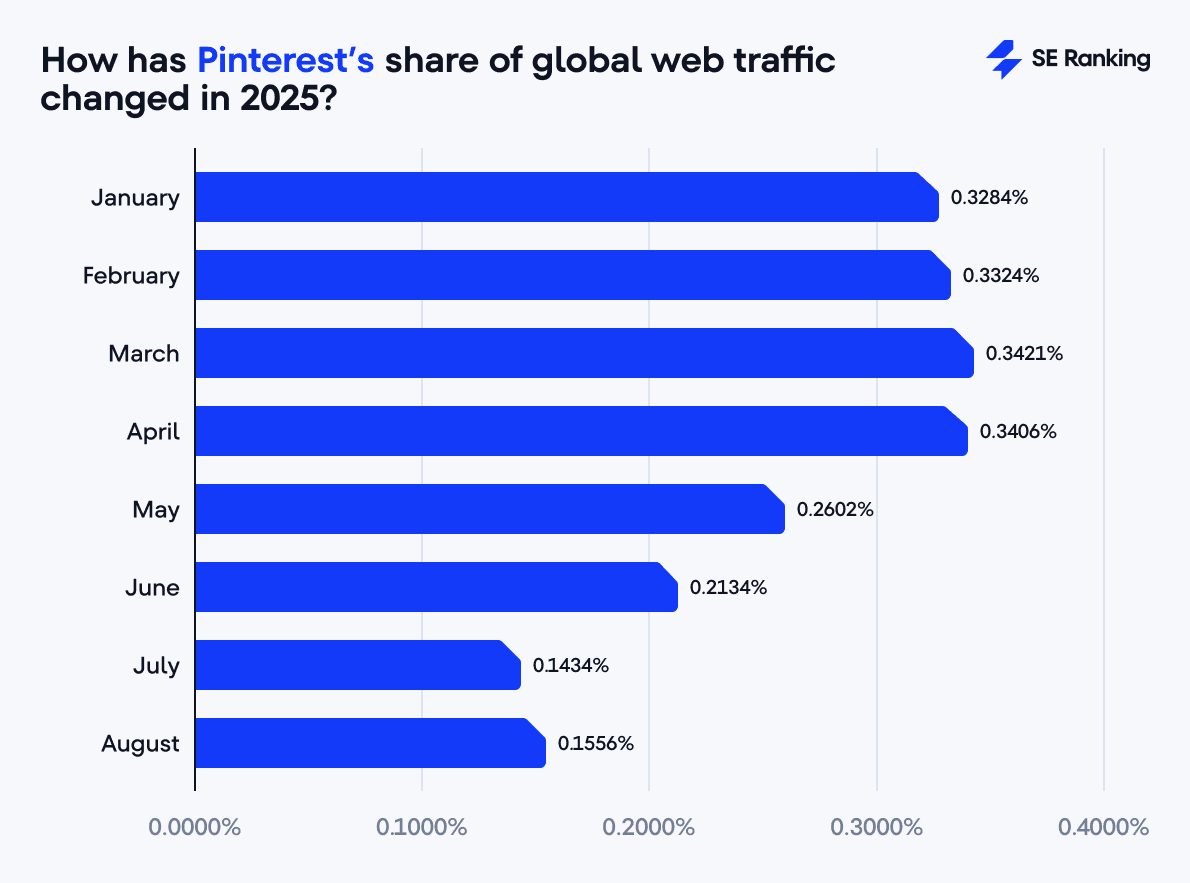
Pinterest is often used by people looking for ideas, whether for products, projects, or general inspiration. The platform may not attract the same scale of traffic as larger networks, but the visits it does generate tend to be shaped by specific goals or interests.
YouTube
To begin with, YouTube plays a major role in both organic search and AI results. It appears on the first page of SERPs for nearly 20% of organic queries, and is the top source featured in AI responses across ChatGPT, Perplexity, and Google’s AI Overviews.
Still, this visibility does not necessarily translate into direct website traffic. In fact, YouTube contributes only 0.19% of total traffic globally, or 1.86% of social referrals. That said, its performance has been improving (rising from 0.14% in January to 0.21% in August, a 50% increase over the period).
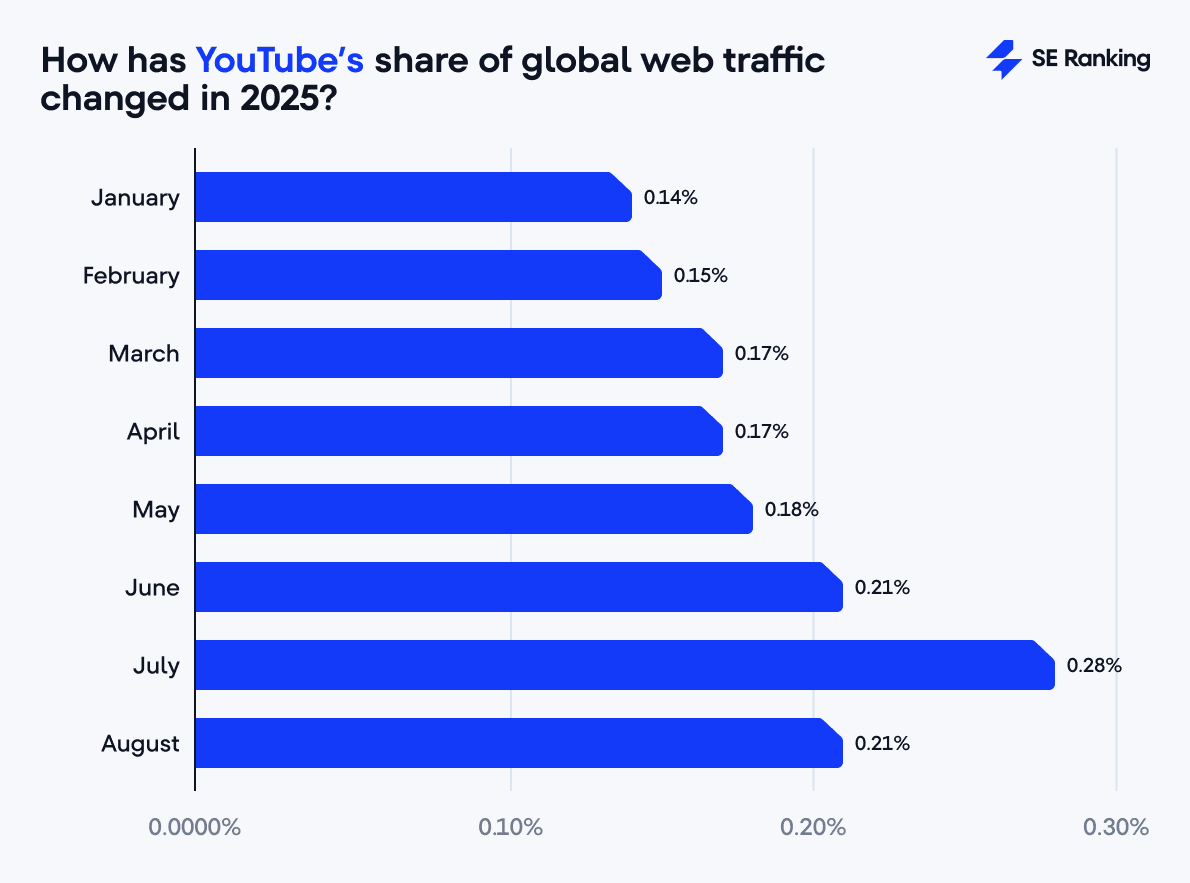
This limited traffic may be explained by how brands and users interact with the platform.
Many companies choose not to invest heavily in YouTube since it demands significant time, creativity, and production resources. At the same time, users tend to stay within the platform rather than clicking through to external websites. As a result, YouTube is far more effective at building brand awareness and credibility than at driving immediate traffic to a site.
X/Twitter
X/Twitter ranks sixth, contributing 0.18% of total traffic worldwide (1.81% of social). Its trendline in 2025 shows some volatility: 0.27% in January, dipping to 0.12% in May, and recovering modestly to 0.17% in August.
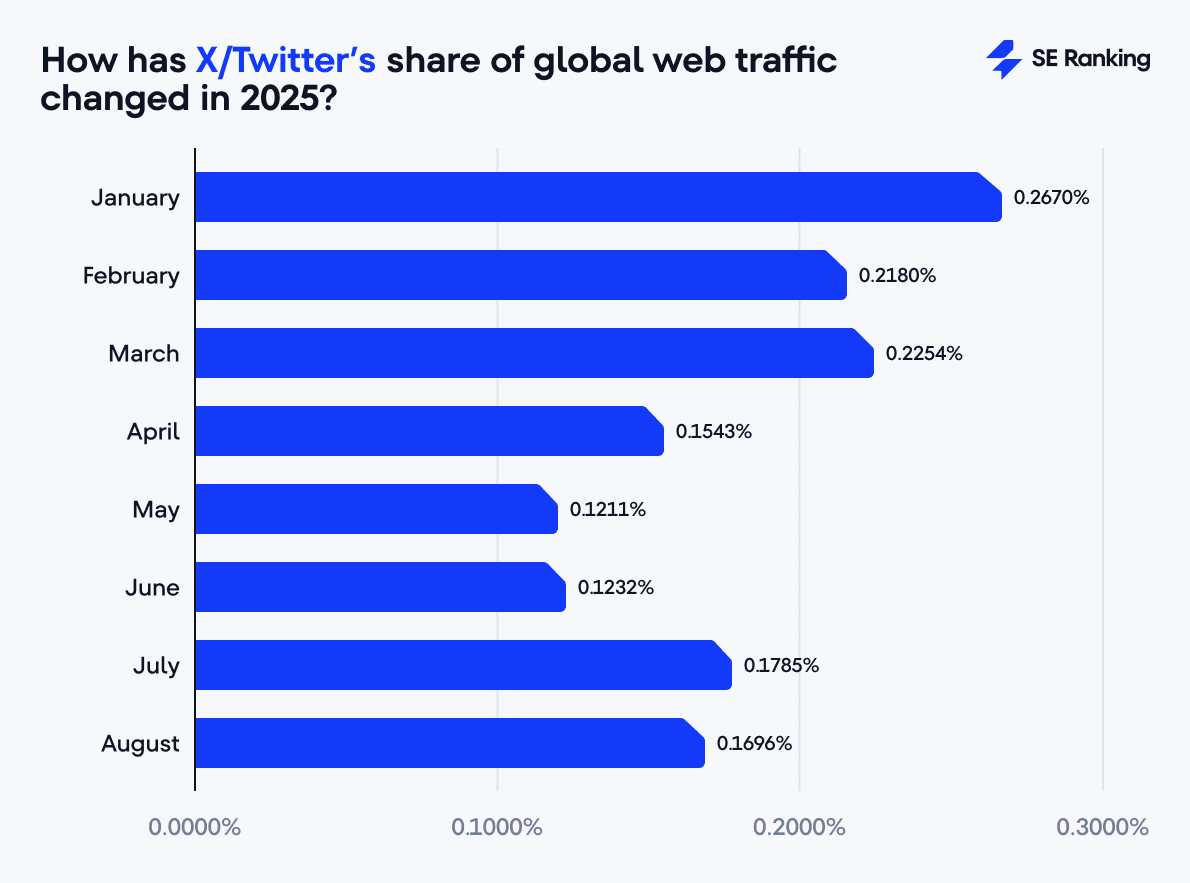
The drop isn’t random. A mix of rebranding, policy shifts, and moderation decisions has weakened X/Twitter’s role as a traffic driver. Add to that Elon Musk’s polarizing management style and political stances, and the platform has seen both users and advertisers pull back. The result is a network that still dominates headlines and conversations but struggles to send people off-platform in the way it once did.
Reddit accounts for 0.139% of total traffic (1.38% of social) and continued its decline through the year from 0.25% in January to 0.09% in August. In other words, the platform lost around a third of its traffic share during our analyzed period.
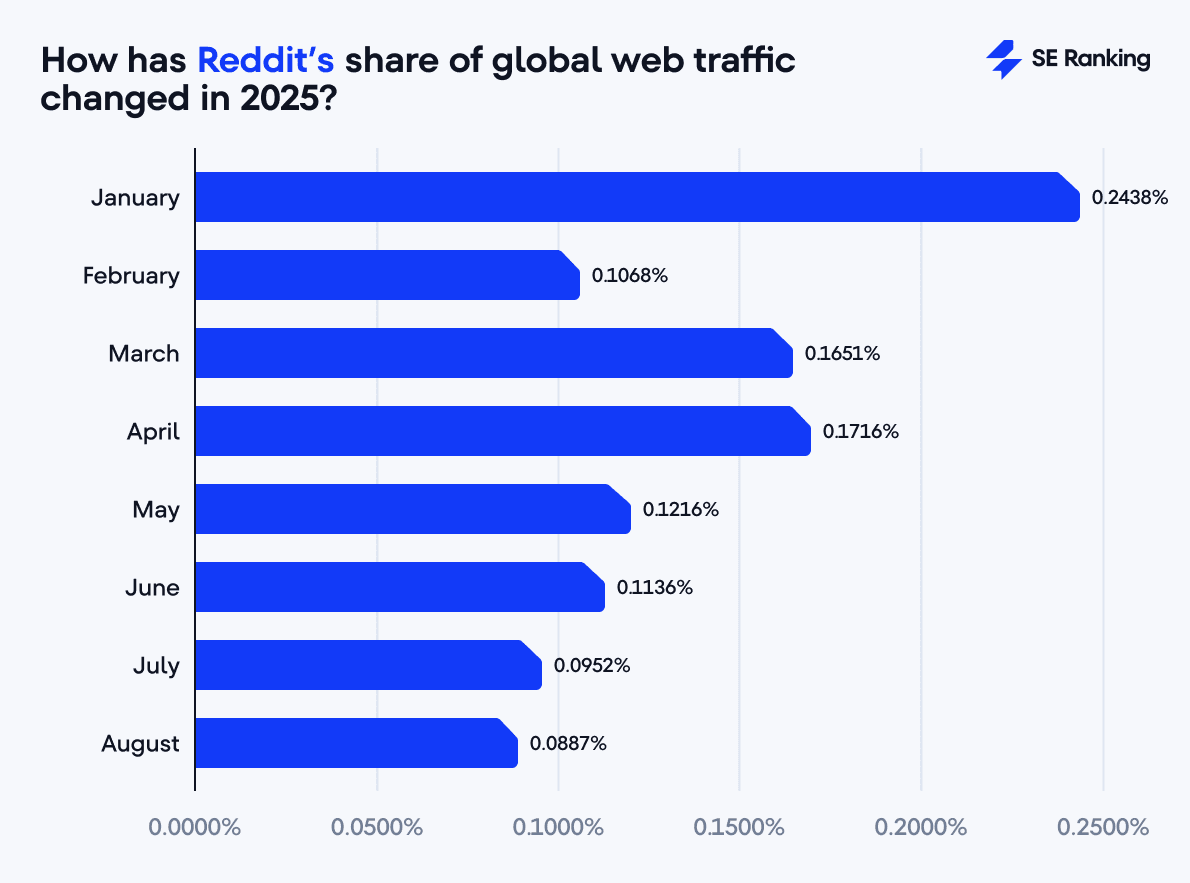
What makes this decline notable is Reddit’s strong visibility in search. Our data shows that Reddit appears in the top-10 results for 37% of the queries, yet this presence doesn’t always translate into clicks. Simply put, Reddit’s discussions fuel search results, but much of the engagement happens without people ever landing on Reddit itself.
Others (Snapchat, Quora, etc.)
Beyond the top eight, the long tail of smaller platforms contributes very little to overall traffic.
Within this group, Snapchat is the notable mover (rising from 0.03% at the beginning of the year to 0.11% in August), which makes it the second-fastest grower after TikTok. Even so, its contribution remains tiny: around 0.48% of social media traffic on average across the period. In turn, Quora’s share of traffic decreased from 0.0064% in January to 0.0011% in August, which is a drop of 83% over those eight months.
Messaging-first platforms (WhatsApp, Telegram, etc.) unsurprisingly stay low due to private sharing.
Regional differences in social media traffic
While the global averages give us a broad view, the picture changes when we zoom into specific regions. Each market has its own balance of organic, social, and AI traffic, and the mix of leading platforms shifts depending on user habits.
Let’s take a closer look at the United States, the European Union, and the United Kingdom.
United States
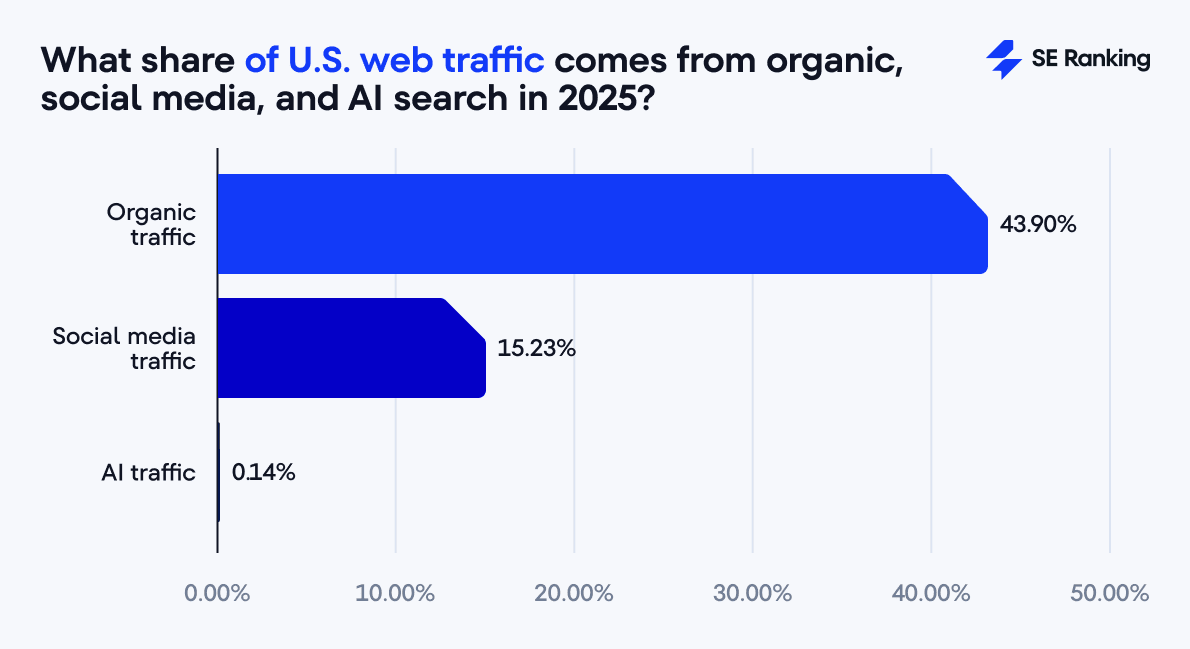
The U.S. is the most socially driven market we studied. Organic search still accounts for almost half of traffic (43.9%), but social platforms make up a striking 15.23% (well above the global average of 10.12%). Put differently: in the U.S., about one in seven website visits now starts on a social feed. That’s a sharp contrast to most other regions.
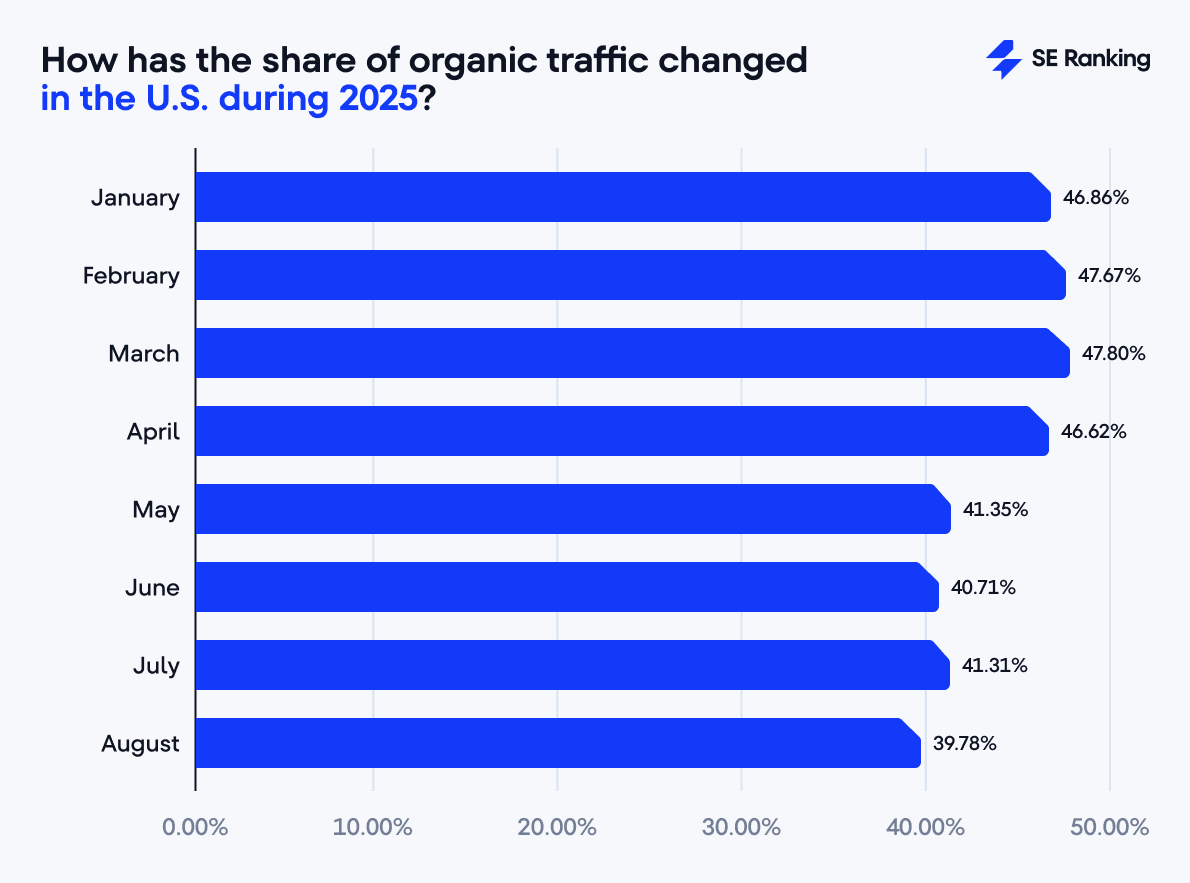
Interestingly, in 2025, organic traffic fell harder here than anywhere else. It declined from 46.86% in January to 39.78% in August (which is a 7% loss), with the sharpest drops observed in the summer months.
Social media traffic, in turn, showed a noticeable growth from 14.24% in January to 16.32% in August 2025. This is an increase of more than two percentage points in just eight months.
Hypothetically, if this growth pace were to continue, social media traffic could expand to 19.3% in one year, 28.5% in three years, and nearly 37.8% in five years. Of course, such projections are purely speculative, as search dynamics are constantly shifting, particularly in the AI era. But they illustrate how even modest, sustained gains in social media can significantly reshape the distribution of traffic sources over time.
By the way, AI traffic (though still small in scale) more than doubled during the same period in the US, rising from 0.08% to 0.17%. It’s a clear reminder of just how quickly things can change.
Now, let’s move on to the most popular social media platforms in the region.
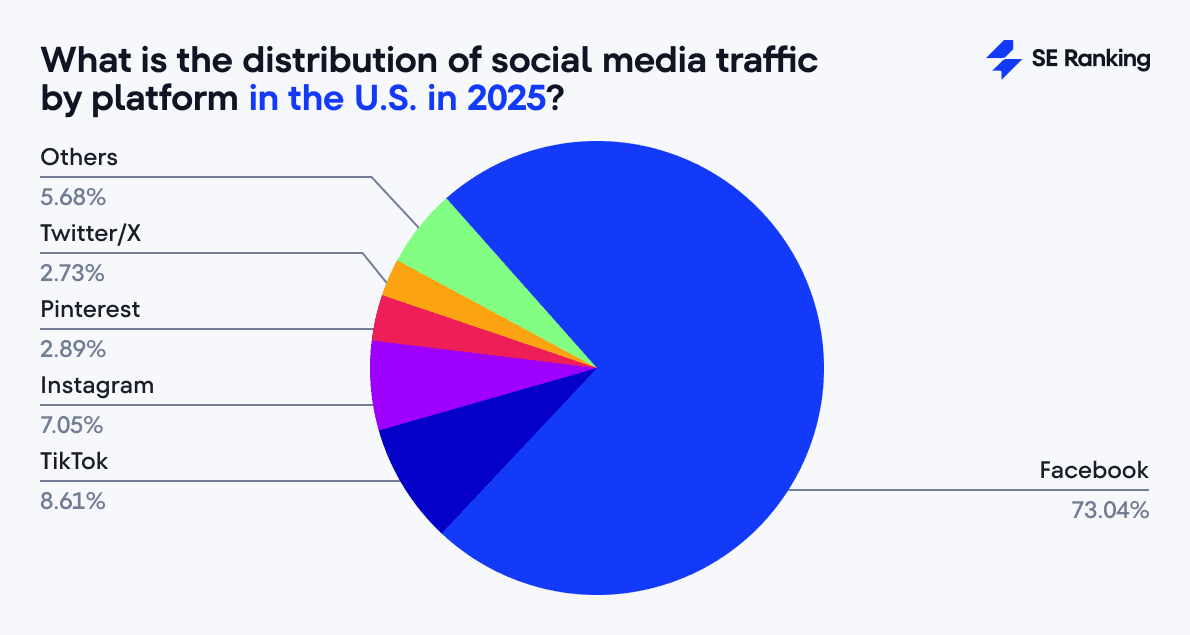
Facebook continues to dominate the U.S. market, capturing 11.12% of total traffic and around more than 73% of all social referrals. Its impact at home is noticeably stronger than worldwide, where it drives just 7.75% of traffic.
TikTok, however, is the breakout story of the year. It now ranks second with 1.31% of total traffic (8.61% of social), which is more than double its global average. The platform’s rise has been nothing short of explosive: from 0.36% in January to over 3% in August (marking an eight-fold increase in just eight months!).
Instagram takes third place with 1.07% of total traffic (and 7.05% of social traffic), outperforming its global share but showing a far less stable path. Pinterest, while smaller, holds a stronger position in the U.S. than globally, with 0.44% of total traffic (compared to 0.26% globally). Yet its trend mirrors Instagram’s decline, sliding from 0.61% in January to 0.29% in August.
European Union
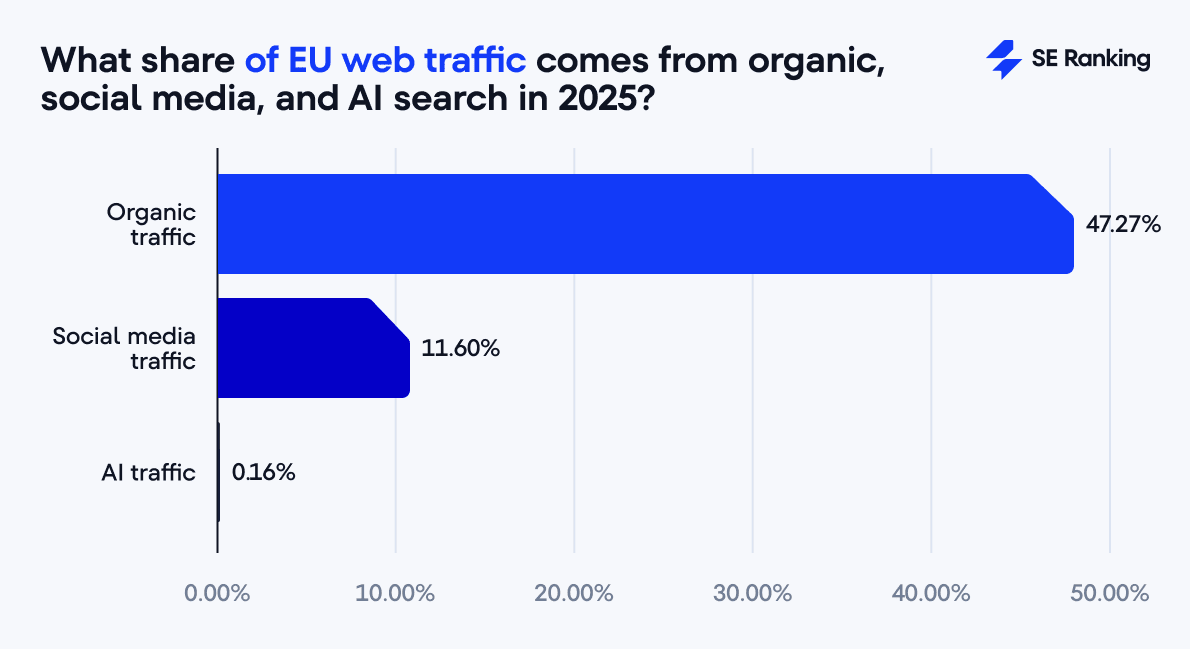
The EU sits closer to the global averages, but with a few important twists. Organic search is slightly stronger here, driving 47.27% of traffic compared to 46.98% worldwide. Social traffic is also higher: 11.60% of all visits now begin on social platforms in the EU.
During 2025, organic search remained relatively stable in the EU, inching up from 46.95% in January to 48.43% in August. Social media traffic, however, swung more dramatically. It climbed to a March peak of 15.22% before sliding to 9.01% by August. It is a sharp decline that highlights the region’s volatility in social engagement.
Meanwhile, AI traffic nearly doubled, rising from 0.10% to 0.19% within the first eight months of the year. This trend outpaces global rates and shows the local audience’s growing reliance on AI-driven search.
Facebook, unsurprisingly, dominates at 9.26% of total traffic and almost 80% of all social referrals (a stronger share than the global average of 76.93%). Still, its trajectory in 2025 has been far from steady. After starting at 10.29% in January and peaking at an impressive 12.43% in March, Facebook’s share tumbled to 7.08% in August. This 5.35% decline highlights the platform’s volatility in Europe, despite its leadership position.
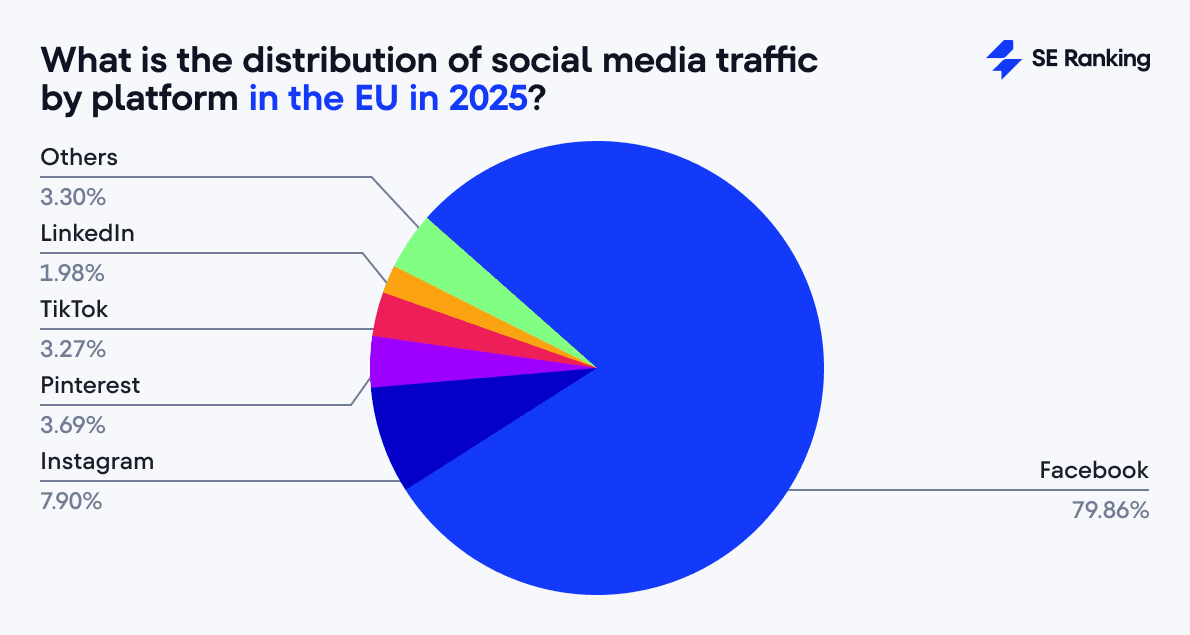
Behind Facebook, the picture is more fragmented. Instagram holds second place with 0.92% of total traffic (7.9% of social), slightly above global benchmarks. Pinterest comes next, outperforming its global share at 0.43% of all traffic (and 3.69% of social media traffic). TikTok ranks fourth, with modest gains (up from 0.31% in January to 0.33% in August). This is far less explosive than in other regions.
Meanwhile, LinkedIn, X, and YouTube remain niche players, together accounting for around 4% of social traffic and showing uneven or declining performance.
United Kingdom
The UK stands apart as the most search-led market in our study. Organic search makes up 53.65% of traffic (well above the global average of 46.98%), while socials contribute only 6.14% of traffic, the smallest share of any region we analyzed. AI referrals are also the lowest, at just 0.10%. This is significantly lower than the global average of 0.18%.
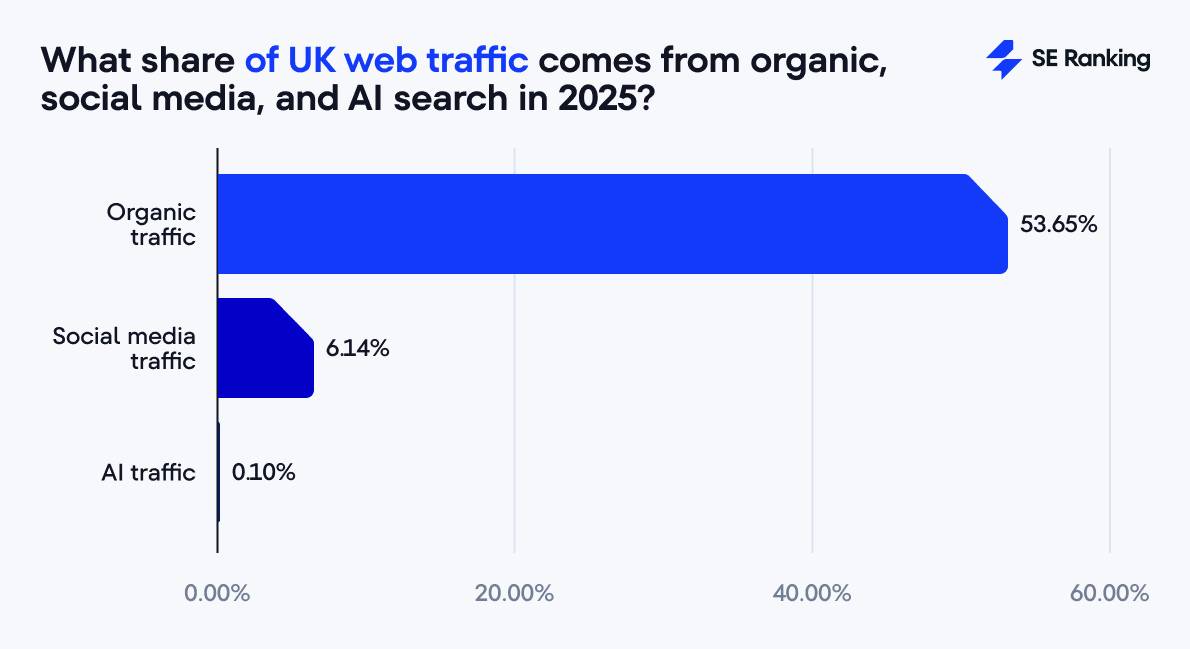
Unlike the sharp shifts seen in other markets, the UK has remained remarkably steady. Organic search held firm in the 53–54% range with barely any fluctuation. Social media, on the other hand, edged downward (slipping from 6.50% to 5.69% over the same period). Meanwhile, AI traffic quietly built momentum, nearly tripling from 0.04% to 0.12%. Though it still lags behind global levels of 0.18%.
Here again, Facebook is the dominant driver, generating 5.46% of total traffic, a figure lower than the global average of 7.75%, but accounting for a massive 89% of all social referrals in the country.
This shows that while Brits rely less on social platforms overall, Facebook’s grip is even stronger here than elsewhere. Its performance followed a familiar seasonal pattern: a slight rise from 5.32% in January to 5.71% in February, followed by a steady decline through the summer, ending at 5.04% in August.
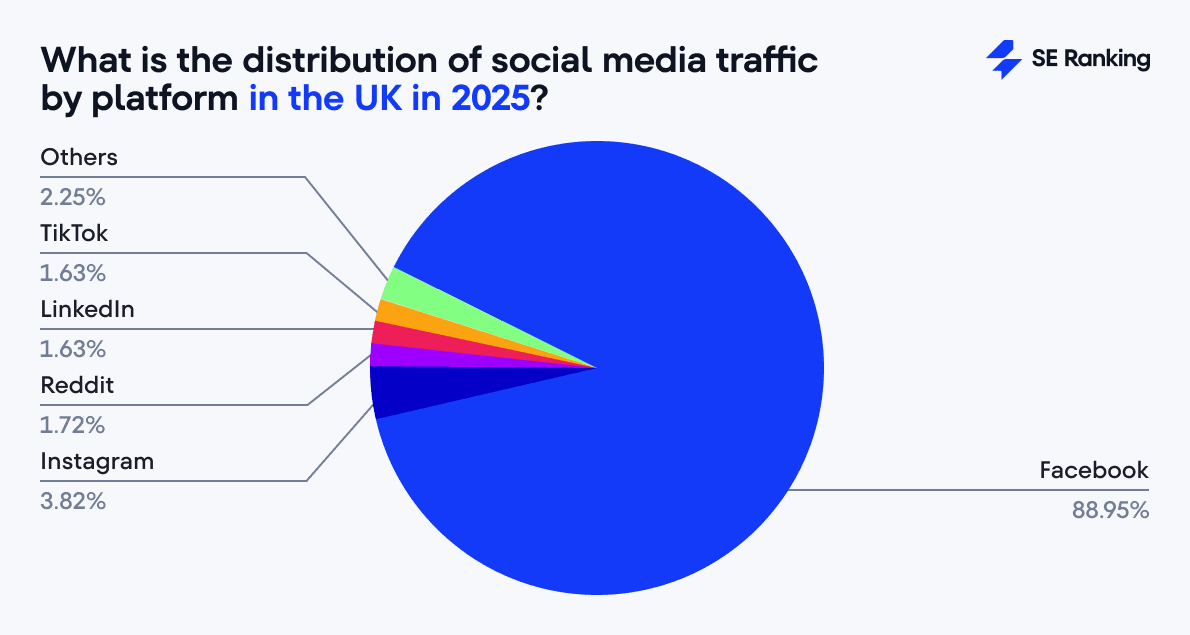
The next most significant contributors are Instagram (3.82%), Reddit (1.72%), LinkedIn (1.63%), and TikTok (1.63%), each playing a much smaller role. Platforms like Pinterest (0.93%), YouTube (0.55%), X/Twitter (0.50%), and Snapchat (0.20%) contribute marginally.
SE Ranking + Planable: Where SEO, social media, and AI work together
Our research proves it: SEO, social, and AI are no longer running on parallel tracks. They overlap everywhere. A Google query, a TikTok swipe, and an AI answer can all lead to the same place, your brand.
That’s why we acquired Planable. Because the future of marketing isn’t about picking one channel over another; it’s about connecting them. Search visibility boosts social reach. Social conversations shape search demand. AI pulls from both. And brands that connect these dots win.
With Planable joining SE Ranking, we’re building a multiproduct platform where SEO insights, social media workflows, and AI-powered strategies fuel each other. The result is smarter campaigns and better visibility wherever your audience goes to search, scroll, or ask.
The numbers say it best: search has gone multi-channel. With SEO, social, and AI working as one, your strategy can too.
Brief methodology overview
This study is based on a dataset covering 63,987 websites across a global sample of 250 countries between January and August 2025. The dataset includes major regions such as the United States, the European Union (EU), and the United Kingdom (UK), as well as a wide global distribution spanning North America, South America, Europe, Africa, Asia, and Oceania.
All websites included in this analysis use Google Analytics in accordance with SE Ranking’s Terms of Service. The study relies exclusively on aggregated, anonymized data, ensuring that no individual site or user is identifiable. Findings are based on historical records and represent observed trends and patterns within the selected sample.
Within this research study, traffic sources are categorized into three main channels:
- Organic search (traditional search engines such as Google, Bing, and others)
- Social media platforms (including Facebook, Instagram, TikTok, Pinterest, LinkedIn, X/Twitter, Reddit, YouTube, Snapchat, Quora, Discord, Medium, Tumblr, Twitch, WhatsApp, Telegram, Viber)
- AI platforms (ChatGPT, Perplexity, Gemini, Deepseek, and Claude).
The analysis was conducted at both global and regional levels to identify platform-specific trends and broader shifts in referral traffic. All traffic shares are expressed as a percentage of total website visits within the defined time period.
Disclaimer: While we strive to present objective interpretations of the data, alternative perspectives and analyses may also be valid.
Conclusion
Organic search still drives the most traffic, but its grip is loosening as social platforms grow into a strong alternative and AI enters the mix.
Visibility now depends on showing up everywhere people search: on engines, feeds, and AI assistants. And brands that capture audiences across all three channels will be the ones that succeed most.

