AI Overviews Research: How Google’s AI answers vary across five states in the US
AI Overviews are evolving, and so is how they present and cite information. Since our last AIO recap in 2024, Google has been actively experimenting by tweaking formats, adjusting layouts, adding internal links within summaries, and more. With AIOs appearing more frequently in SERPs, we took the opportunity to investigate deeper.
This round of research focuses on AI Overview citation patterns across five states in the US: Colorado (Denver), New York (New York), California (Los Angeles), Texas (Houston), and Washington, DC. We explored how AI-generated summaries vary by region and what it will mean for website visibility and SEO strategies moving forward.
Central to this research was our AI Results Tracker, which gathered regional insights. You can also use this tool to keep track of AIO-related content (and in real time). Beyond tracking sources featured in AI-generated answers, this tool can monitor keywords for their AIO presence, competitive dynamics, and regional differences across countries like the US, UK, Canada, Australia, Japan, South Korea, and New Zealand (more to come soon). You can also access AIO SERP feature detection directly in our Keyword and Competitive Research Tools. The SE Ranking platform is also free for 14 days.
Now, let’s break down what we discovered through our research and how it can impact your SEO strategy.
-
About 30% of all queries trigger AI Overviews across all regions (27.75%-28.66%).
-
Across all metrics analyzed, regional variation in AI Overviews across each of the five states is limited. Google takes local relevance into account for the sources cited, which depend more on the type of query or the complexity of the topic than on geographic location. Still, for more local queries, we do see some state-level differences, with certain domains appearing exclusively in specific states.
-
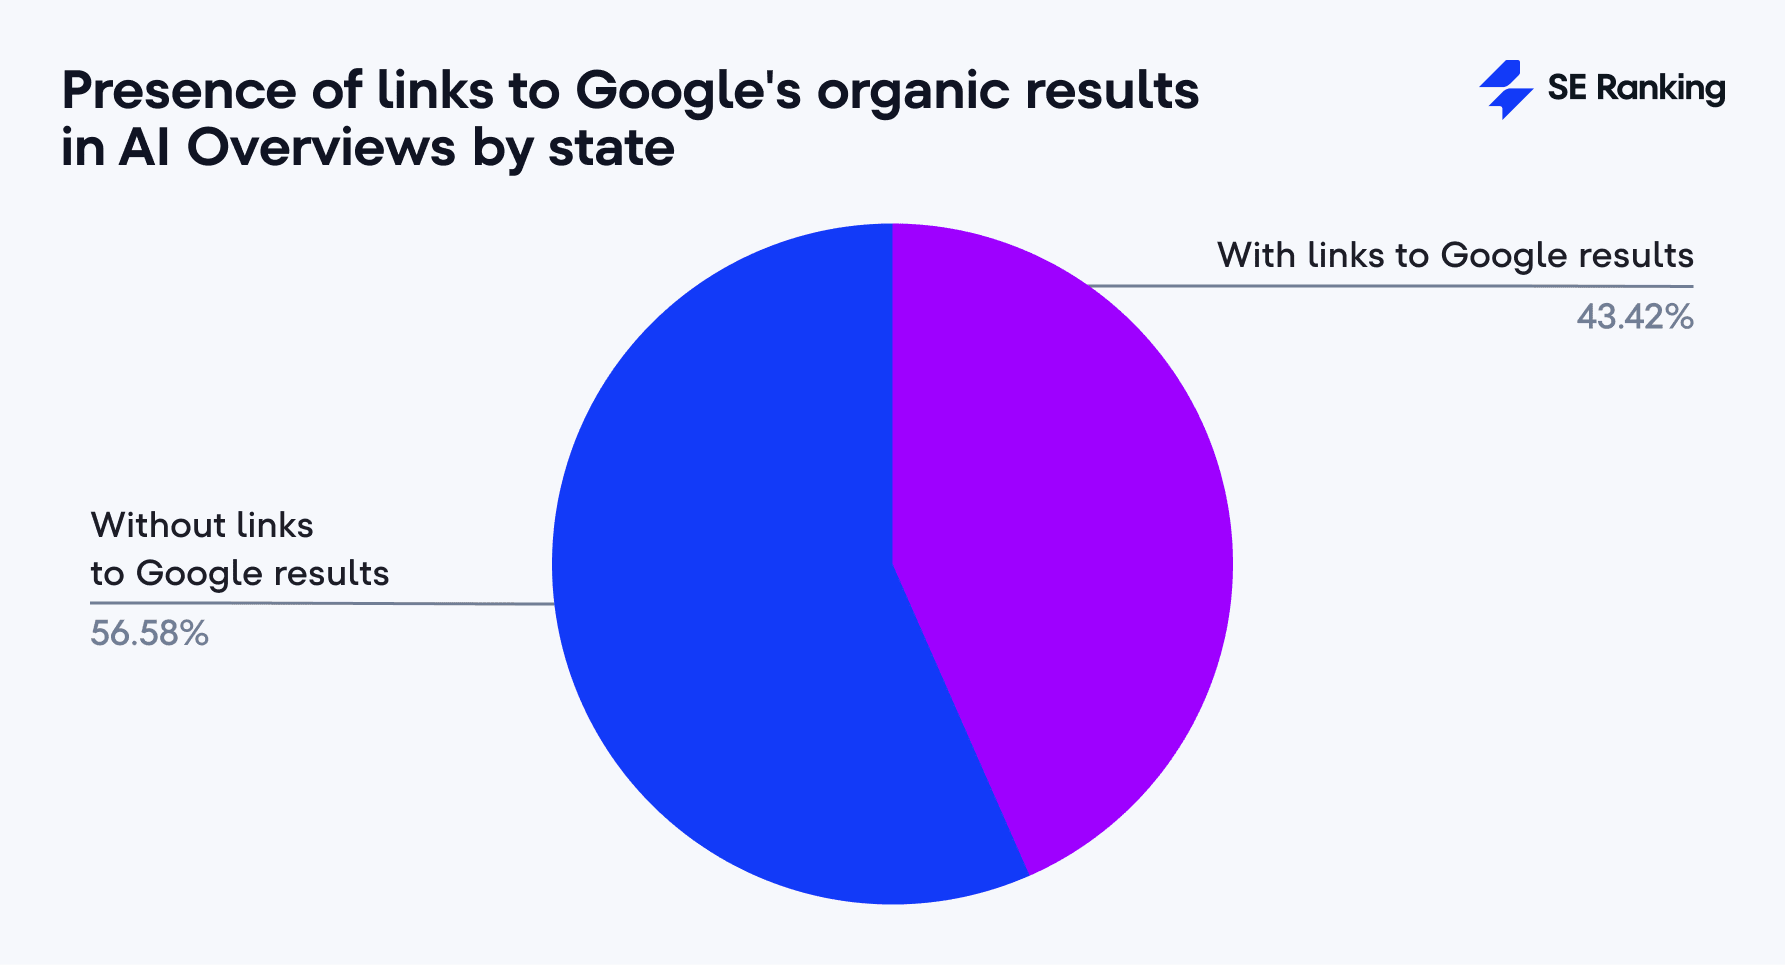
Based on the combined data from all five states, 43.42% of AI Overview responses contain links to Google’s organic search results. On average, these responses feature between 4 and 6 links.
-
The Relationships niche triggered AI Overviews the most (60.54%-62.38%). It was followed by Business (56.38%-57.52%), Education (48.70%-51.86%), and Food and Beverage (45.62%-47.66%). At the other end of the spectrum, Fashion and Beauty had the lowest appearance rate (1.34%-1.46%), with e-Commerce (2.14%-2.48%) and News and Politics (3.76%-4.50%) also showing minimal AI Overview presence.
-
AI Overviews cite 13.34 sources on average, with minimal state differences (13.28-13.41).
-
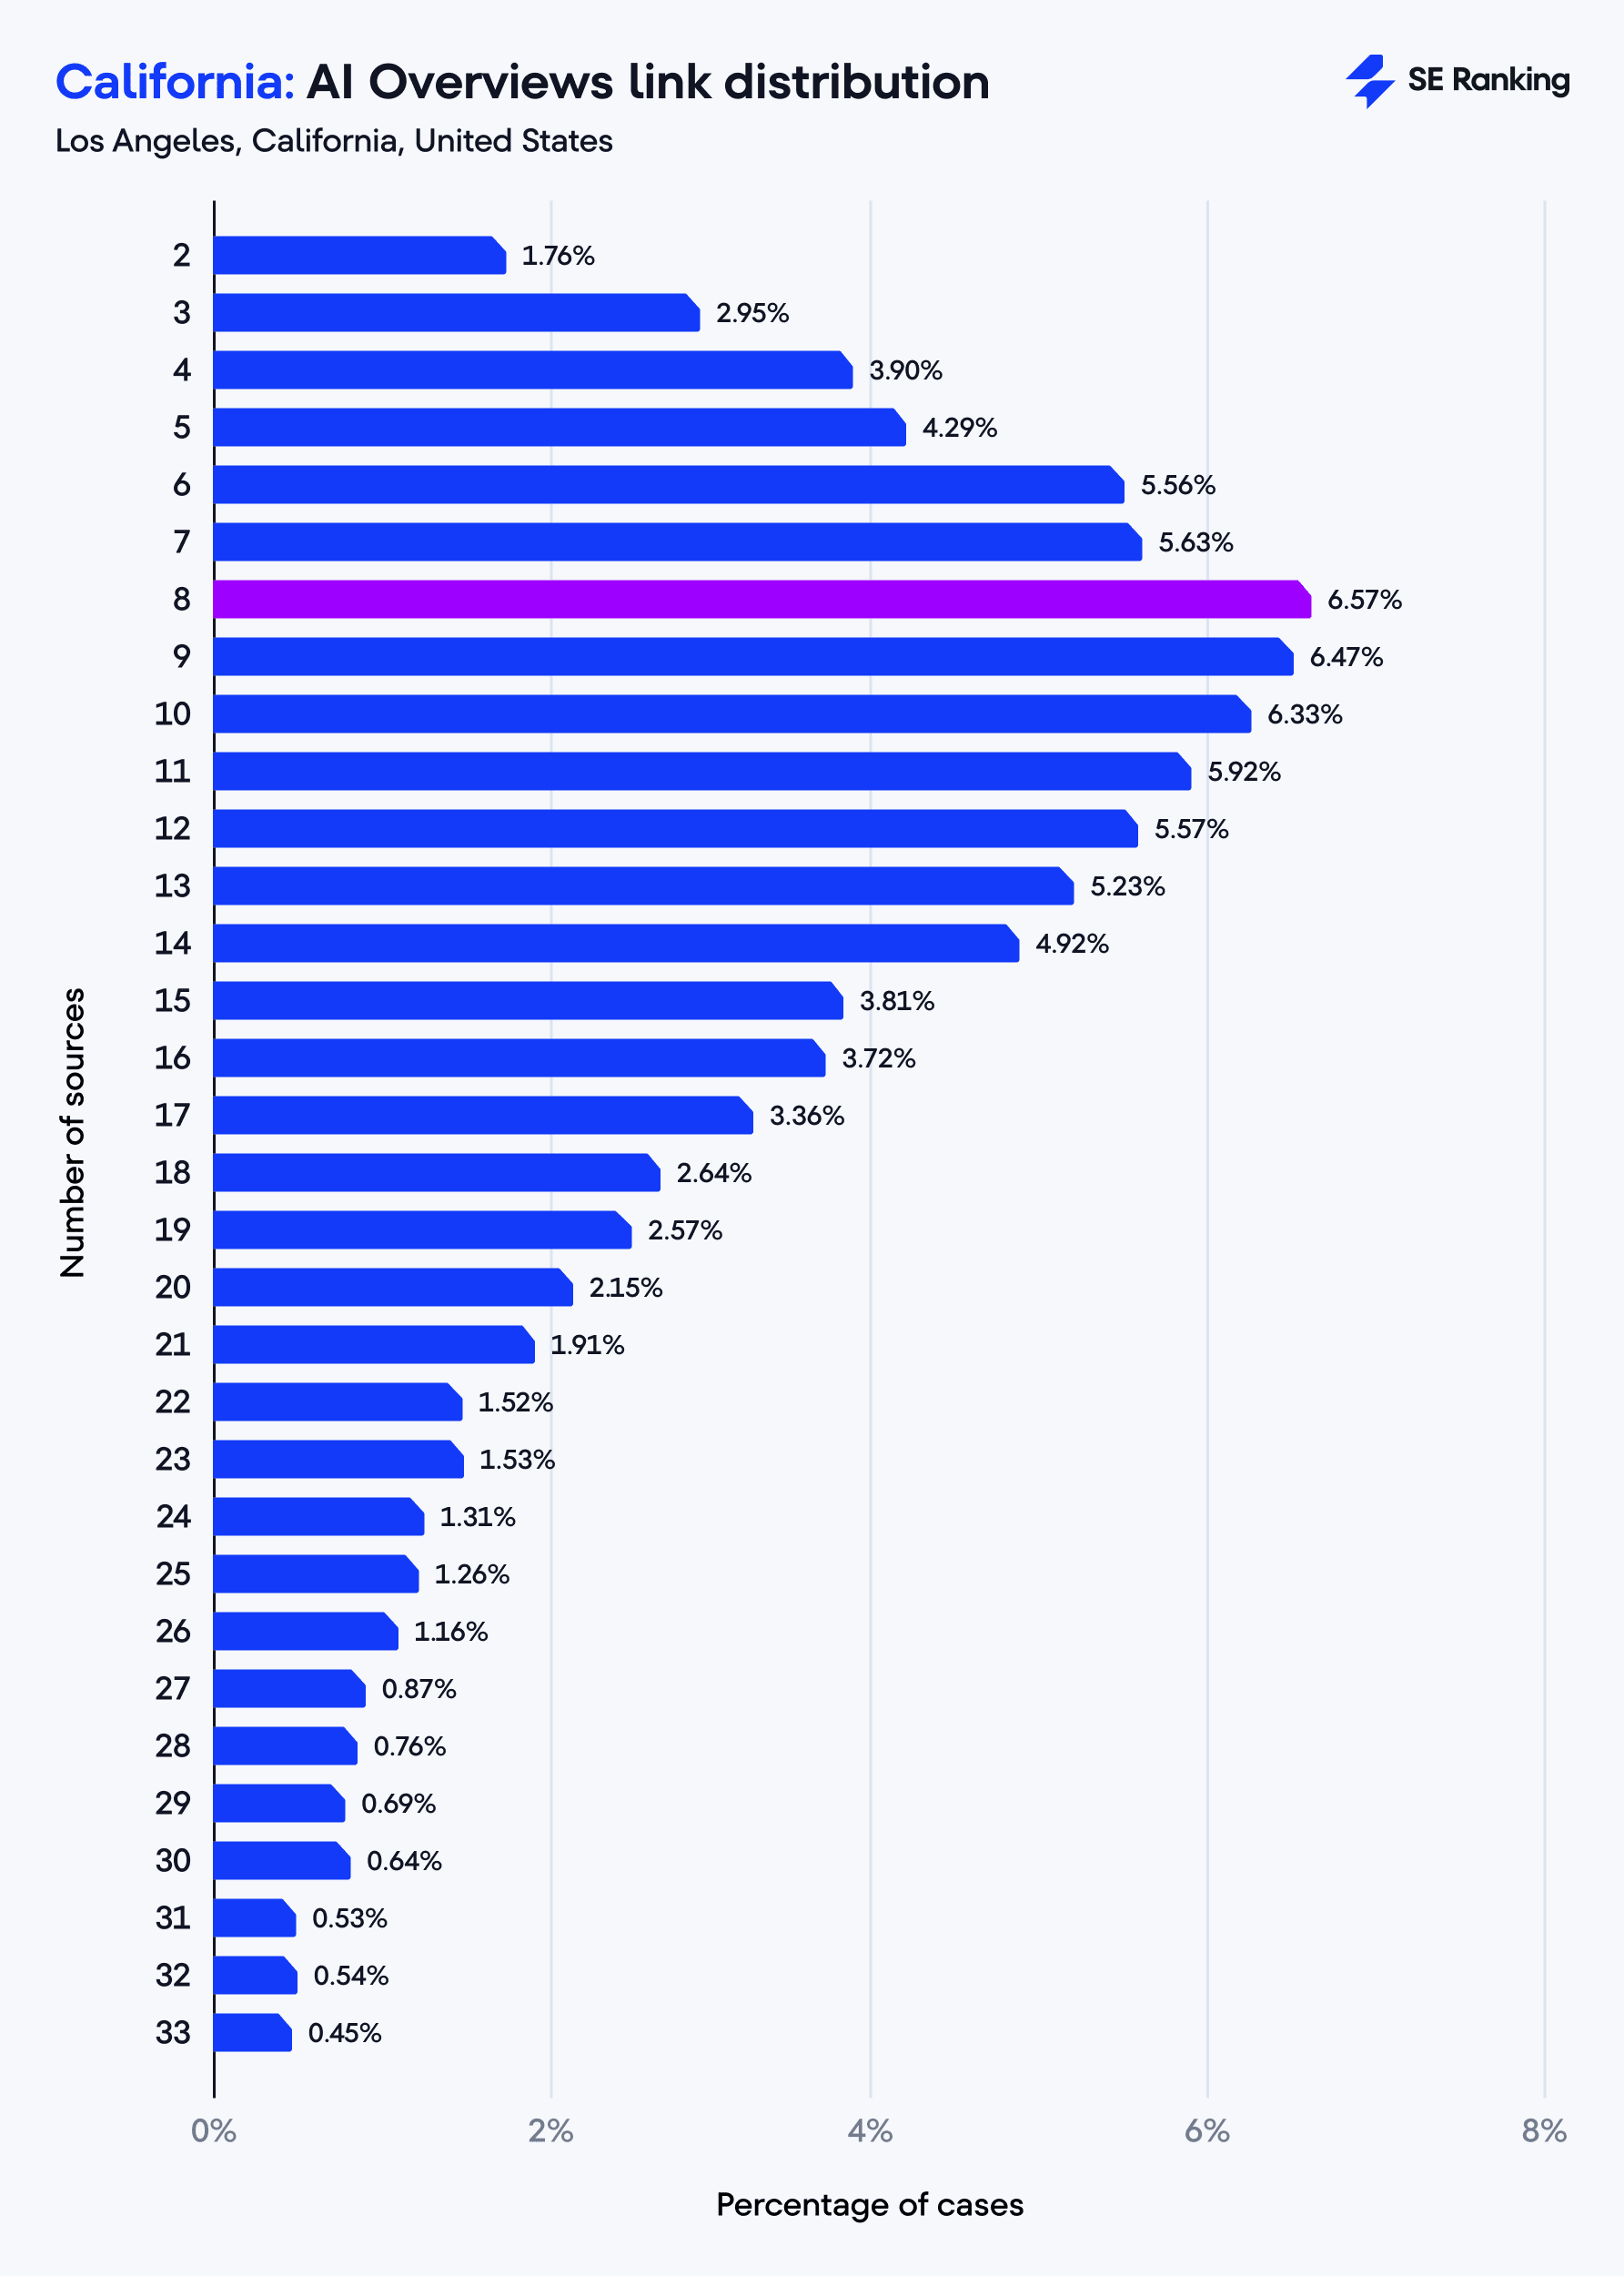
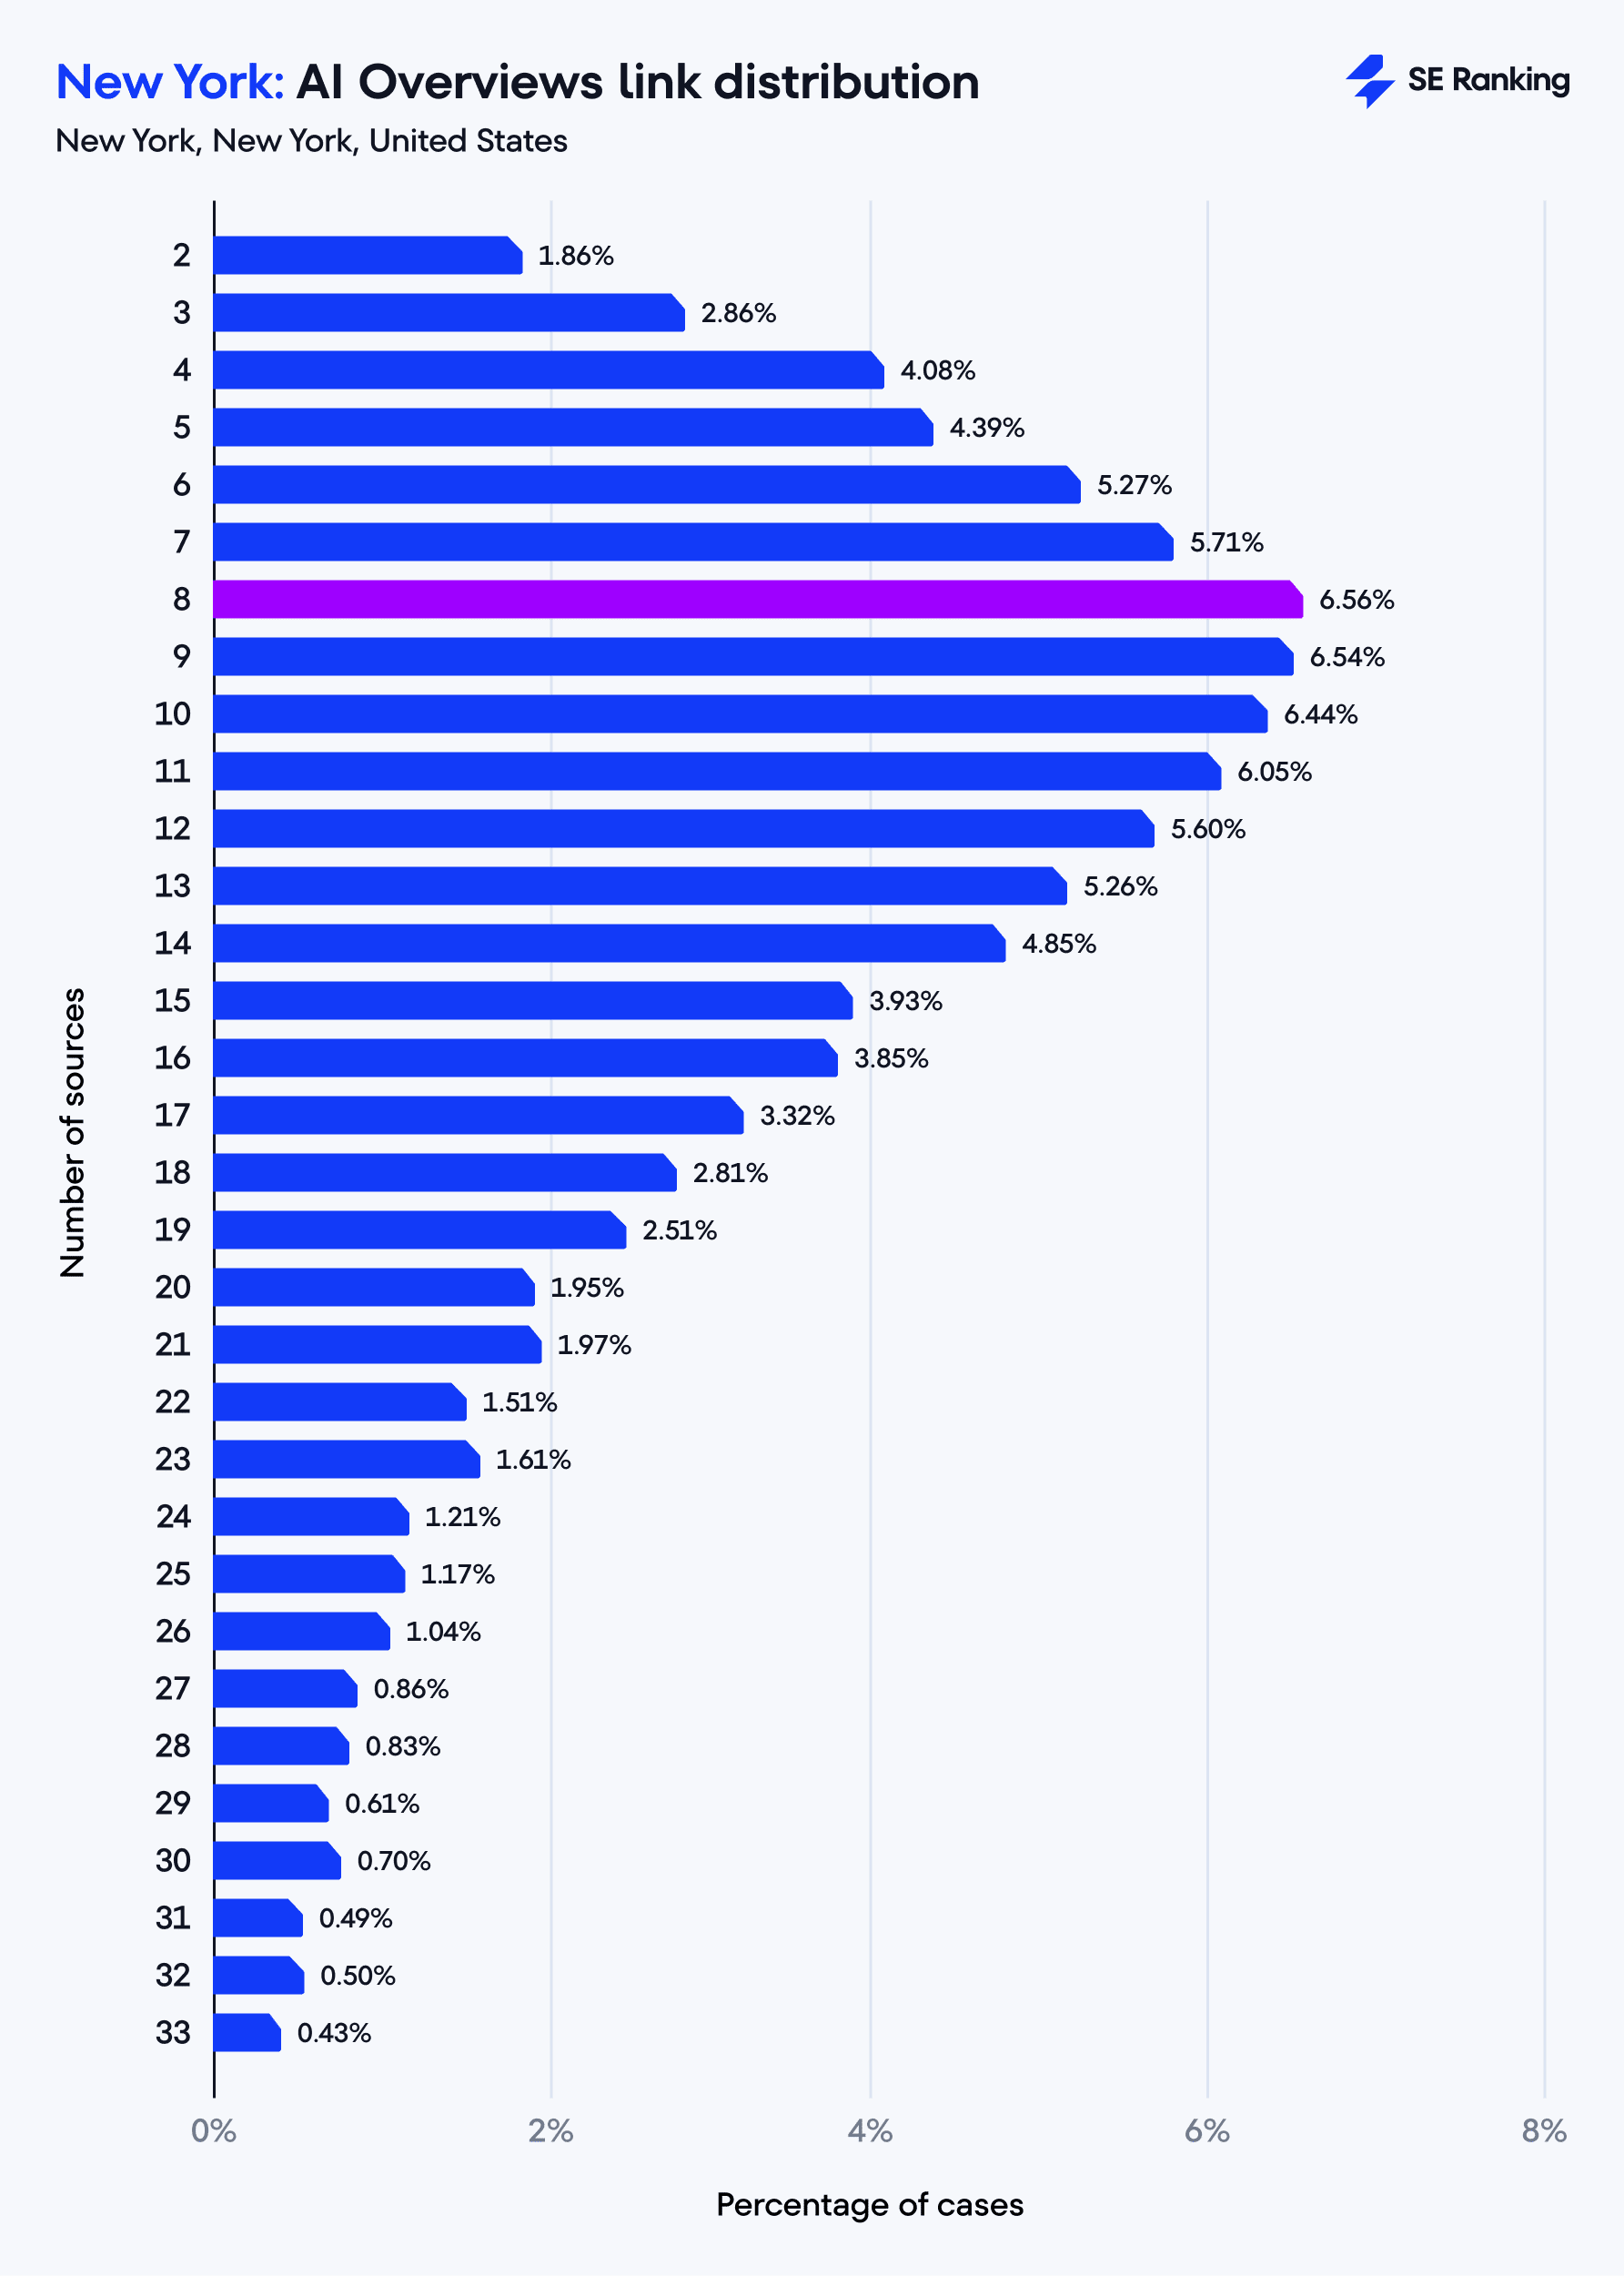
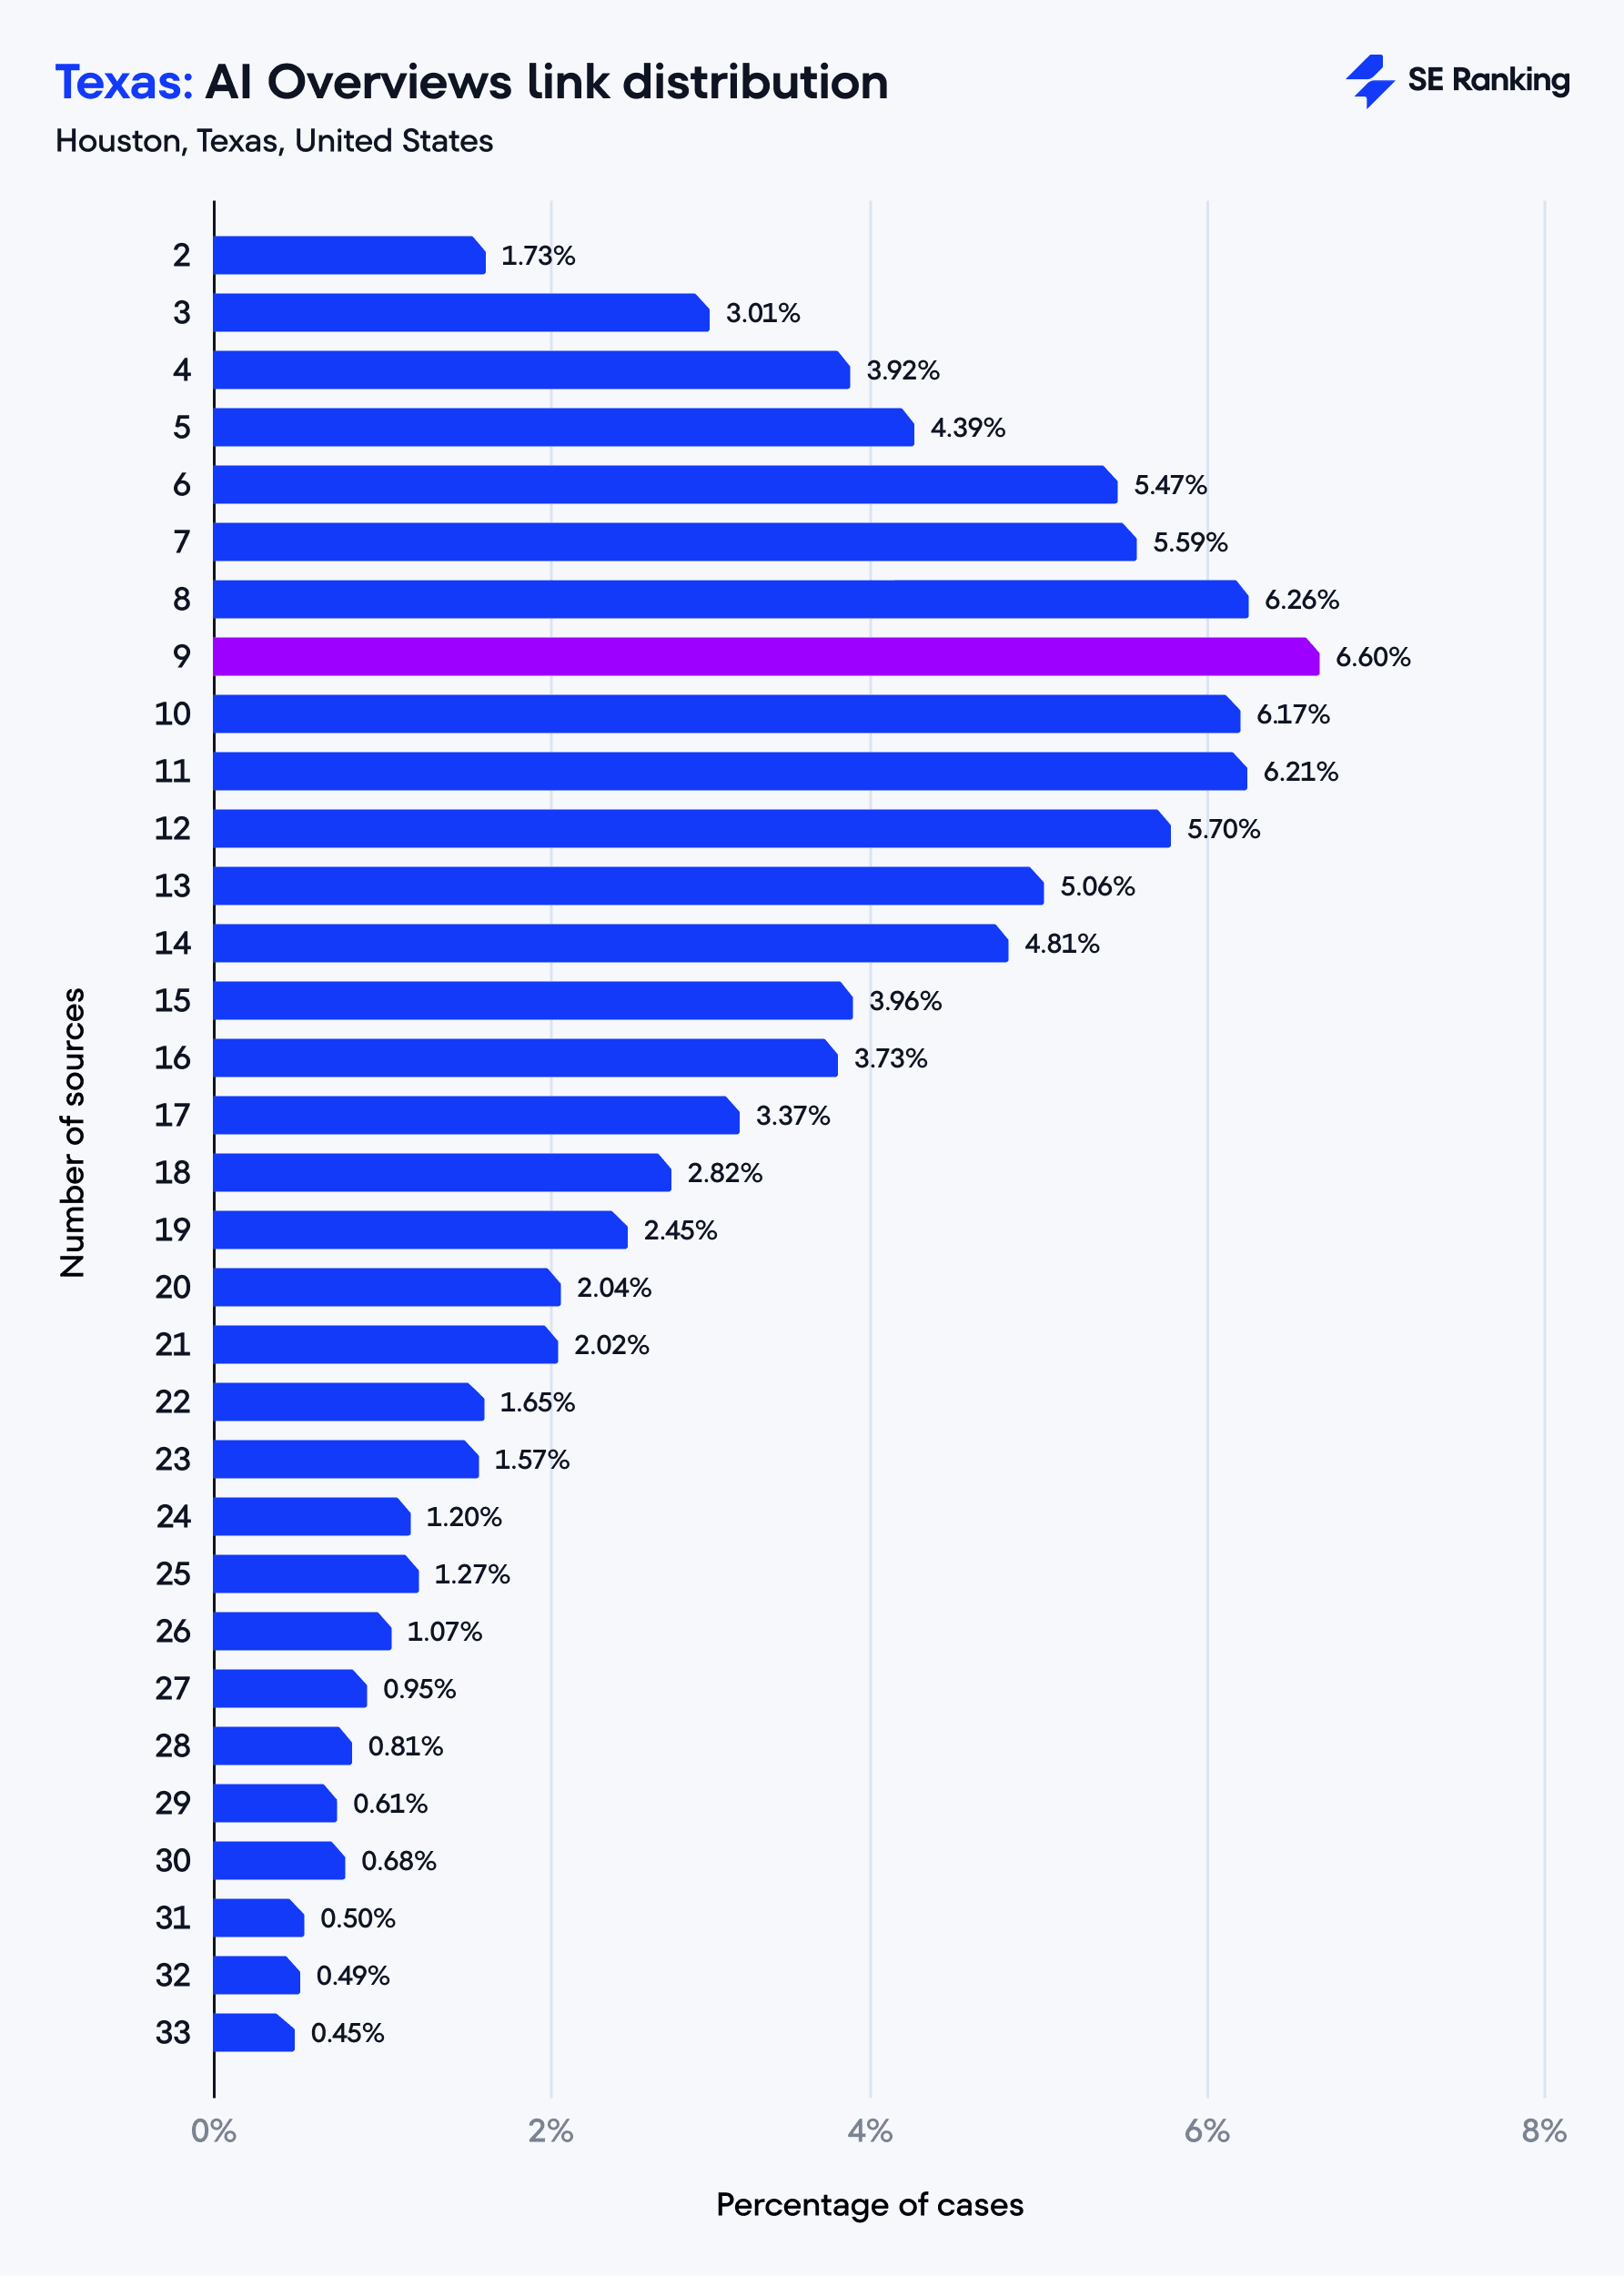
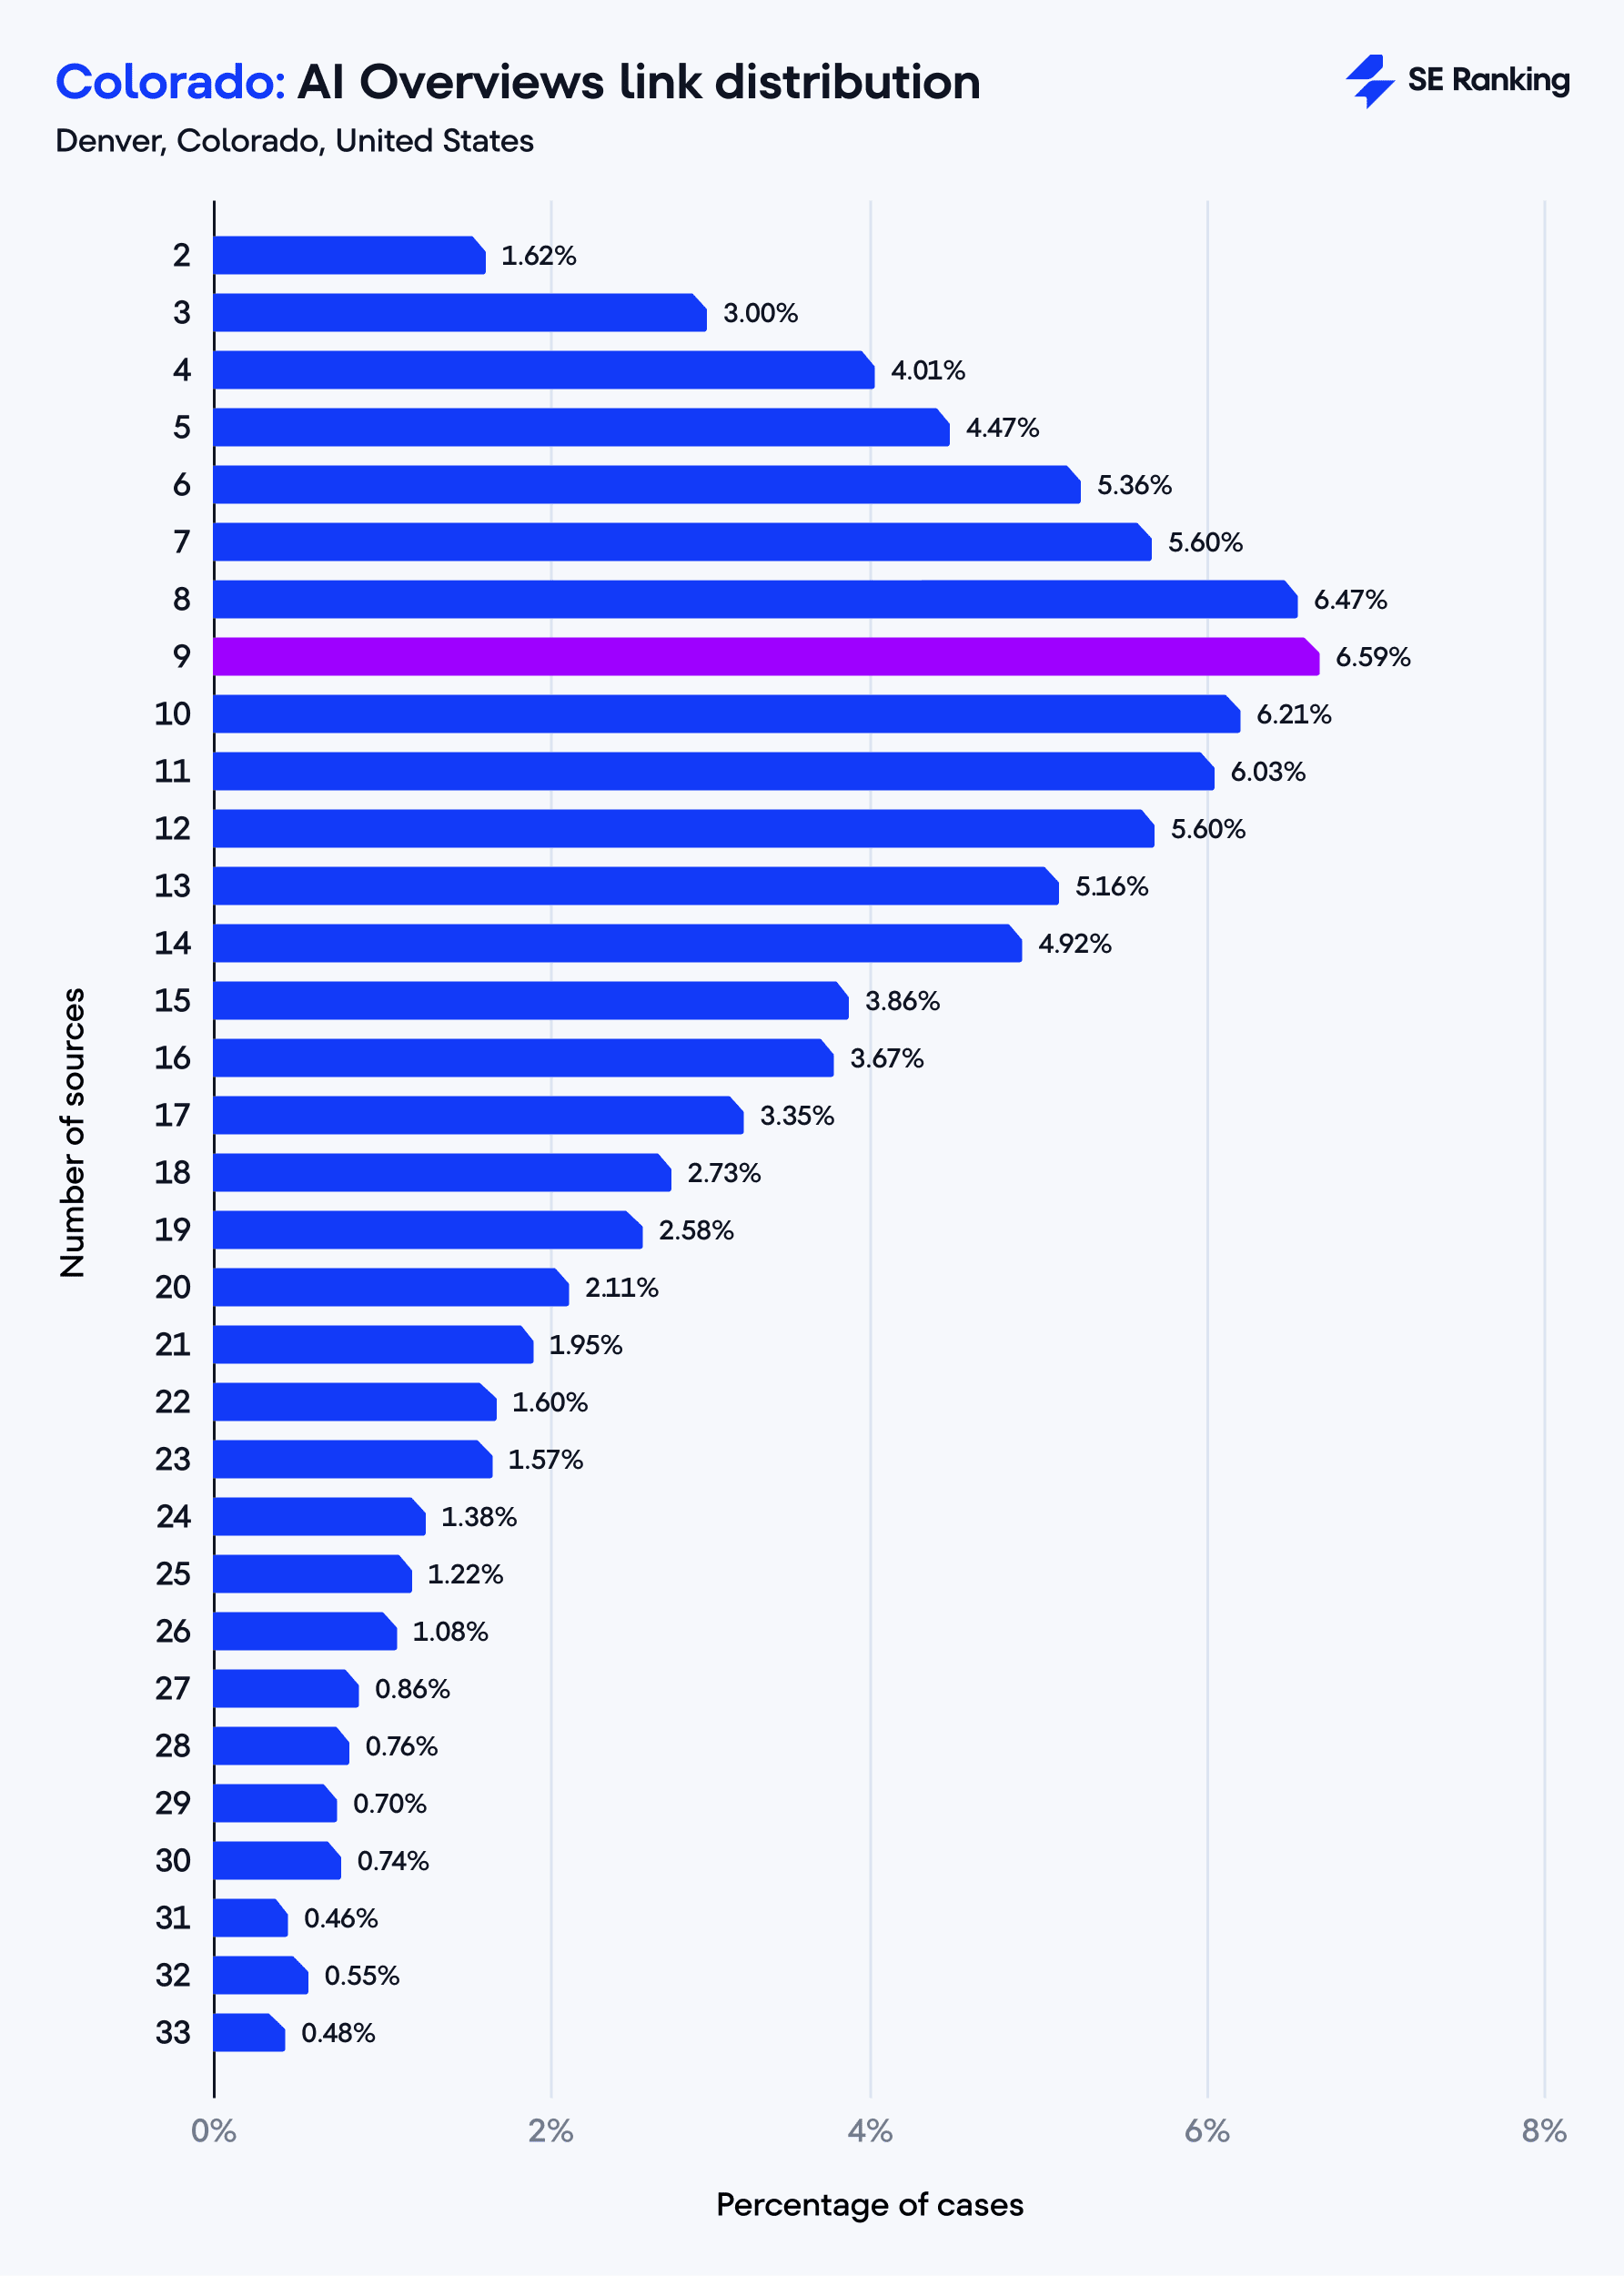
Based on the overall data across states, AIO responses with 6-14 links are most common. As for the state-by-state overview, in California and New York, 8-link responses are most common (6.57%–6.56%). Texas and Colorado tend to show 9-link responses (6.59%–6.60%). Washington, D.C. breaks the trend, showing higher counts for both 6 (5.64%) and 12 (5.84%) links.
-
Across all five states, the average AI Overview response is about 1,766 characters long and contains roughly 254 words. The difference between states is minimal: 12.6 characters and 2.38 words (less than 1%).
-
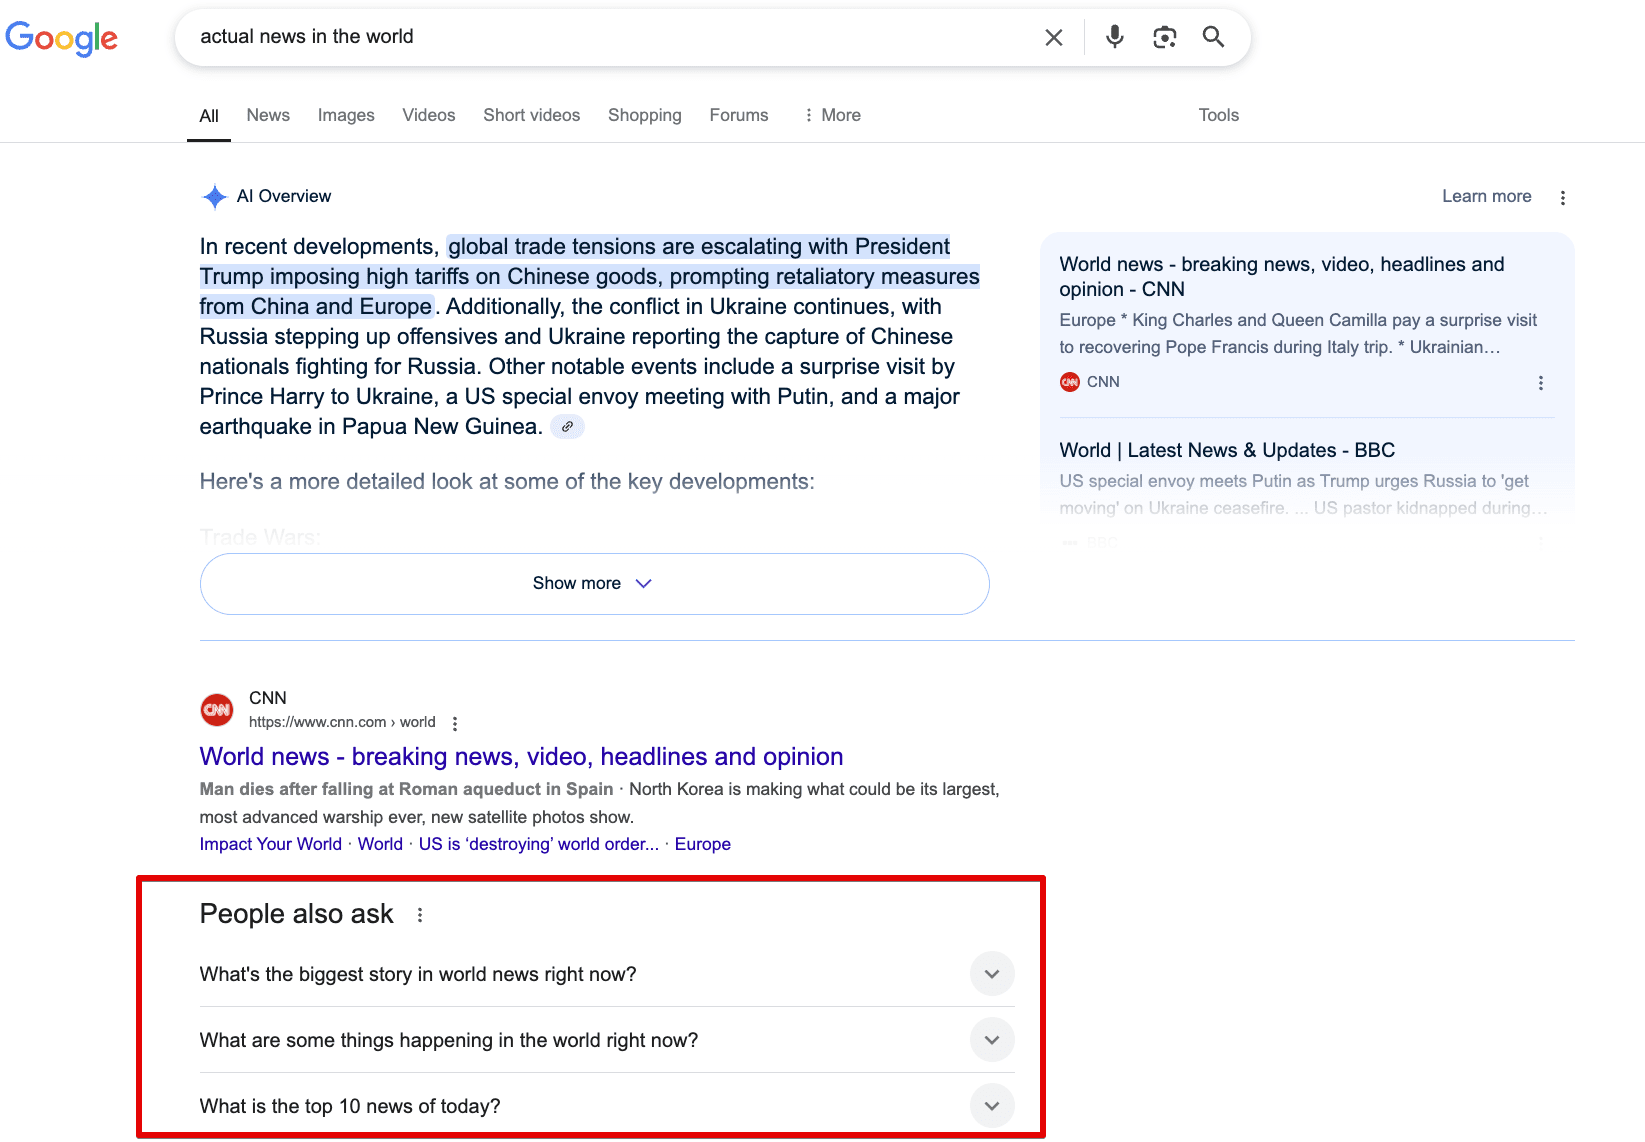
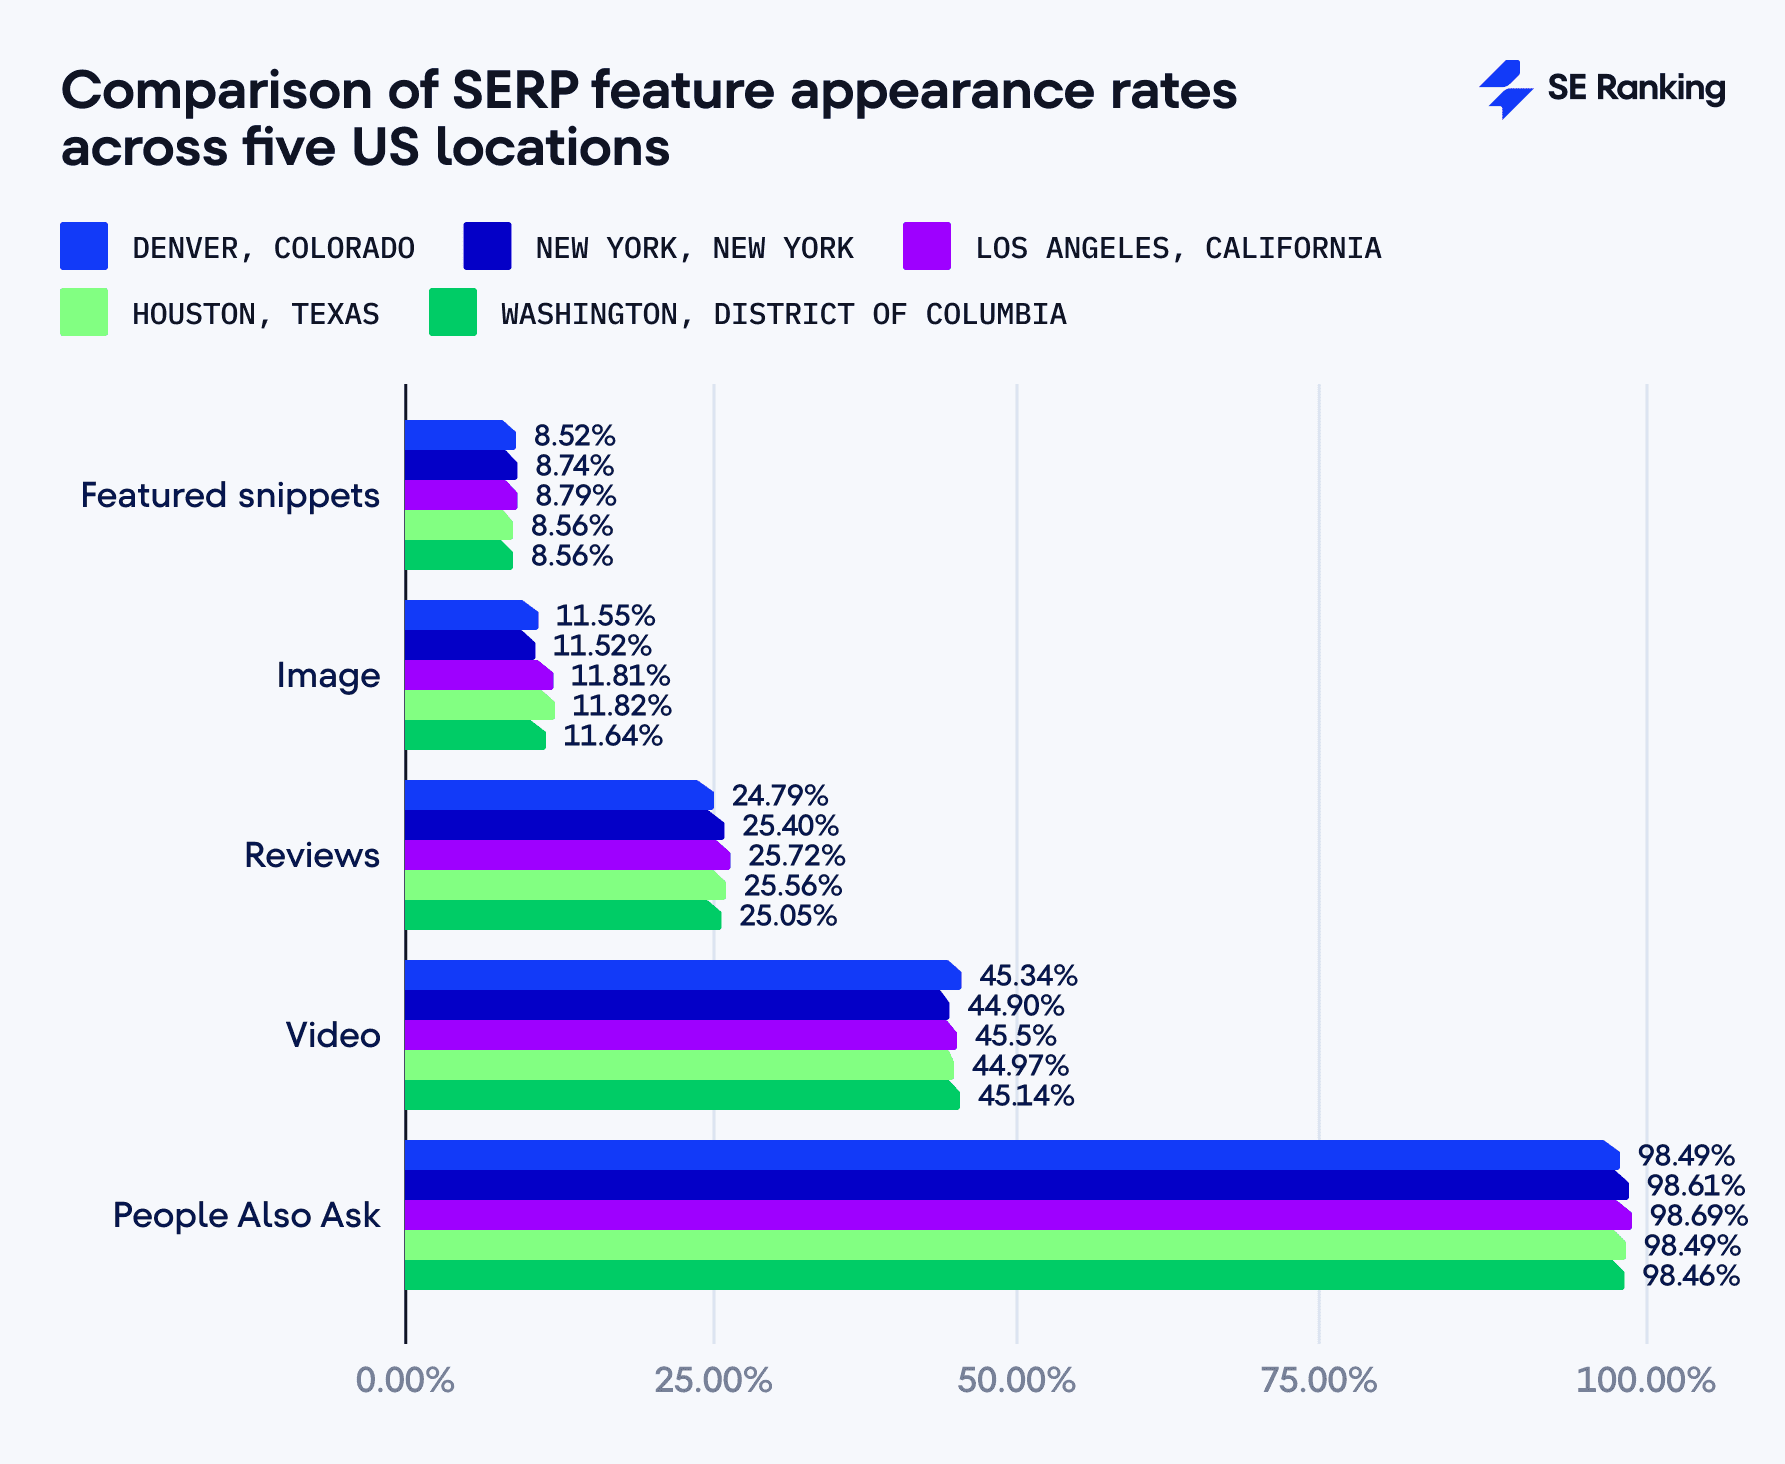
Across all five states, 99.25% of AI Overviews appear together with at least one of the five analyzed SERP features. The People Also Ask section appears most frequently (98.54%), followed by Video (45.17%), Reviews (25.30%), Image (11.67%), and Featured Snippets (8.63%).
-
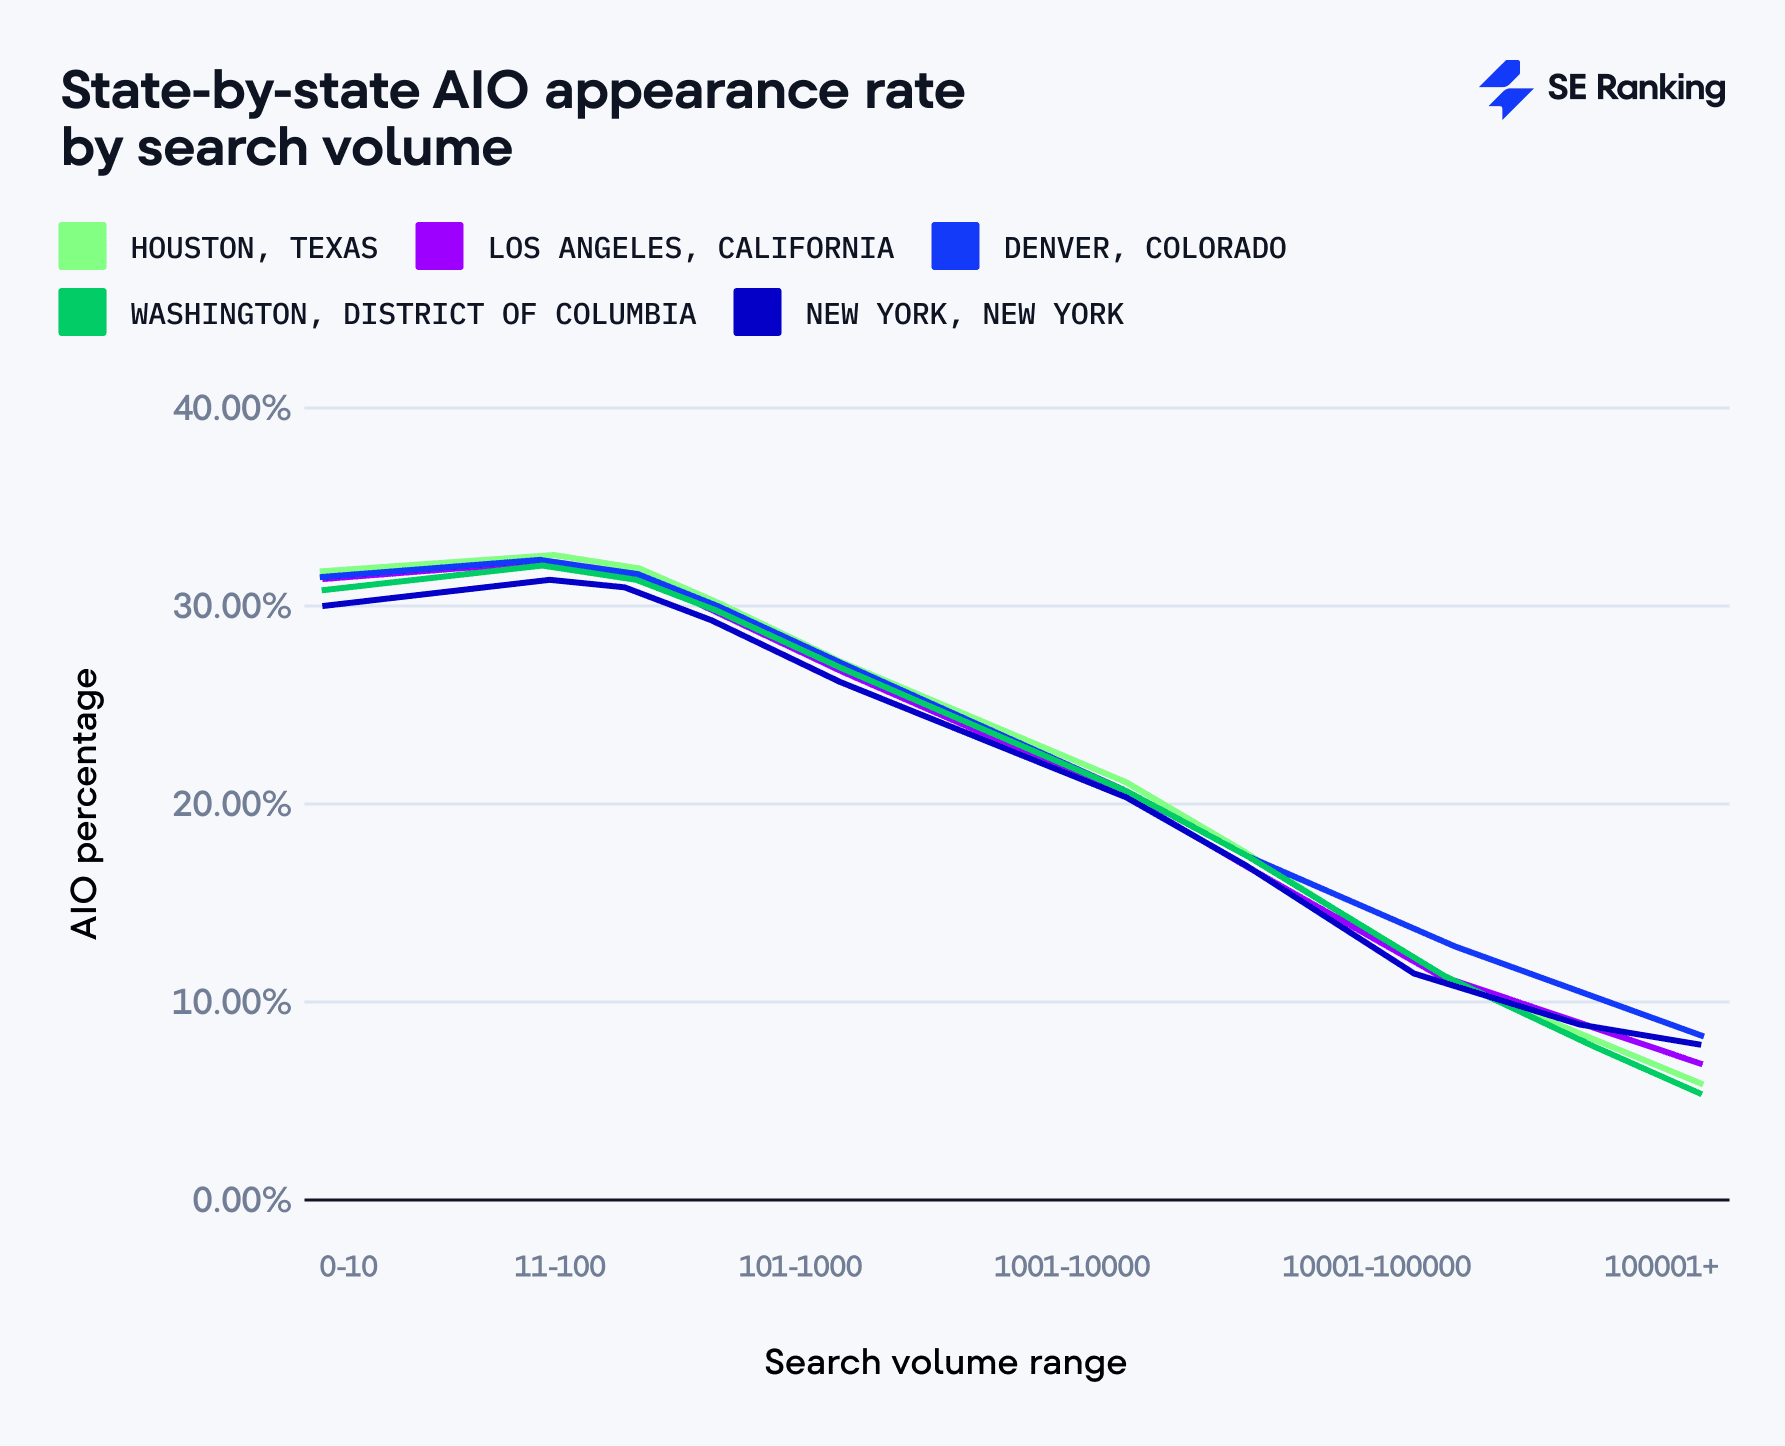
Keywords with search volumes between 0 and 100 trigger AIOs most often, with rates of around 30-32%. As search volume increases, AIO appearances decrease, dropping to just 9-12% for keywords with search volumes over 100,000.
-
Keywords with CPC values between $2–$5 trigger AIOs at a 32.02% rate. In contrast, keywords with CPCs between $0.5–$1 and $10+ appear less often, at 20.07% and 17.31%, respectively.
-
AIO responses are most common for medium-difficulty keywords (21–40) at a rate of 33.4%. Highly competitive terms with keyword difficulties of 81-100 rarely trigger AI Overviews (3.7%).
-
10-word queries trigger AI Overviews 5.4x more often than 1-word queries (69.21% vs 12.78%). Overall, the trend continues. The longer the search query, the more likely it is to trigger an AIO.
-
The longer the AIO’s answer, the more sources it cites. On average, across states, responses under 600 characters cite 5.31 sources. Responses over 6600 characters cite 28 sources.
-
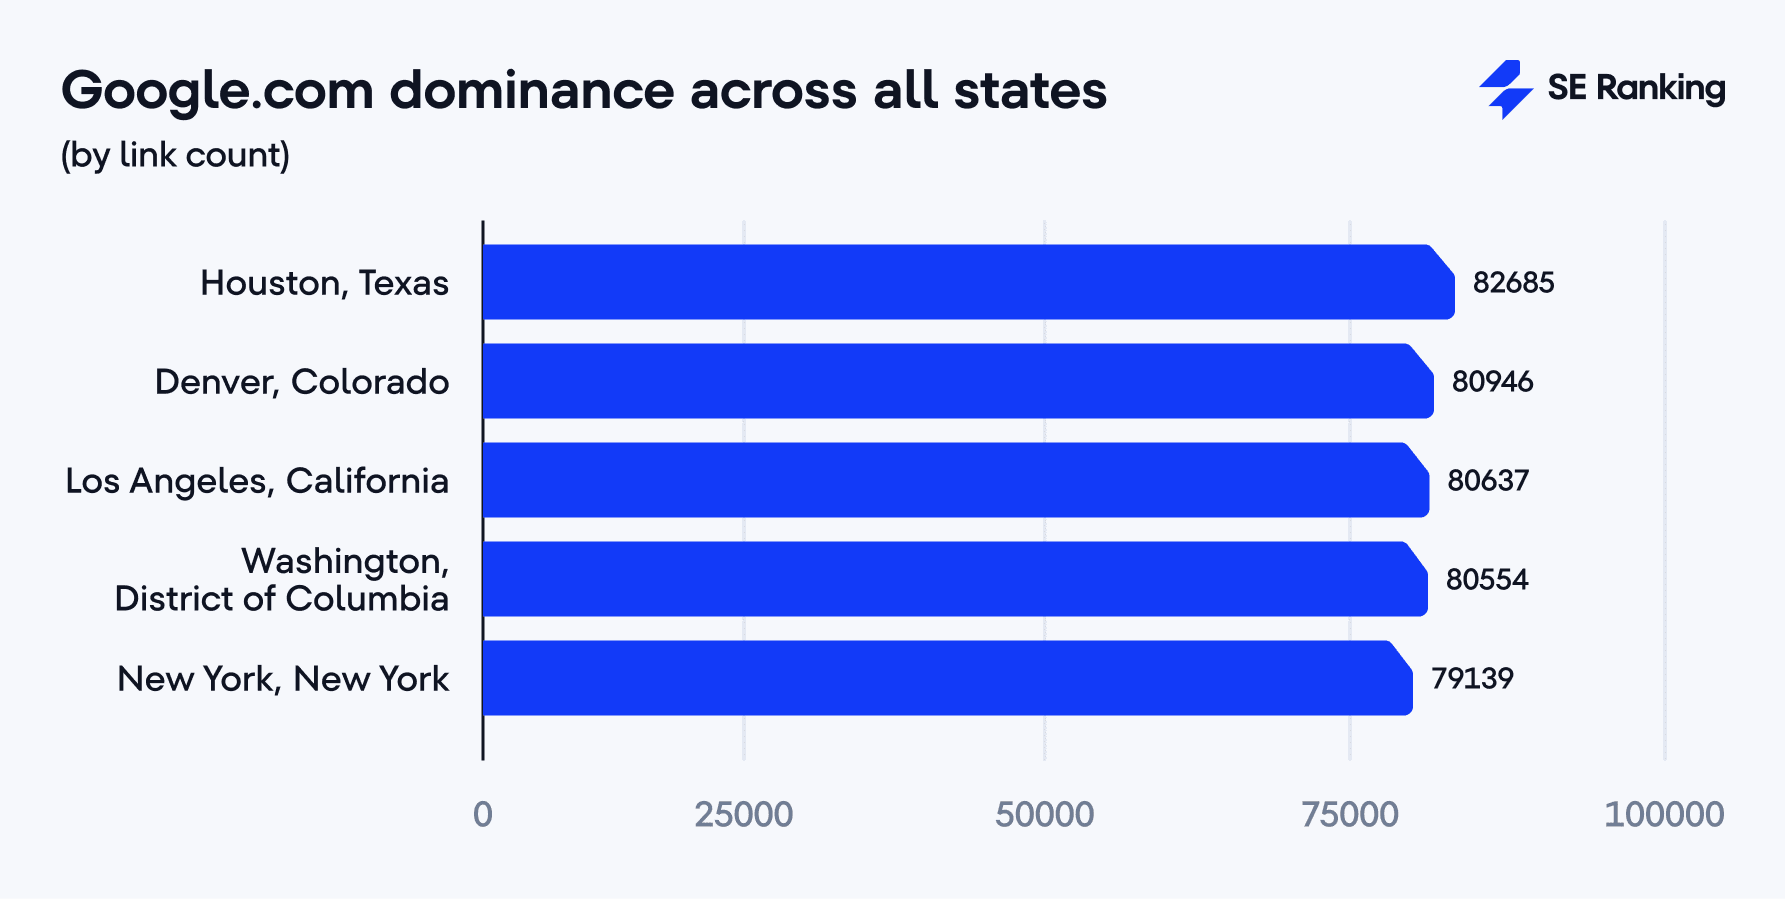
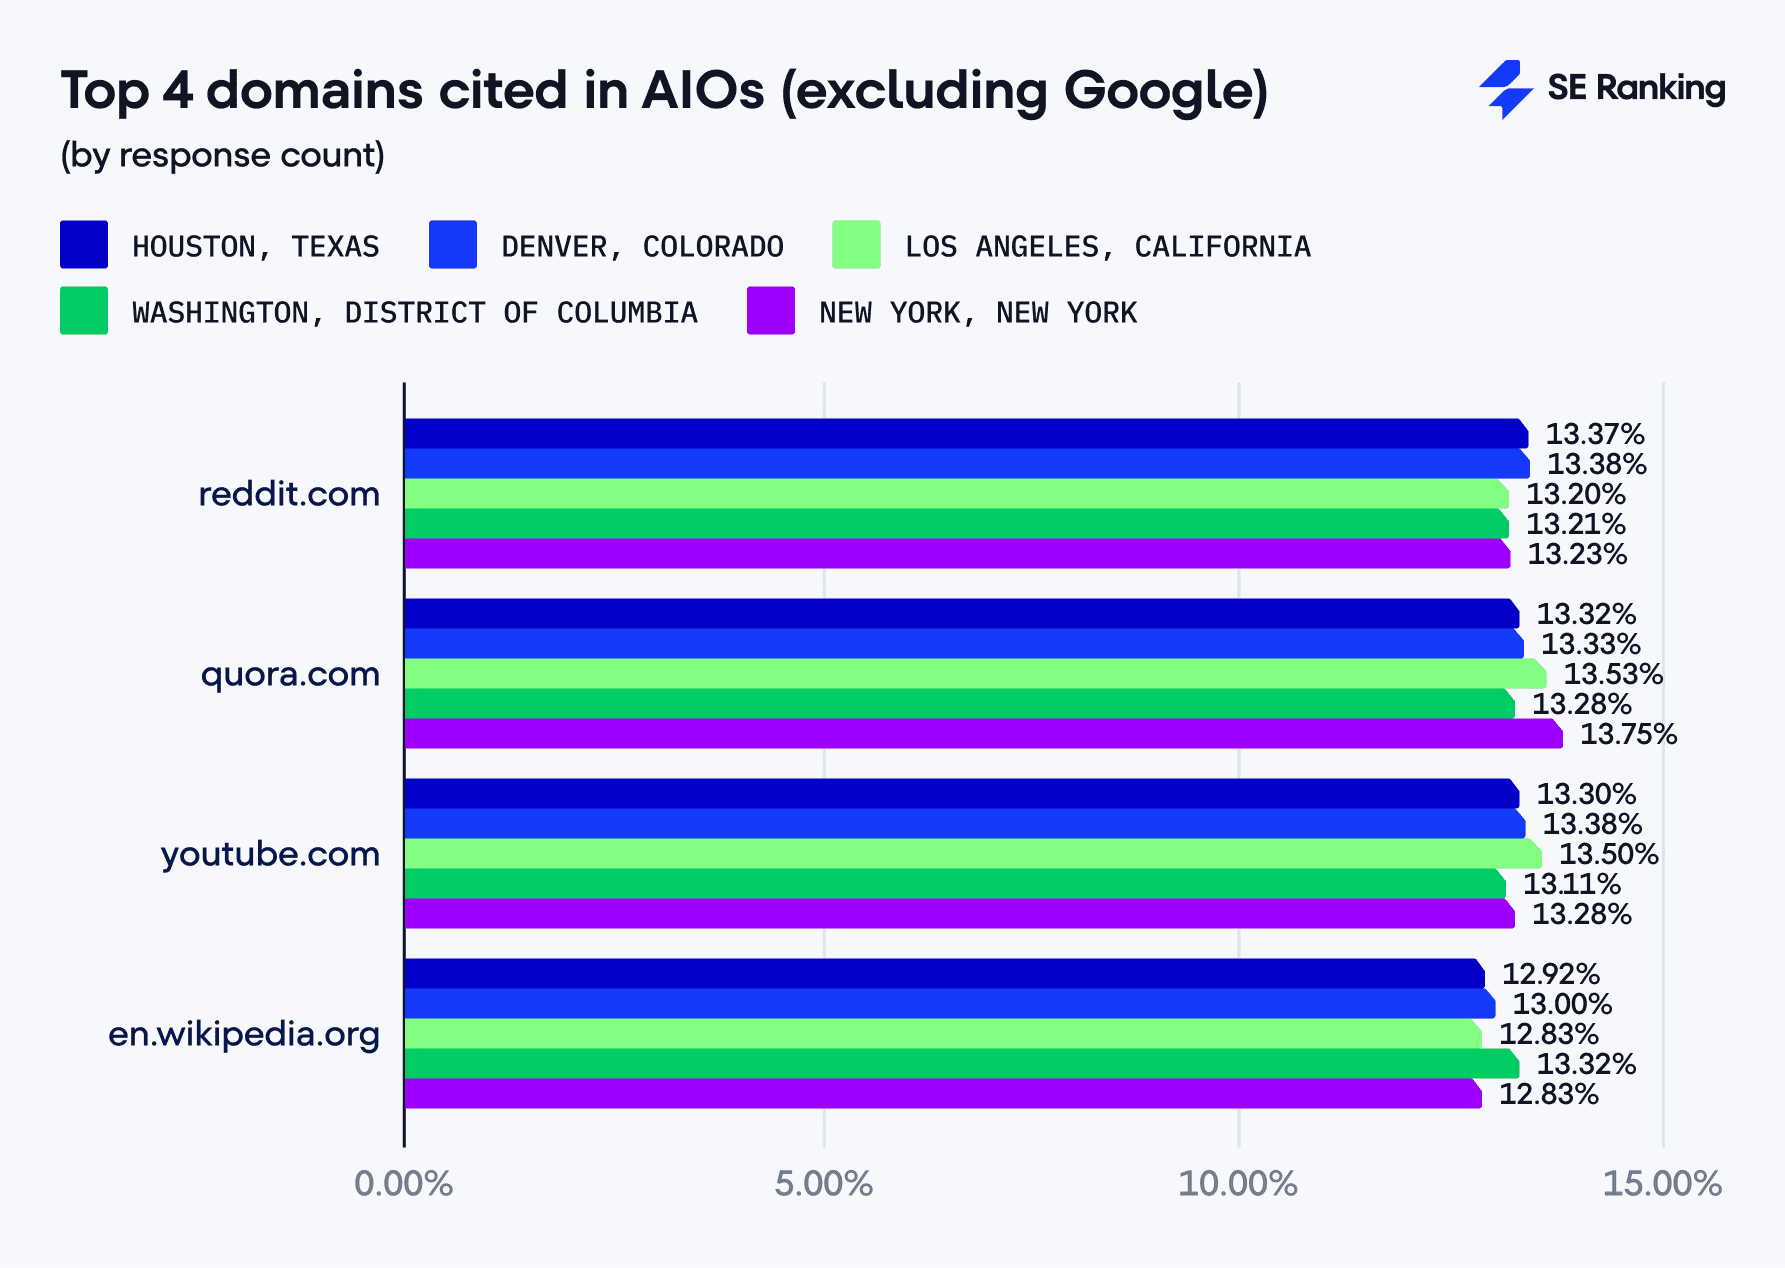
Google.com is the top-cited website with 79,139–82,685 mentions and is present in nearly 44% of the responses observed across the US. YouTube, Reddit, Quora, and Wikipedia follow closely, each linked up to ~5,711, ~4,850, ~4,691, and ~4,450 times, respectively, and cited in ~13% of responses.
-
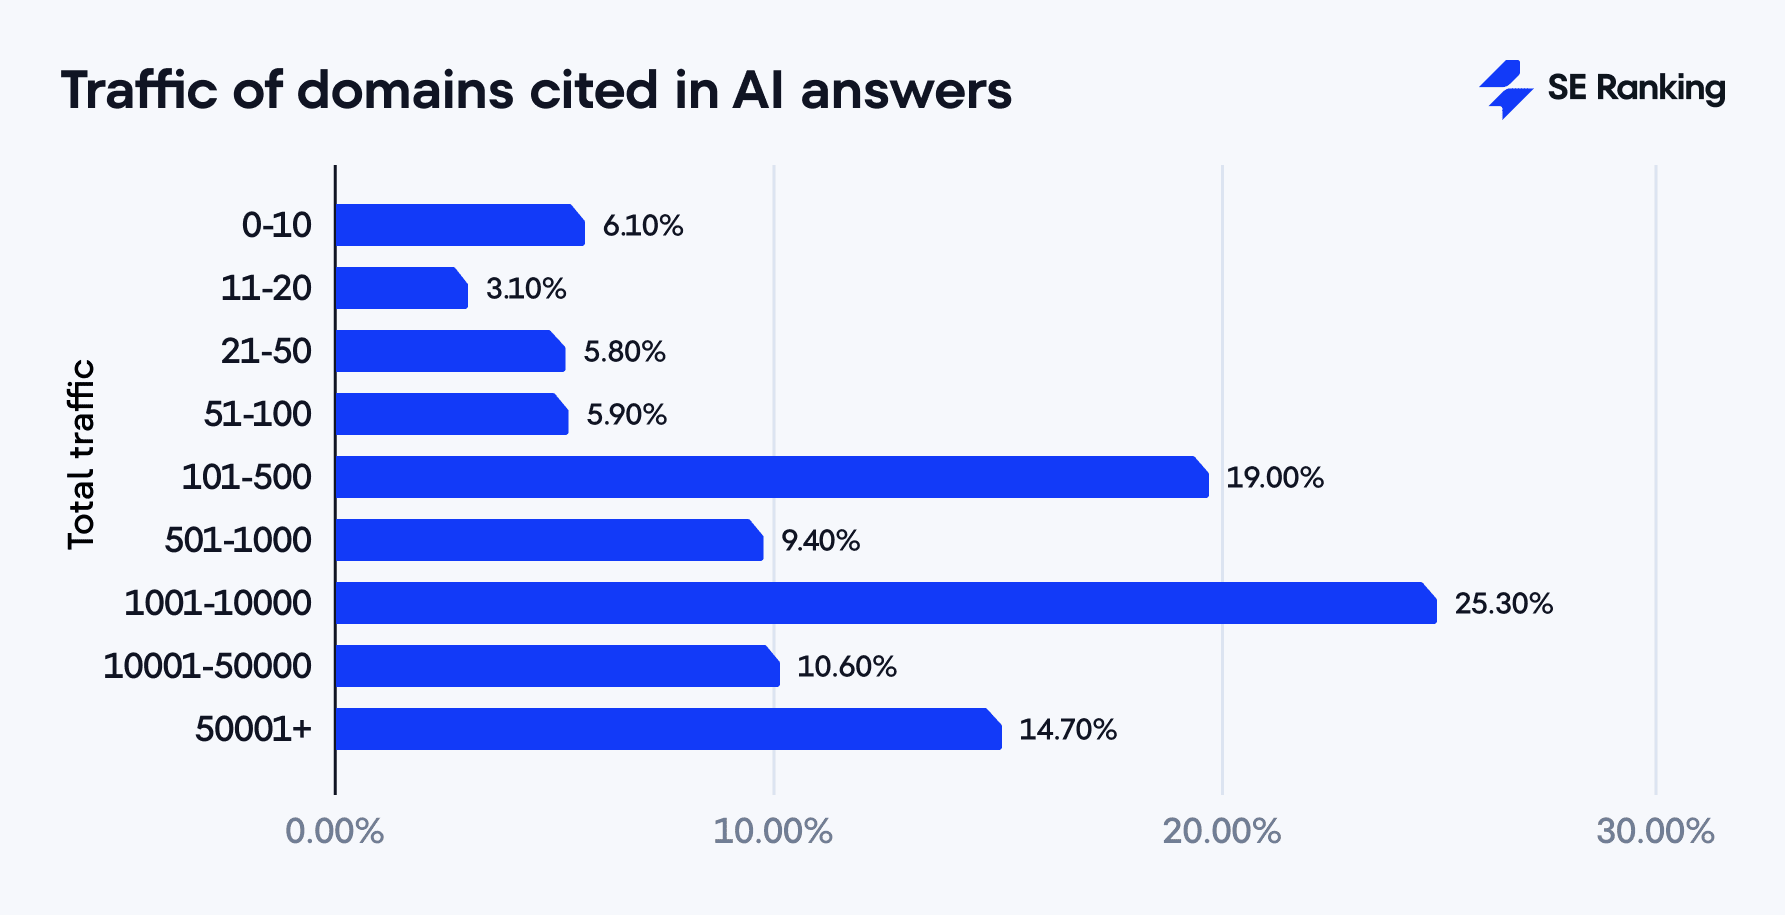
Google’s AI Overviews consistently prioritize domains with established authority metrics across all US states. Overall, 75.70% (64,847) of cited sources rank for more than 1,000 keywords. For traffic, 19.00% (15,887) of domains receive between 101 and 500 monthly visits, while 25.30% (21,151) fall into the 1,001–10,000 range. For backlink profiles, 34.50% (29,319) of domains have 101–500 referring domains, and 22.60% (19,185) have between 1,001 and 10,000 referring domains.
-
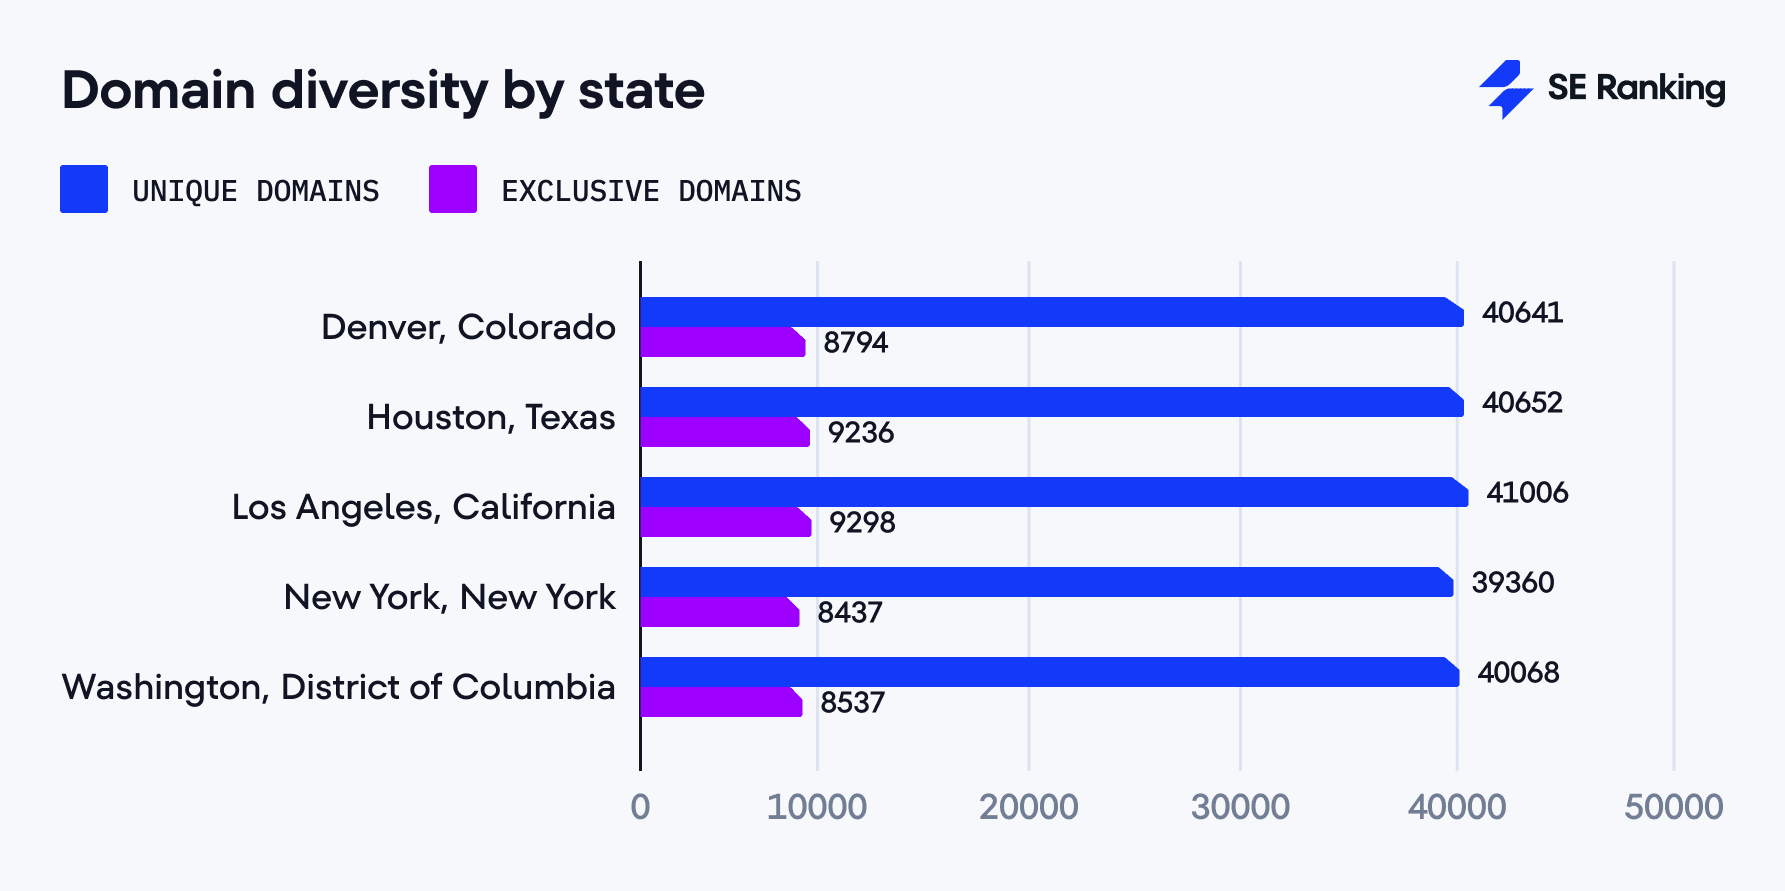
AIOs rely on a mostly standardized source pool, meaning many of the same domains appear in multiple US locations. Los Angeles has the highest number of unique domains cited (41,006) and also the most exclusive ones (9,298) that appear only in that region. Houston has the largest proportion of exclusive domains (22.72%).
-
Each state has its own set of exclusive domains, like denbar.org (Denver) and does.dc.gov (Washington, D.C.). While rare, exclusive domains signal that AIOs adapt to local context, especially for queries tied to regional institutions or services.
-
AI Overviews consistently cite around 9.81–9.90 unique domains per query across all states.
-
Nearly half of all queries (47.05%) cite identical sources (domains) across all states. More than 53% of queries have a domain match rate of at least 50%. For 6.34% of queries, sources don’t overlap between states (typically in Legal, Healthcare, and Real Estate niches).
Disclaimer: This research analyzes 100,013 keywords divided into 20 niches across five states (Colorado, Texas, California, New York, and Washington, D.C.) as of April 15. We selected these states to cover a wide geographic range and better spot regional patterns. While we strive for accuracy, Google’s AI Overview system is continuously evolving. Appearance rates, citation patterns, and other metrics may change over time.
The conclusions in this report are based on our analysis of a specific dataset and time period. Other interpretations may exist, and results may differ with alternative keyword sets, search conditions, or time periods. Our findings apply specifically to English-language searches conducted across the five states chosen and may not reflect how AI Overviews behave in other languages or regions. This research is for informational use only.
For a deeper look into how we gathered the data, go to the research methodology section below.
General insights into AI Overviews across the US
How do AI Overview appearance rates differ across each state?
Overall data by state
We analyzed 100,013 keywords and found that about 30% (from 27,753 to 28,664 keywords) of queries triggered an AI-generated response across five US locations, with only slight variations:
- Houston, Texas: 28.66%
- Denver, Colorado: 28.49%
- Washington, DC: 28.32%
- Los Angeles, California: 28.28%
- New York, New York: 27.75%
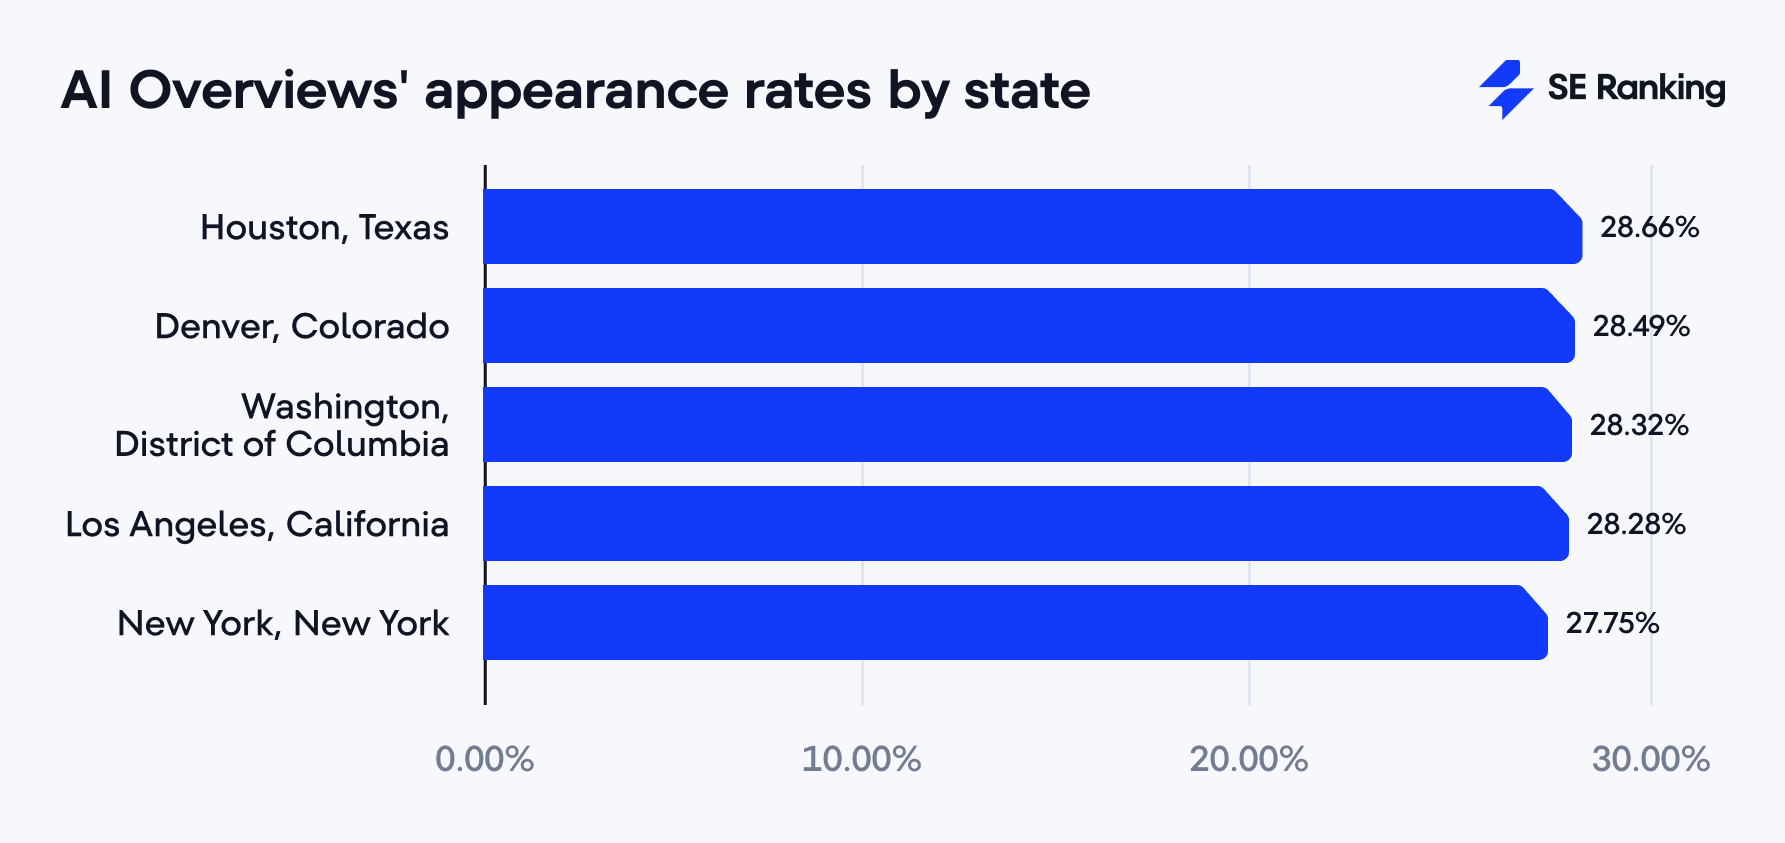
Houston, Texas shows the highest AI Overview rate (28.66%) while New York, New York shows the lowest (27.75%), a difference of less than 1%. This small variation proves Google’s AI system works consistently across all locations. Any tiny differences likely come from the types of local searches users make in each region.


Barry Schwartz also confirms this variation in AI Overview appearance rates:

Data by location and niche
When analyzing by niche, AI Overviews appeared most frequently in the Relationships category (60.54%–62.38%). This was followed by Business (56.38%–57.52%) and Education (48.70%–51.86%).
On the other end of the spectrum, Fashion and Beauty resulted in the least number of AIOs—just 1.34% to 1.46%. Other low-ranking categories included E-commerce and Retail (2.14%–2.48%) and News and Politics (3.76%–4.50%).
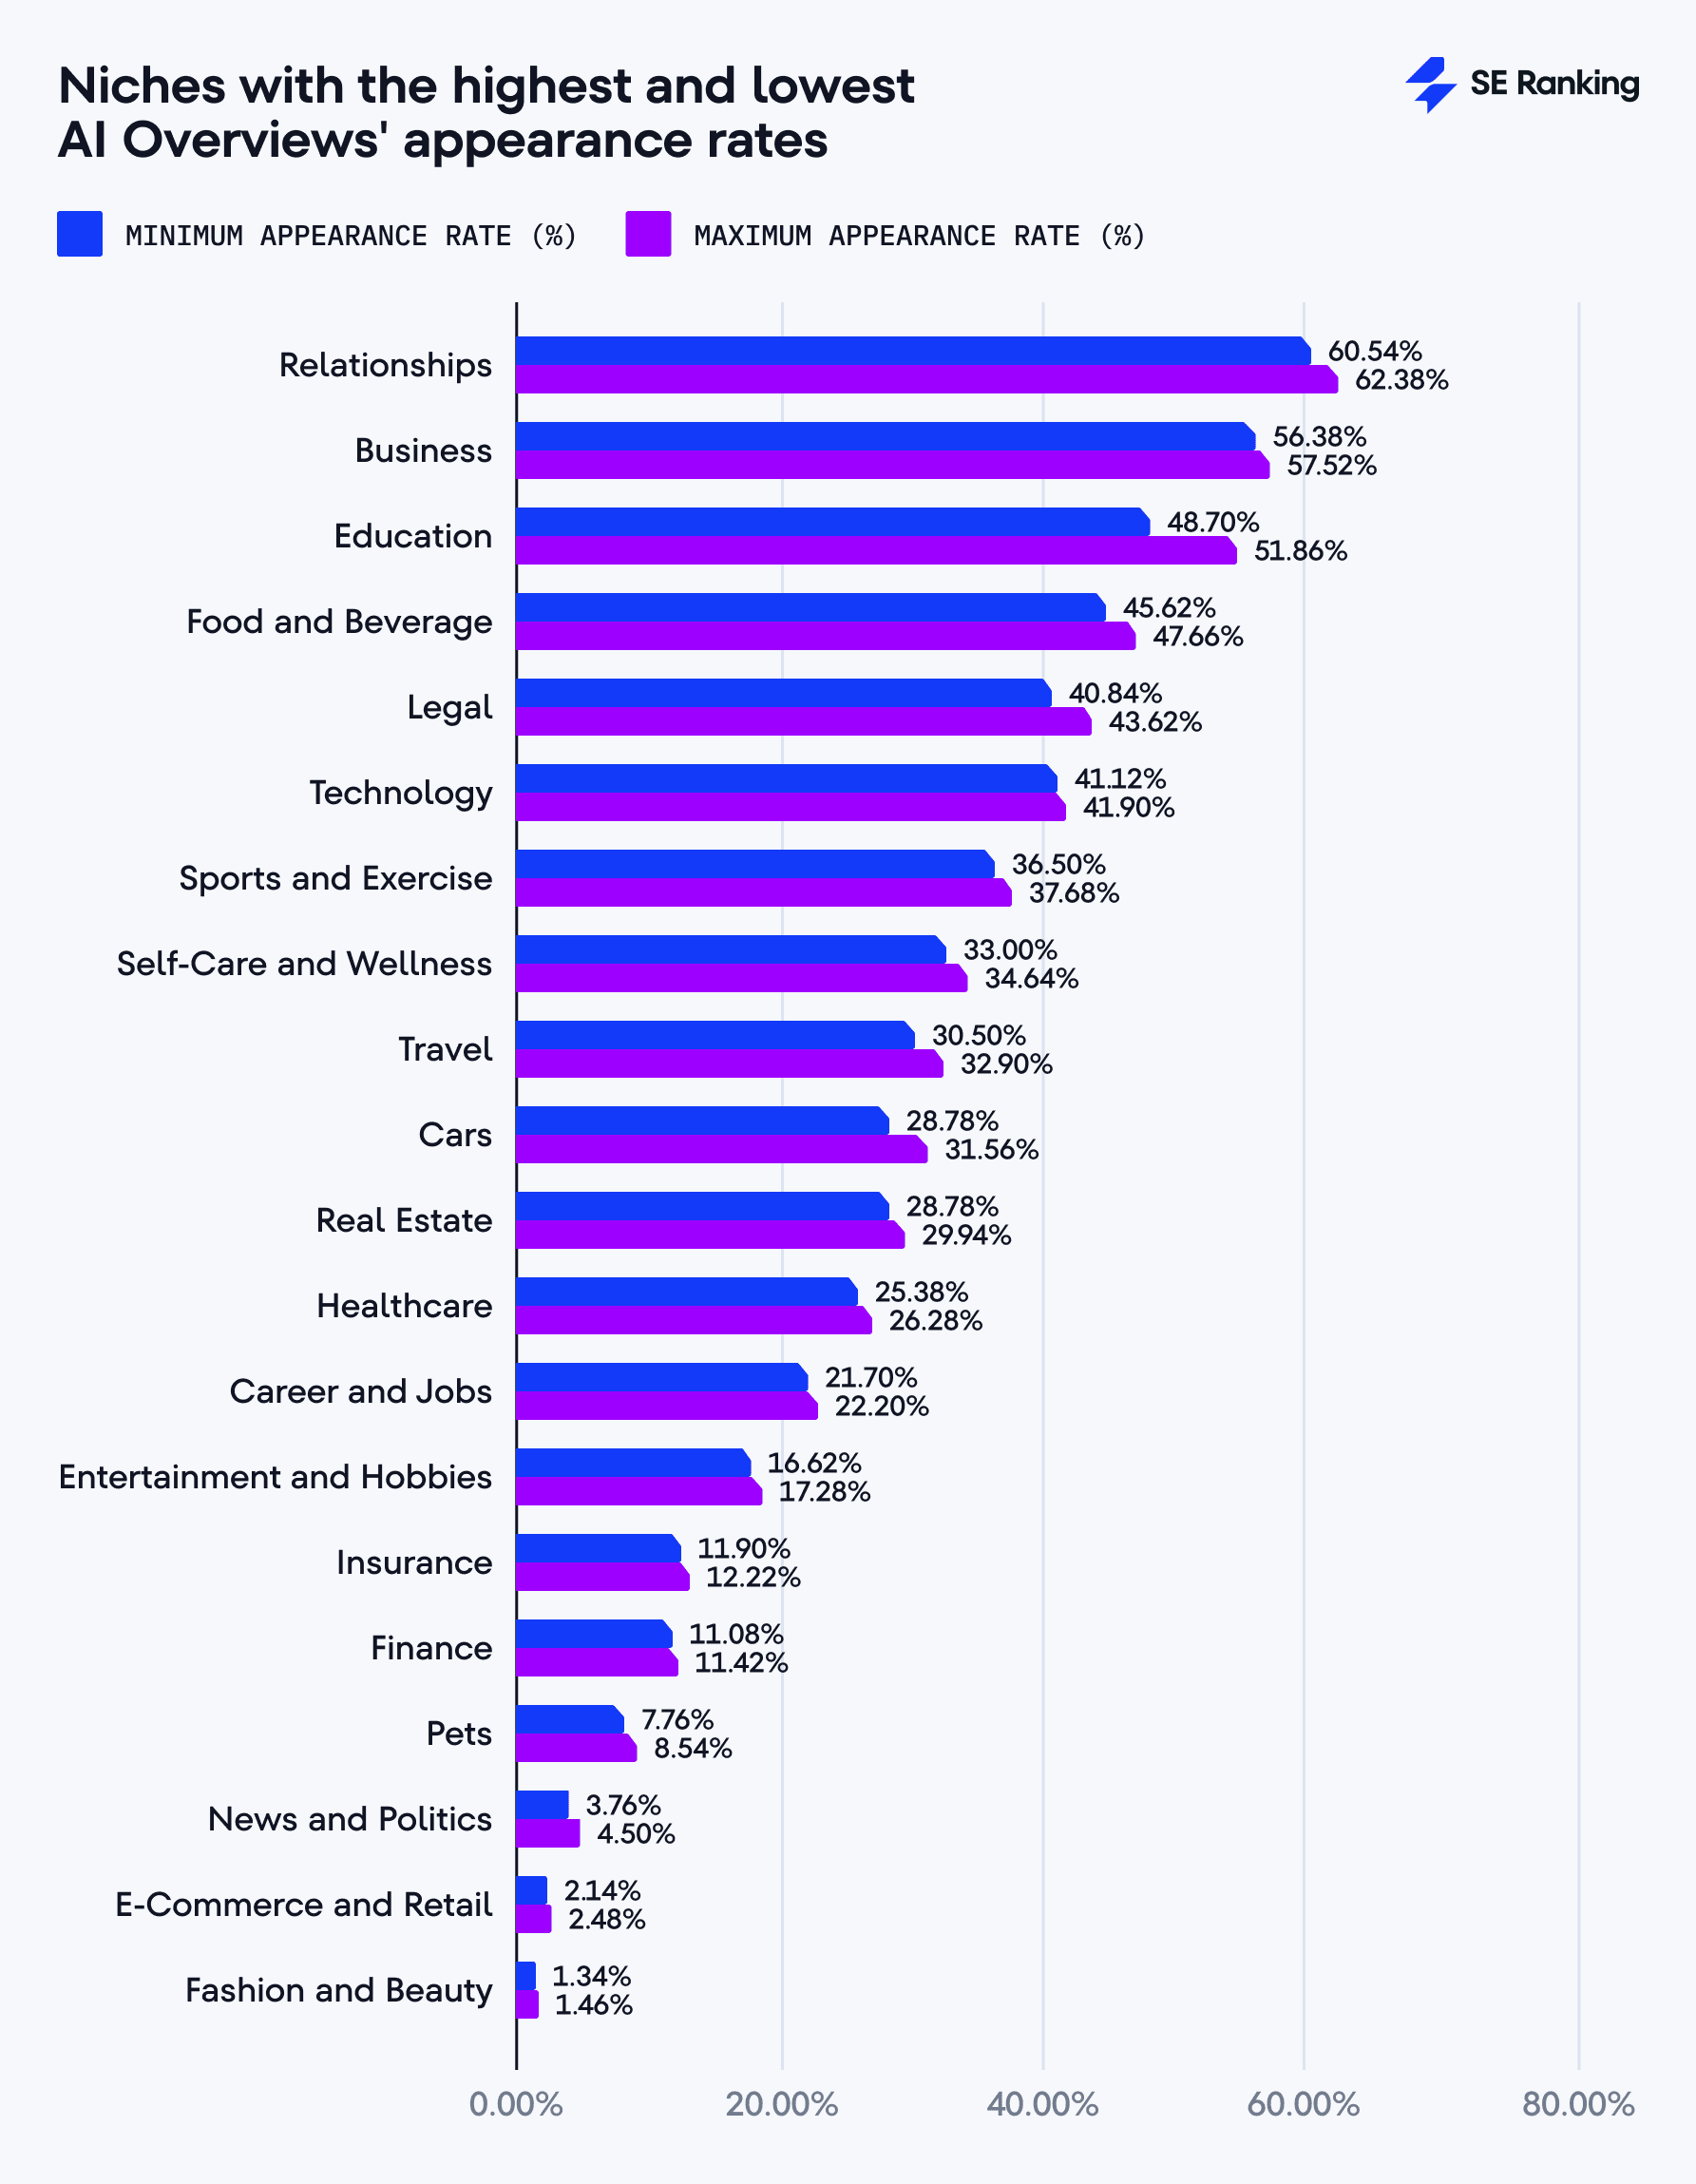
Across all five states, the trend in AI Overview appearances stays consistent: categories like Relationships, Business, and Education are far more likely to trigger AI-generated answers than others. These patterns also mirror what we found in our 2024 recap, where Relationships stayed the top category all year, followed by Business, Food and Beverage, and Technology niches.
How many sources do AI Overviews cite in each state?
We analyzed the average and maximum number of sources (also referred to as references) included in AI Overview responses and found consistent results across all five US locations:
- Los Angeles, California: 13.41 links
- Houston, Texas: 13.38 links
- Denver, Colorado: 13.37 links
- Washington, DC: 13.28 links
- New York, New York: 13.28 links
The average reference count across regions varies by just 0.13 links. Los Angeles recorded the highest average at 13.41 references, while New York had the lowest at 13.28.
With maximum counts, Houston and Los Angeles lead with 95 links in a single response. Denver, New York, and Washington recorded slightly lower peaks at 77, 87, and 82 links, respectively.
- Denver, Colorado: 77 links
- Houston, Texas: 95 links
- Los Angeles: 95 links
- New York, New York: 87 links
- Washington, DC: 82 links
The maximum reference count across regions varies by 18 links.
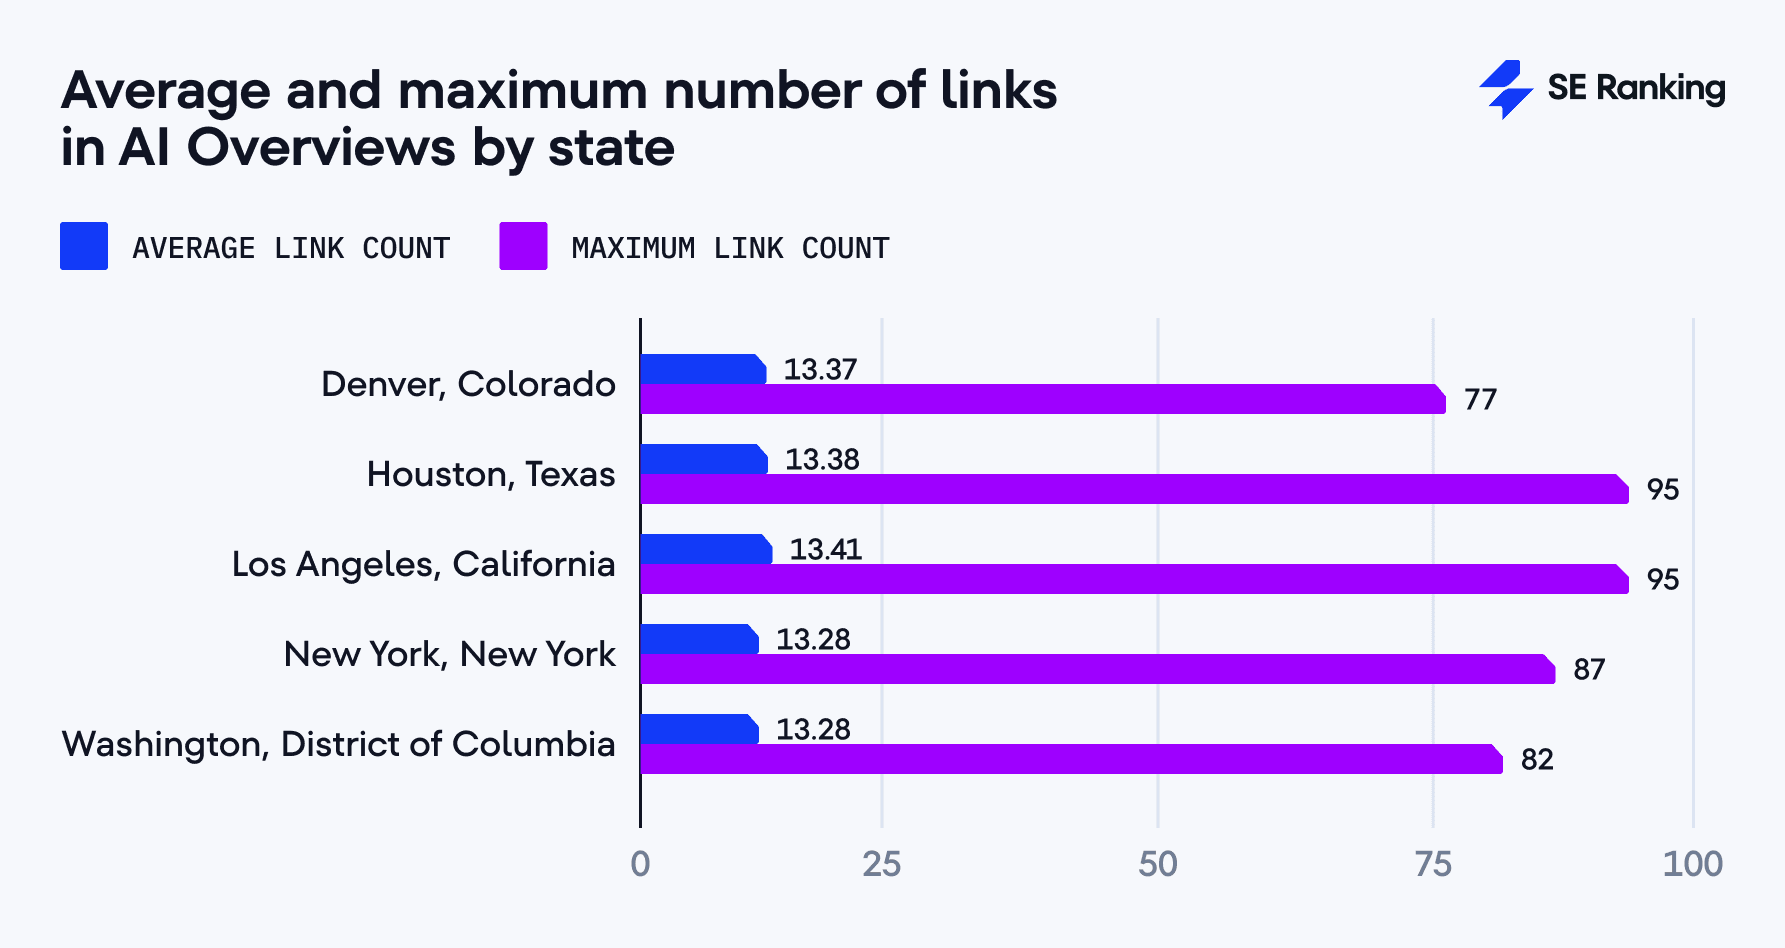
Note, the minimum values for each state are 1 source, so we didn’t give it much attention.
Overall, these findings highlight the high level of standardization in how AI Overviews cite sources across different US locations. We also noticed that AI Overviews are citing far more sources than before. In our current study, the average response includes 13.34 links, with a maximum of 95 links. Back in November 2024, the average was just 6.82 links, with a maximum of 25. This marks a nearly 2x increase in average citations and a 3.8x jump in the maximum.
What is the overall distribution of link counts in AI Overview responses?
We analyzed the overall distribution of the number of links included in AI Overview responses and found that the most common answers contained:
- 6 links: 5.46% of cases
- 7 links: 5.63% of cases
- 9 links: 6.55% of cases
- 8 links: 6.47% of cases
- 10 links: 6.27% of cases
- 11 links: 6.08% of cases
- 12 links: 5.66% of cases
- 13 links: 5.15% of cases
- 14 links: 4.83% of cases
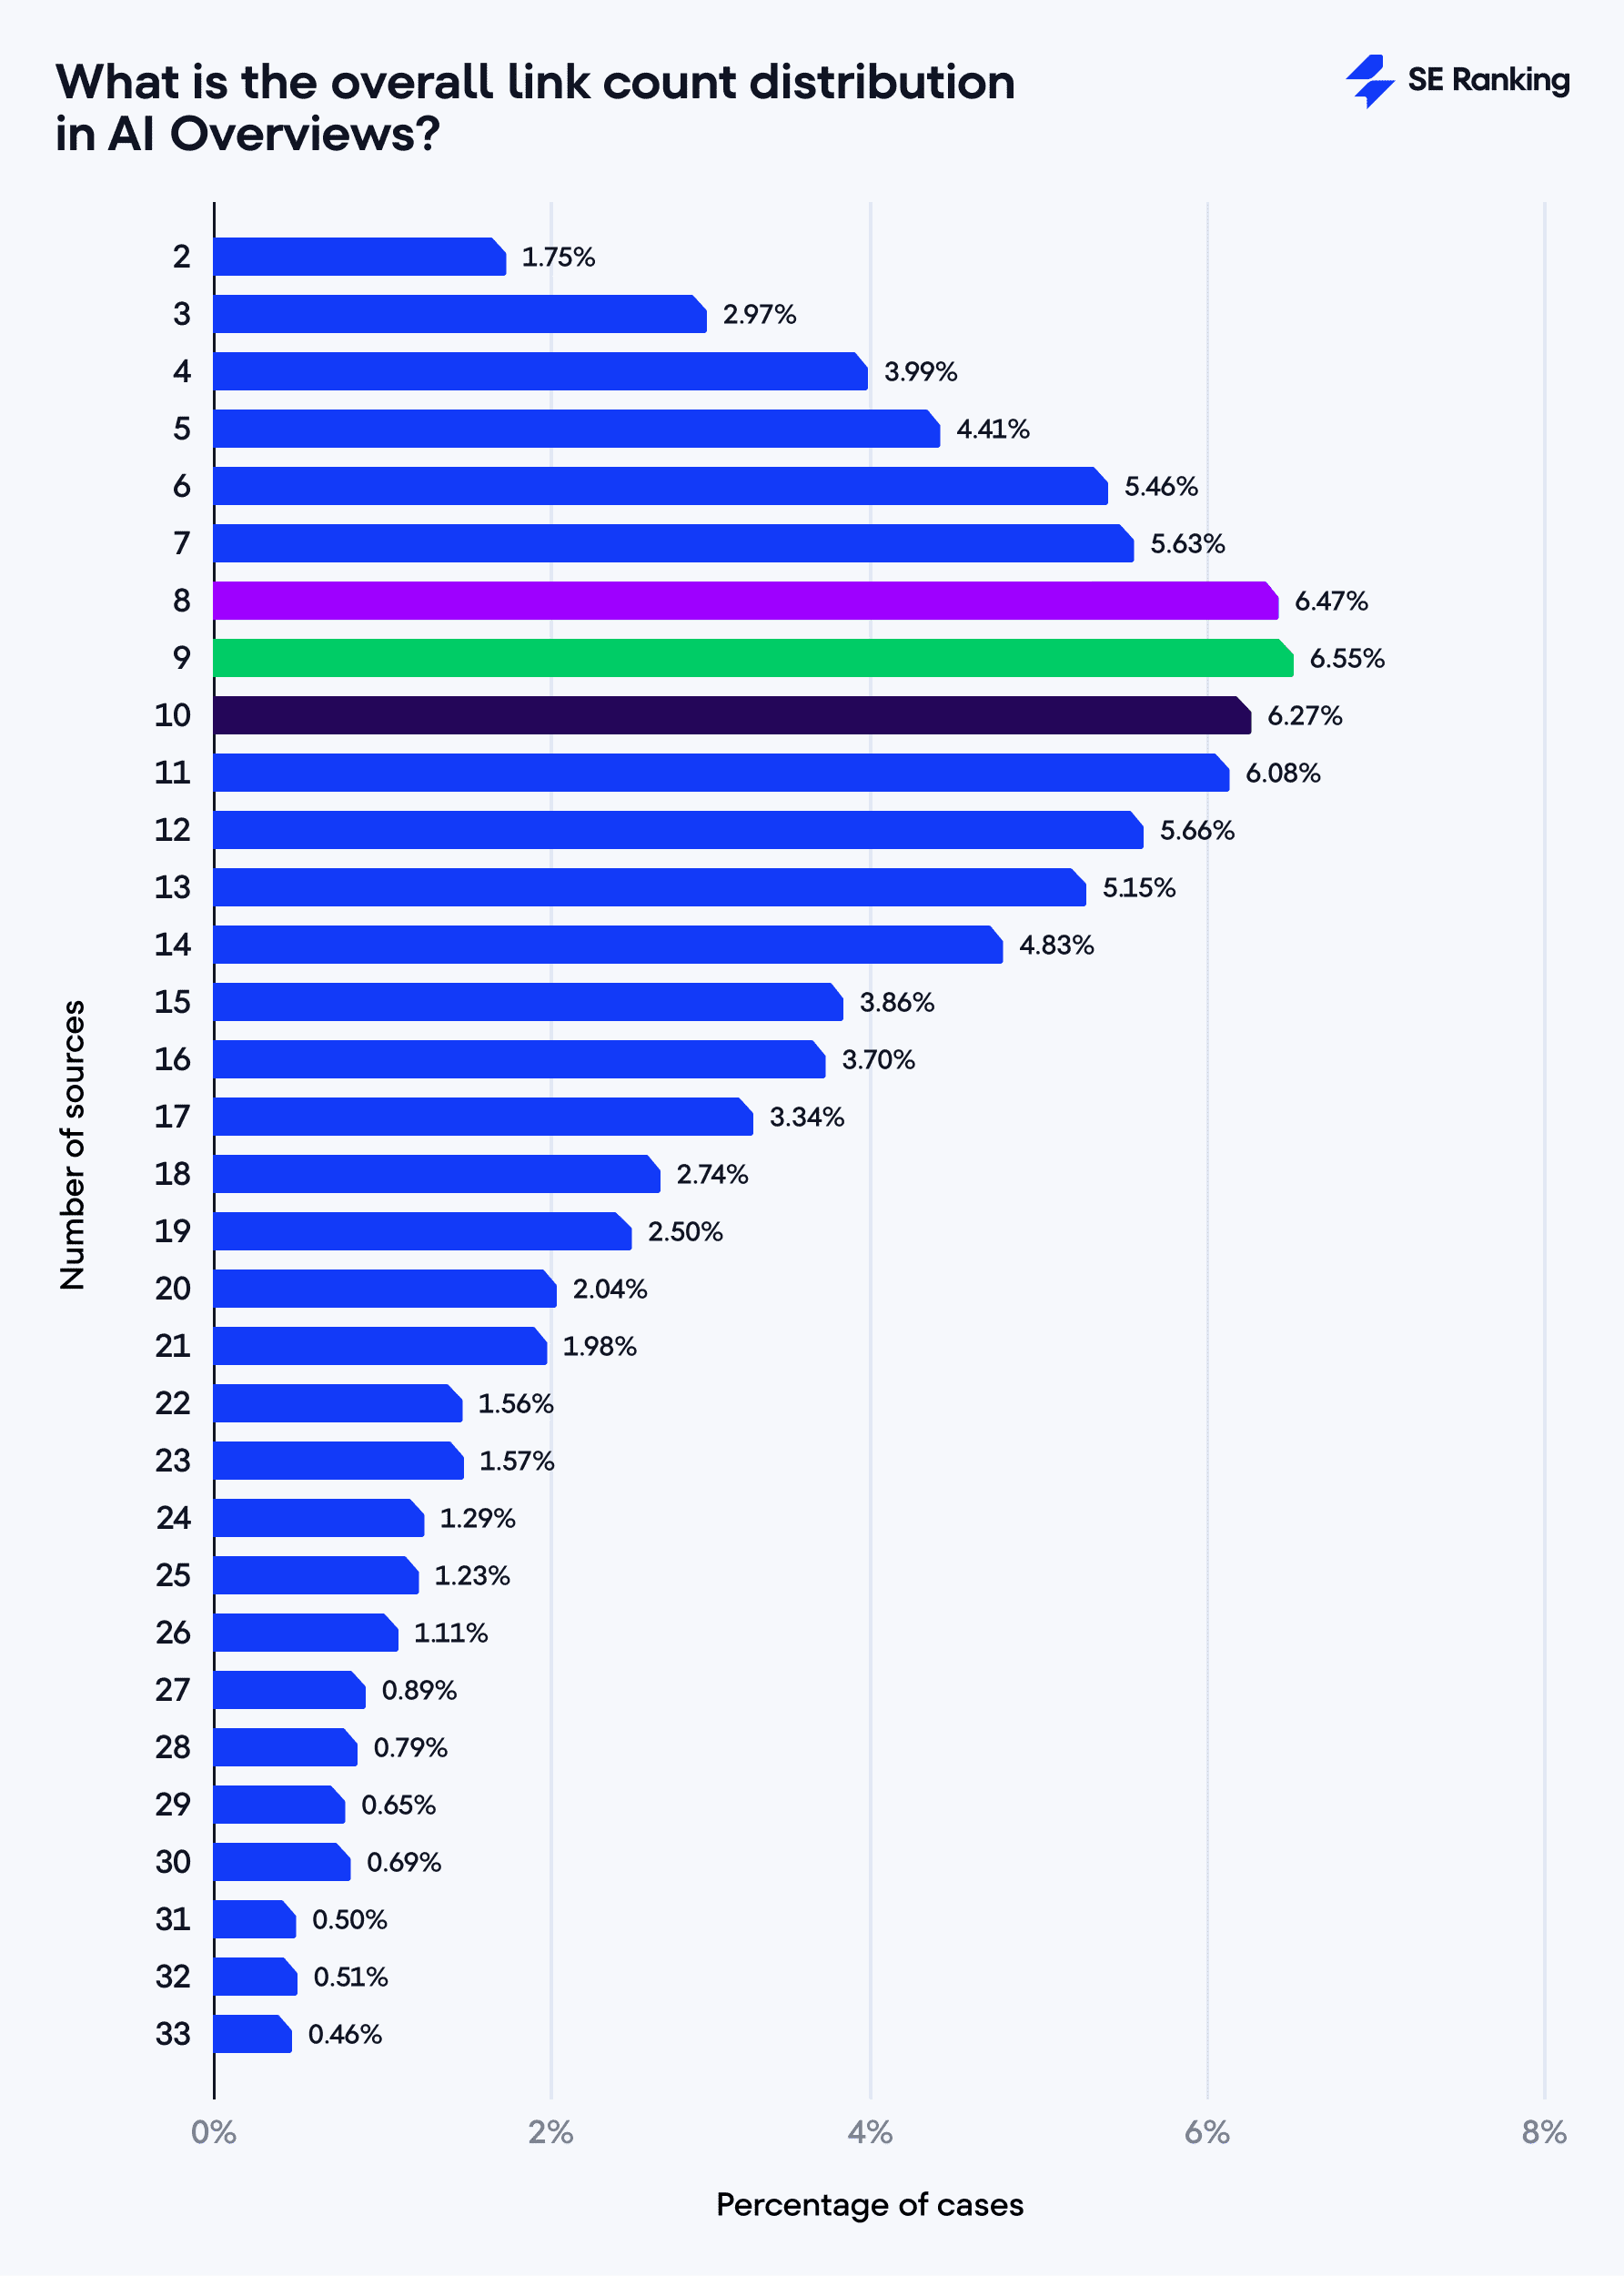
- In general, responses featuring between 6 and 14 links were the most frequent, suggesting an “optimal range” used by Google’s algorithm.
- Responses with very few sources, particularly 0 or 1 link, were rare, appearing in less than 0.5% of cases. This points to a likely minimum threshold for the number of sources needed to deliver a high-quality, trustworthy summary.
- Responses with more than 21 links steadily decrease in frequency. This highlights that the algorithm prioritizes brevity and focuses on citing only the most relevant sources.
What is the link count distribution in AI Overview responses by state?
We observed that the most common responses across all locations studied were those with 8-9 references. This trend was consistent across all regions.
However, regional differences did emerge:
- In California and New York, responses with 8 references are the most common (6.57% and 6.56%, respectively).
- In Texas and Colorado, responses with 9 references are the most common (6.60% and 6.59%, respectively).
- Washington has a higher frequency of answers with 6 (5.64%) and 12 (5.84%) references compared to all other regions.
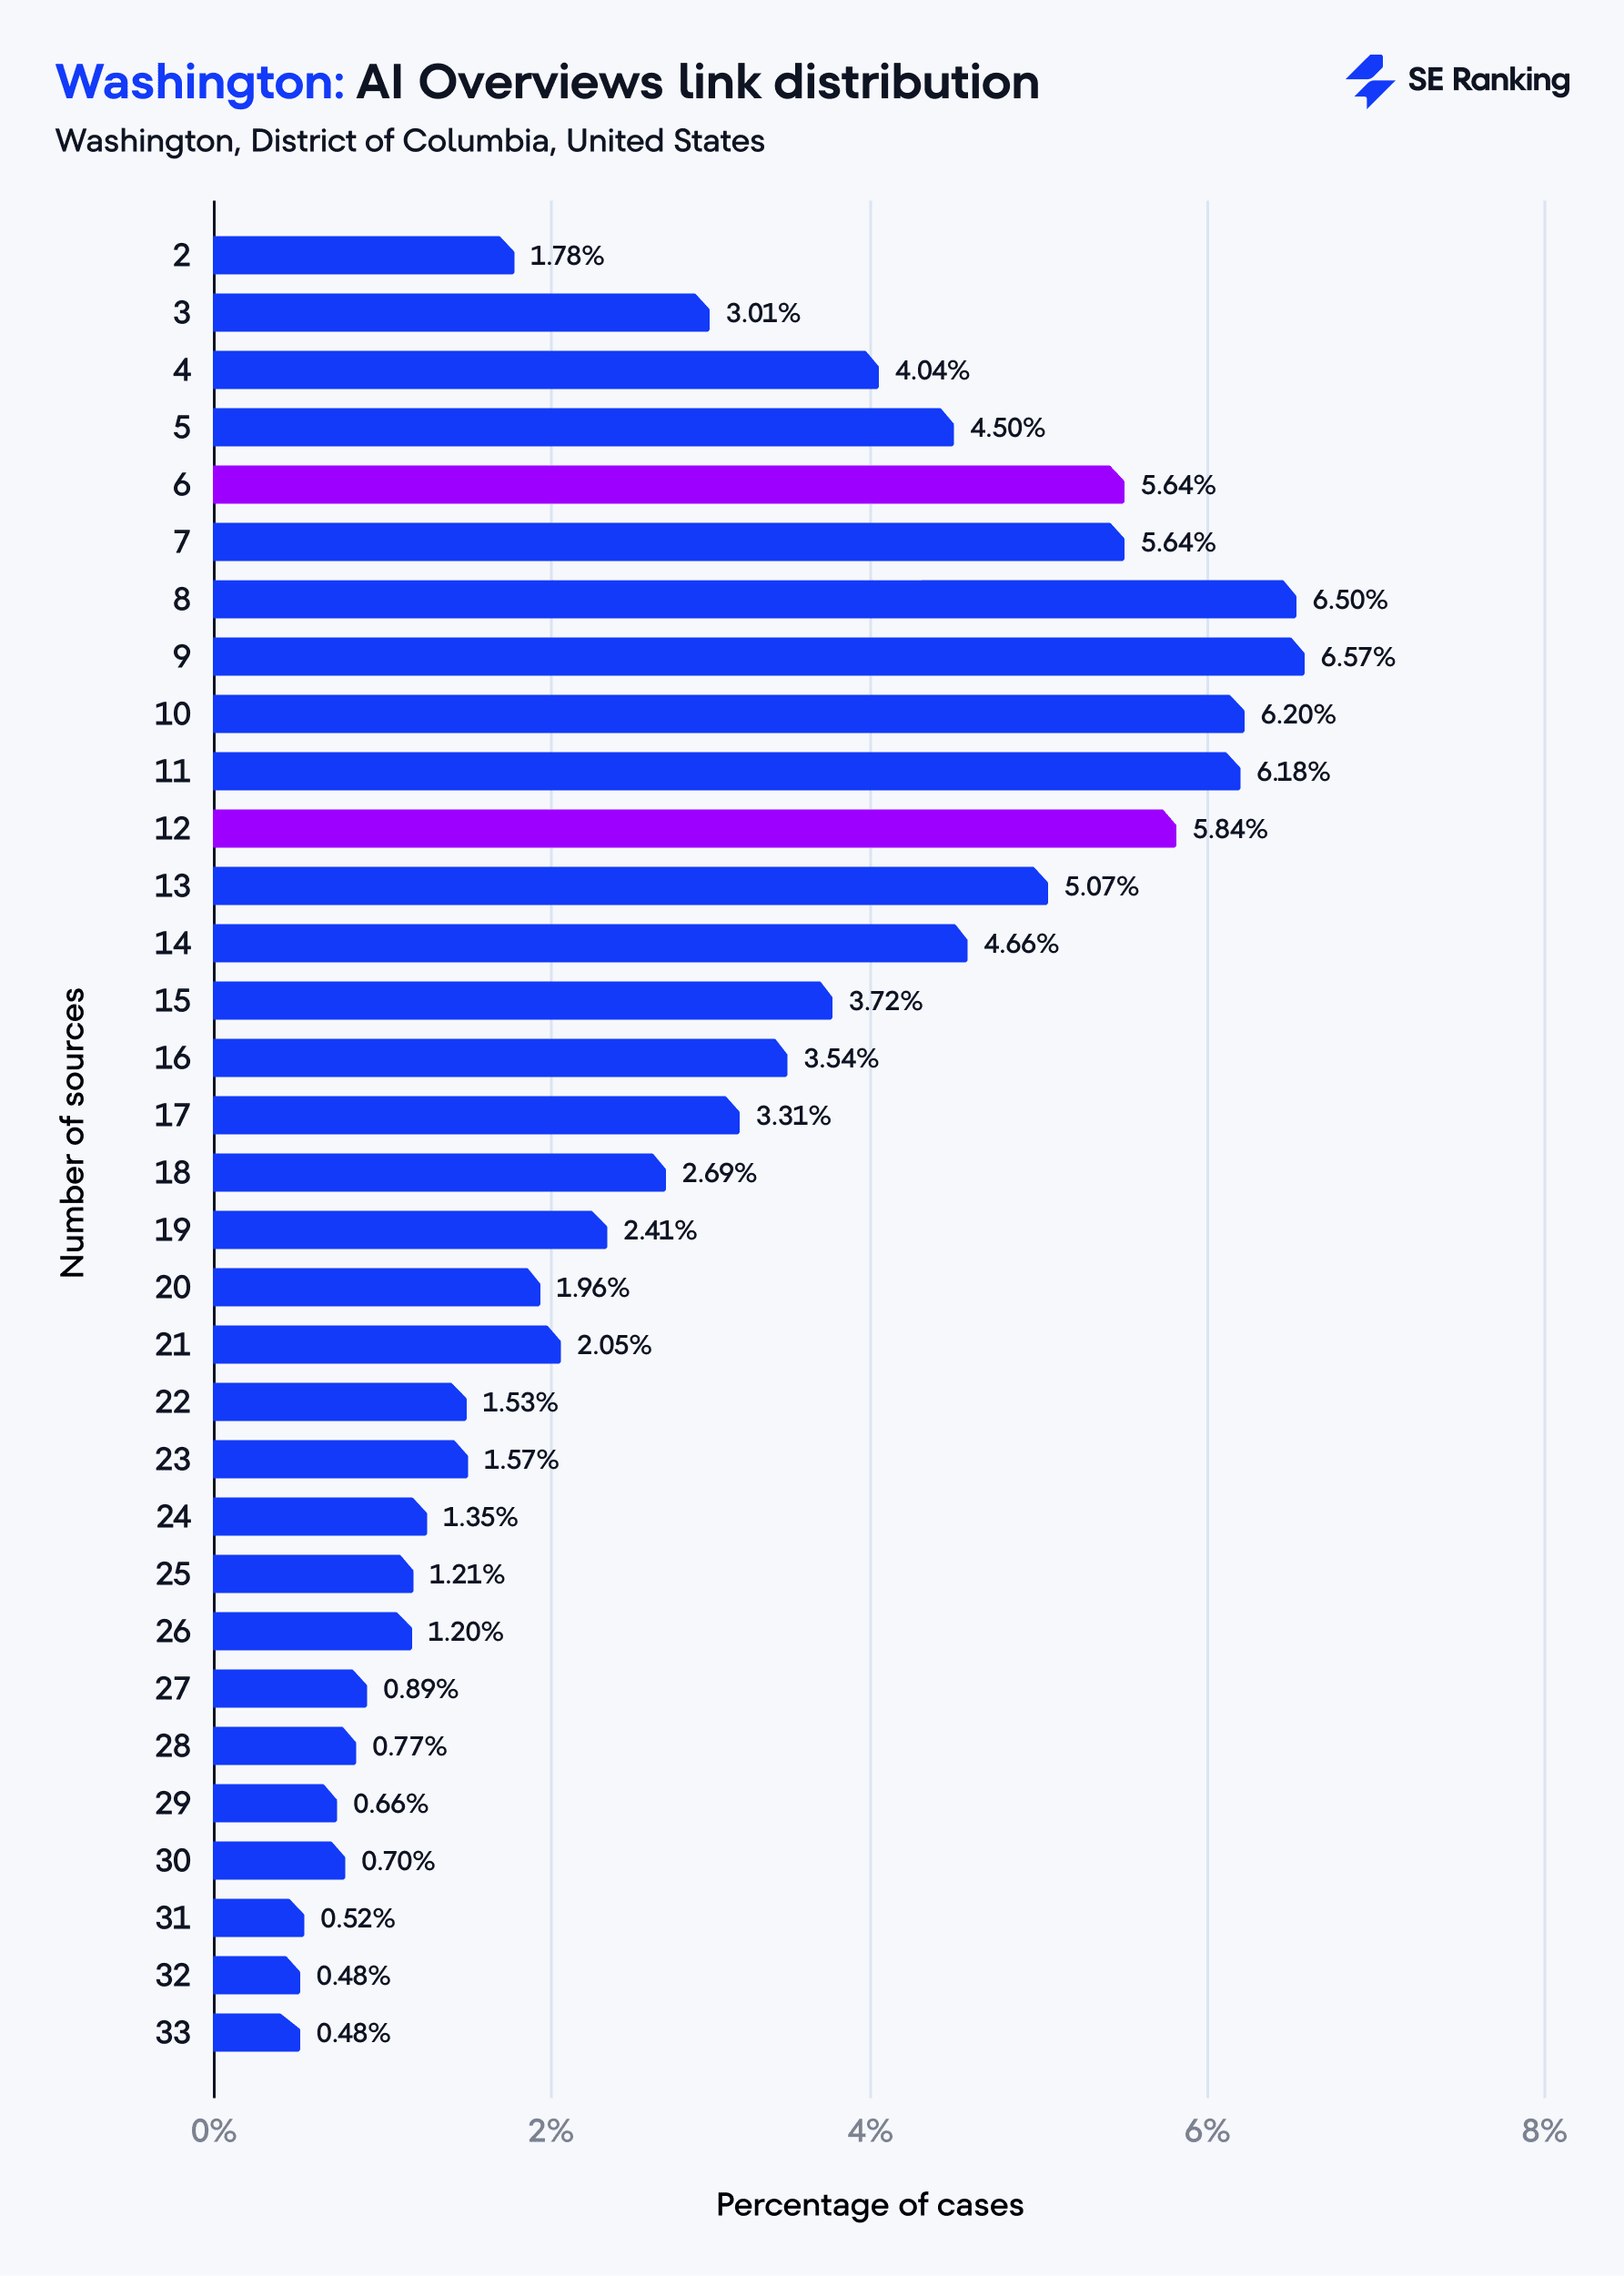
- Responses with over 50 references are rare across all regions, and differences between regions aren’t significant due to their limited frequency.
These observations highlight that while regional differences exist, the general trend in the number of references remains consistent across U.S. states, with a slight regional variation in specific reference counts.
Are there significant differences in AI Overview response lengths between states?
We found no significant differences in text length by state.
Note: The average character and word counts presented below, except for the highlighted differences, have been rounded for clarity.
Character count
- New York, New York: 1,772 characters
- Los Angeles, California: 1,770 characters
- Houston, Texas: 1,764 characters
- Denver, Colorado: 1,764 characters
- Washington, DC: 1,759 characters
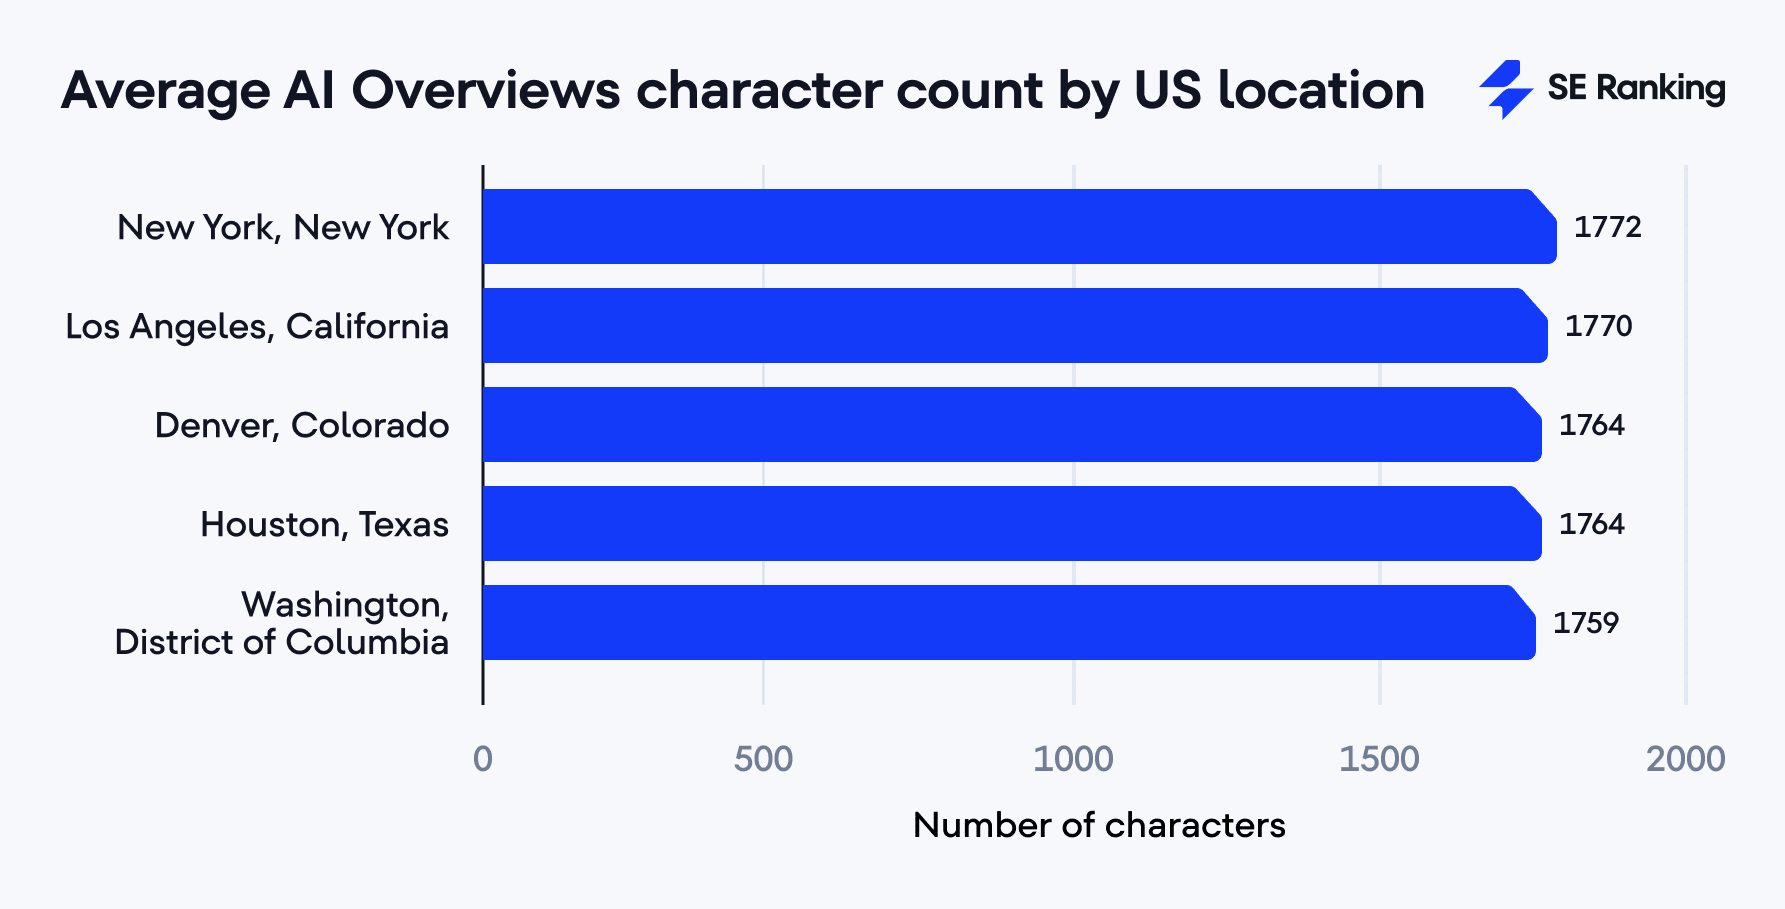
The difference between the longest (New York) and shortest (Washington, DC) responses is only 12.6 characters, less than 1% of the total length.
Given our observations over the past year, the length of AI Overviews has varied quite a bit. It went from as low as 2,633 characters in July 2024 to a peak of 6,142 in August 2024, then dropped to 5,337 in November 2024. As of April 2025, the average length has significantly decreased to 1,766 characters. For SEO specialists, this may point to the growing importance of providing clear and efficient content that answers user queries quickly.
Word count
- New York, New York: 255 words
- Los Angeles, California: 255 words
- Denver, Colorado: 254 words
- Houston, Texas: 254 words
- Washington, DC: 253 words
The difference in word counts is similarly minimal, only 2.38 words (less than 1%) between the highest and lowest averages.
This small variation in character and word count highlights the high consistency and standardization of AIO responses across each state observed. AIO response length doesn’t appear to differ at all by region (at least within the US).
Do AI Overviews appear next to SERP features in each state?
For this analysis, we observed five SERP features that appeared most frequently in Q4 2024. Based on the data combined from all five states (141,507 total AIO appearances), AI Overviews almost always appear with at least one of the five analyzed SERP features, 99.25% of the time (140,444 of cases). Only 0.75% of AIOs appear without any of these SERP features.
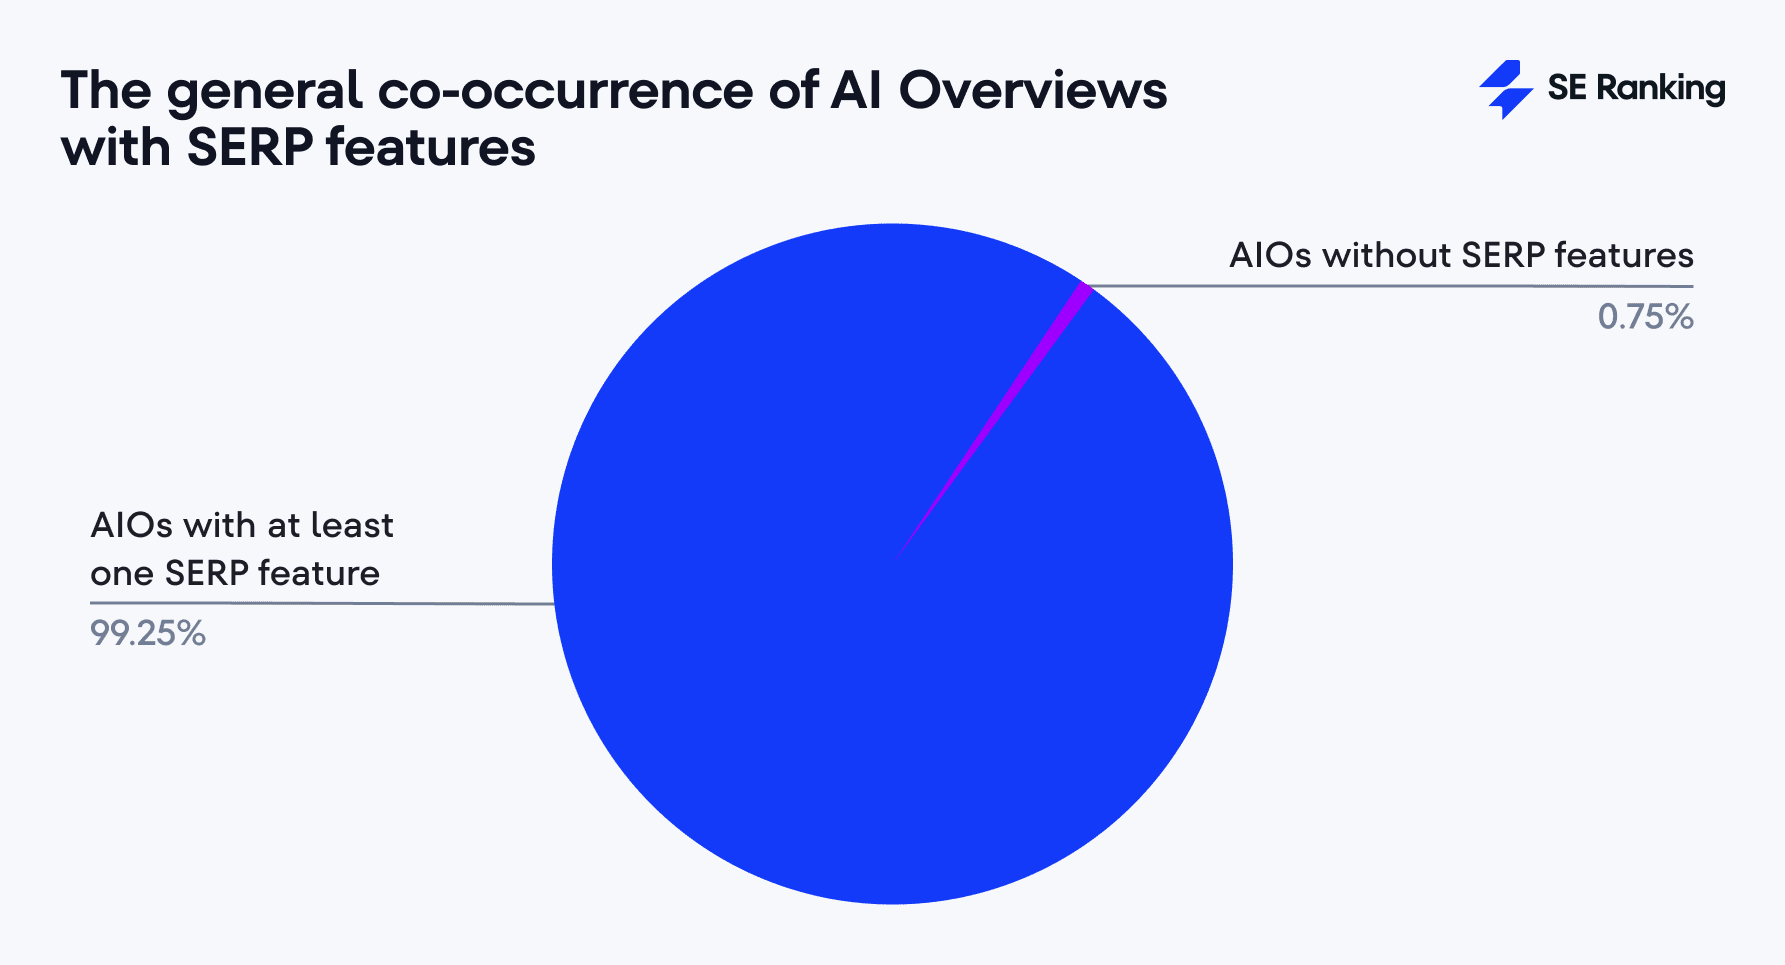
Variation by state is minimal for both AI Overviews with and without other SERP features.
- No SERP features: From 0.70% (Los Angeles) to 0.81% (Denver)
- At least one SERP feature: From 99.19% (Denver) to 99.30% (Los Angeles)
We dived even deeper into the SERP features analyzed to observe the following frequencies.
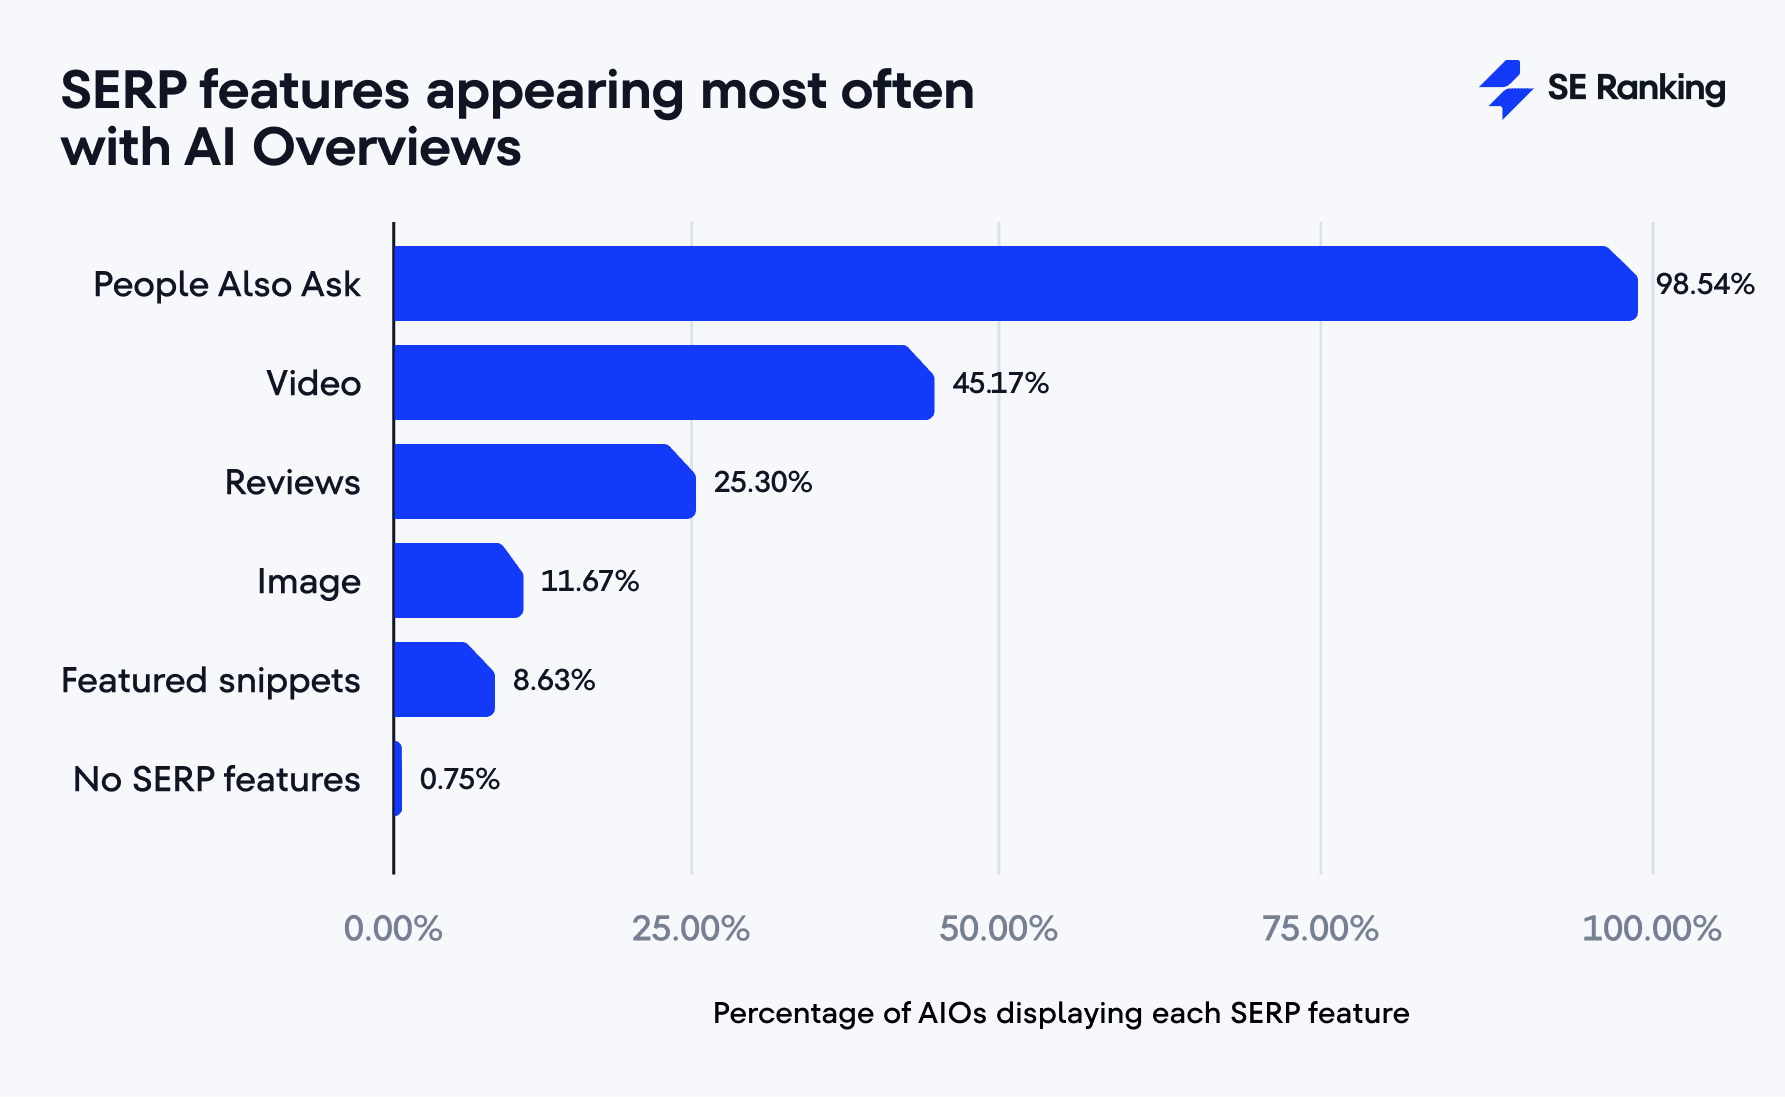
- People Also Ask is by far the most frequent companion to AI Overviews, appearing in 98.54% of cases. This pairing makes sense as both elements are designed to answer user questions and complement each other.
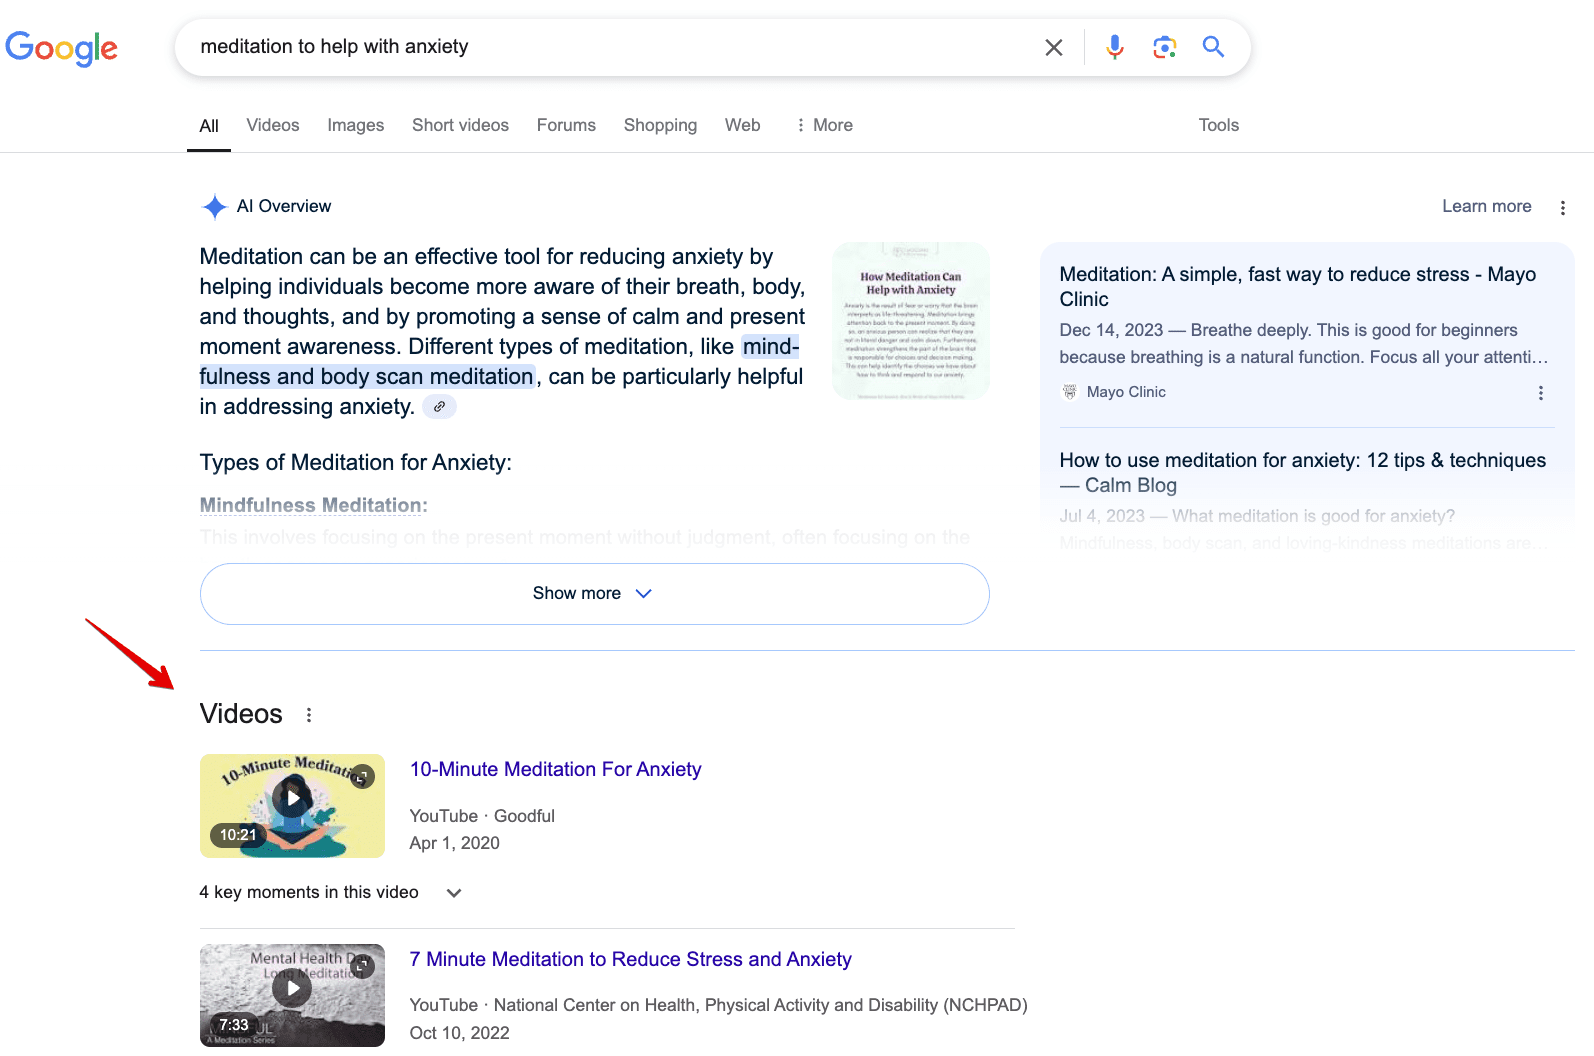
- Video snippets are the second most common feature, appearing next to 45.17% of AI Overviews. This indicates that Google often enhances text-based AI answers with visual content to meet user intent.
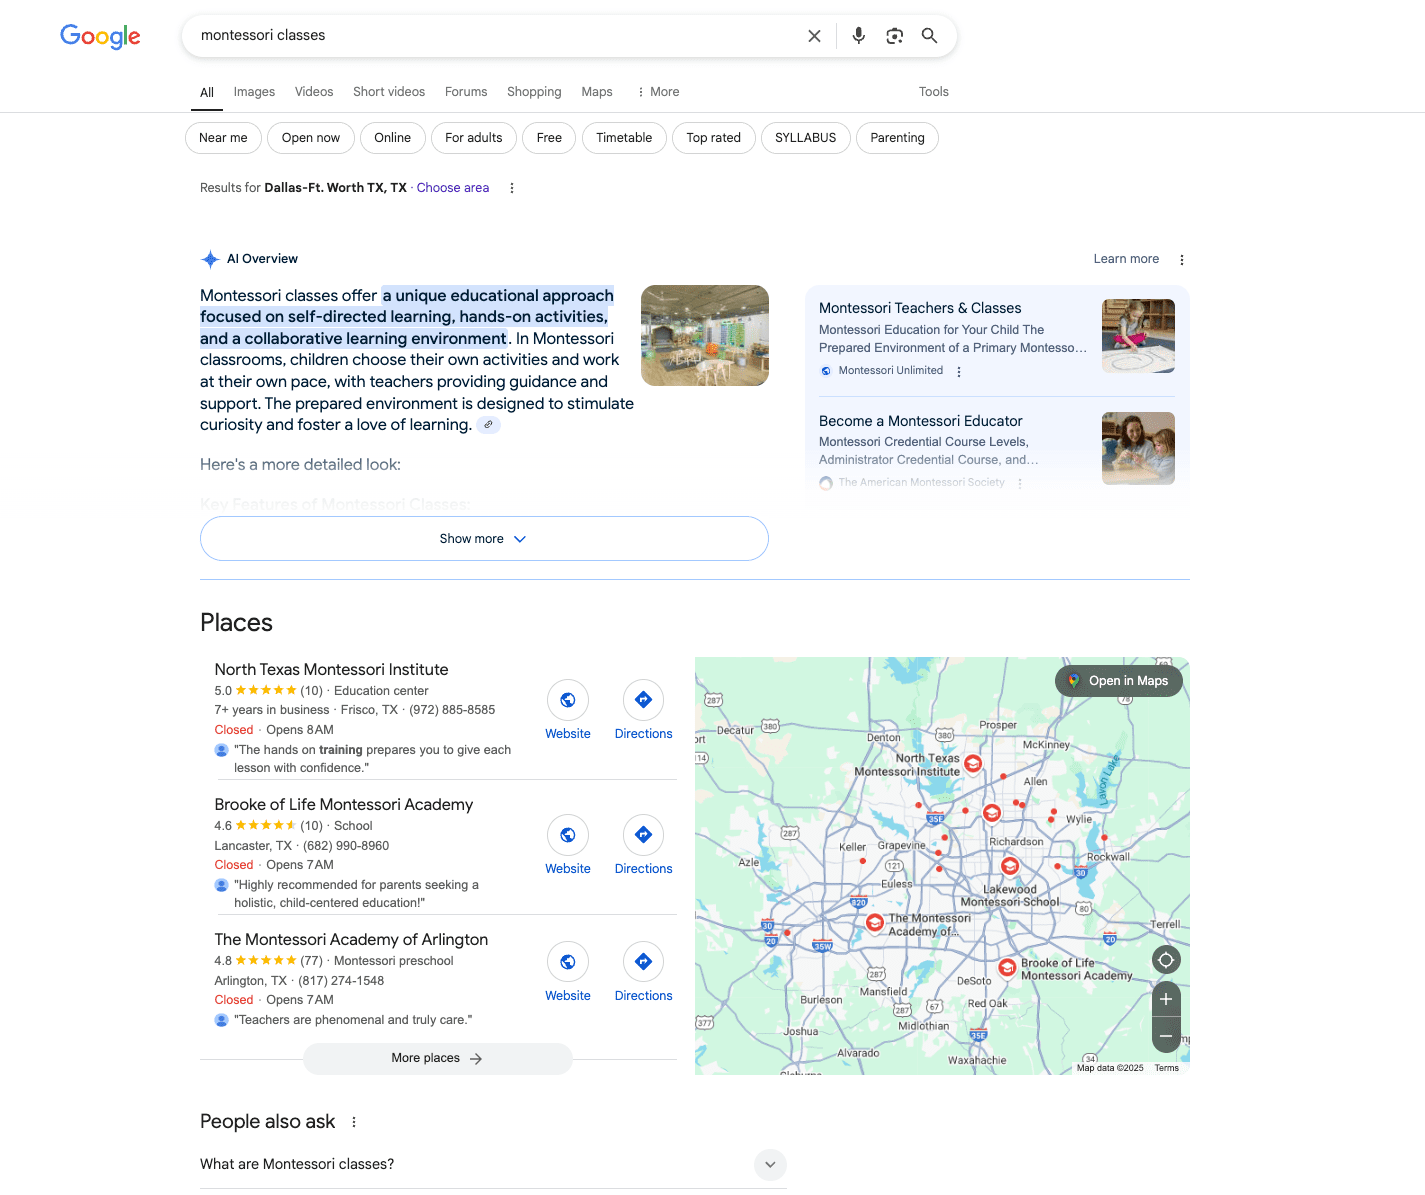
- Reviews appear in 25.30% of cases, typically with queries related to products, services, or businesses where user feedback is valuable.
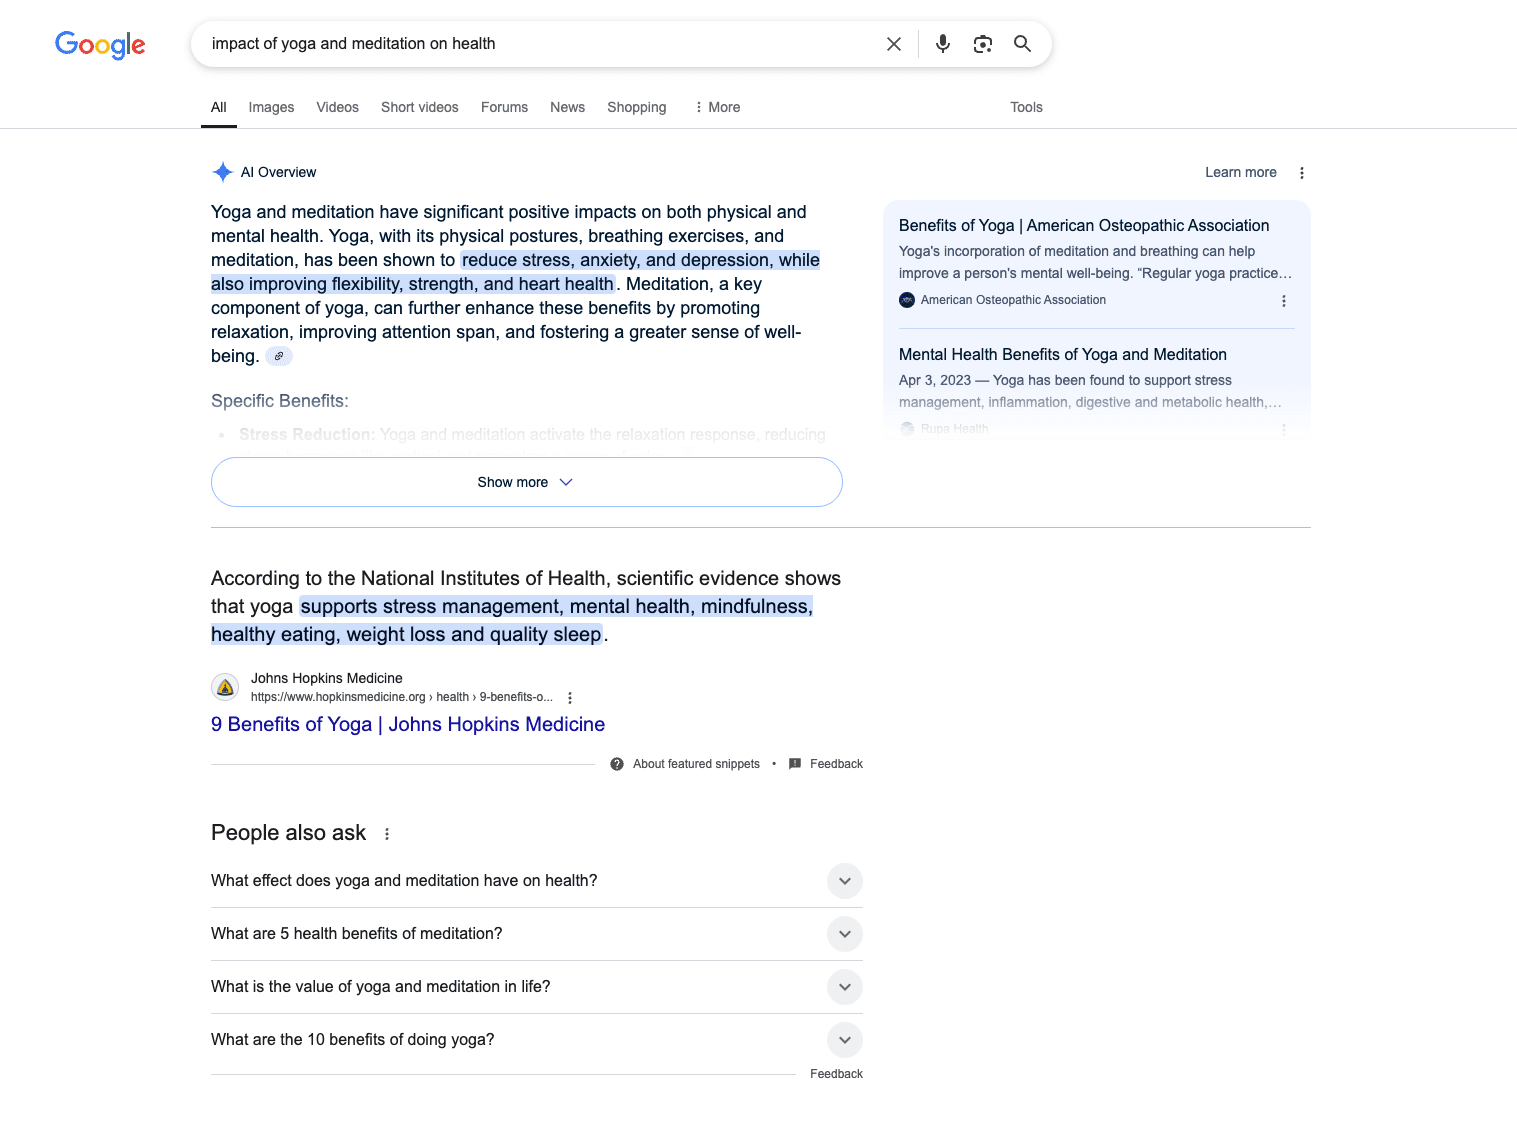
- Images appear in 11.67% of cases, mostly accompanying visual-oriented queries where supplementary images help users better understand the AI-generated content.
- Featured snippets appear side-by-side with AI Overviews in only 8.63% of cases, indicating that Google often chooses between these two answer-focused elements rather than displaying both. This is also nearly 4 times less frequent than we observed earlier for US SERPs.
Location (at least in the US) has minimal impact on these patterns. The variation across the five states observed is extremely small. For instance, People Also Ask ranges from 98.46% (Washington, DC) to 98.69% (Los Angeles). All other features show similarly tiny variations across locations.
Are there any sources in AIO responses that link to Google’s search results?
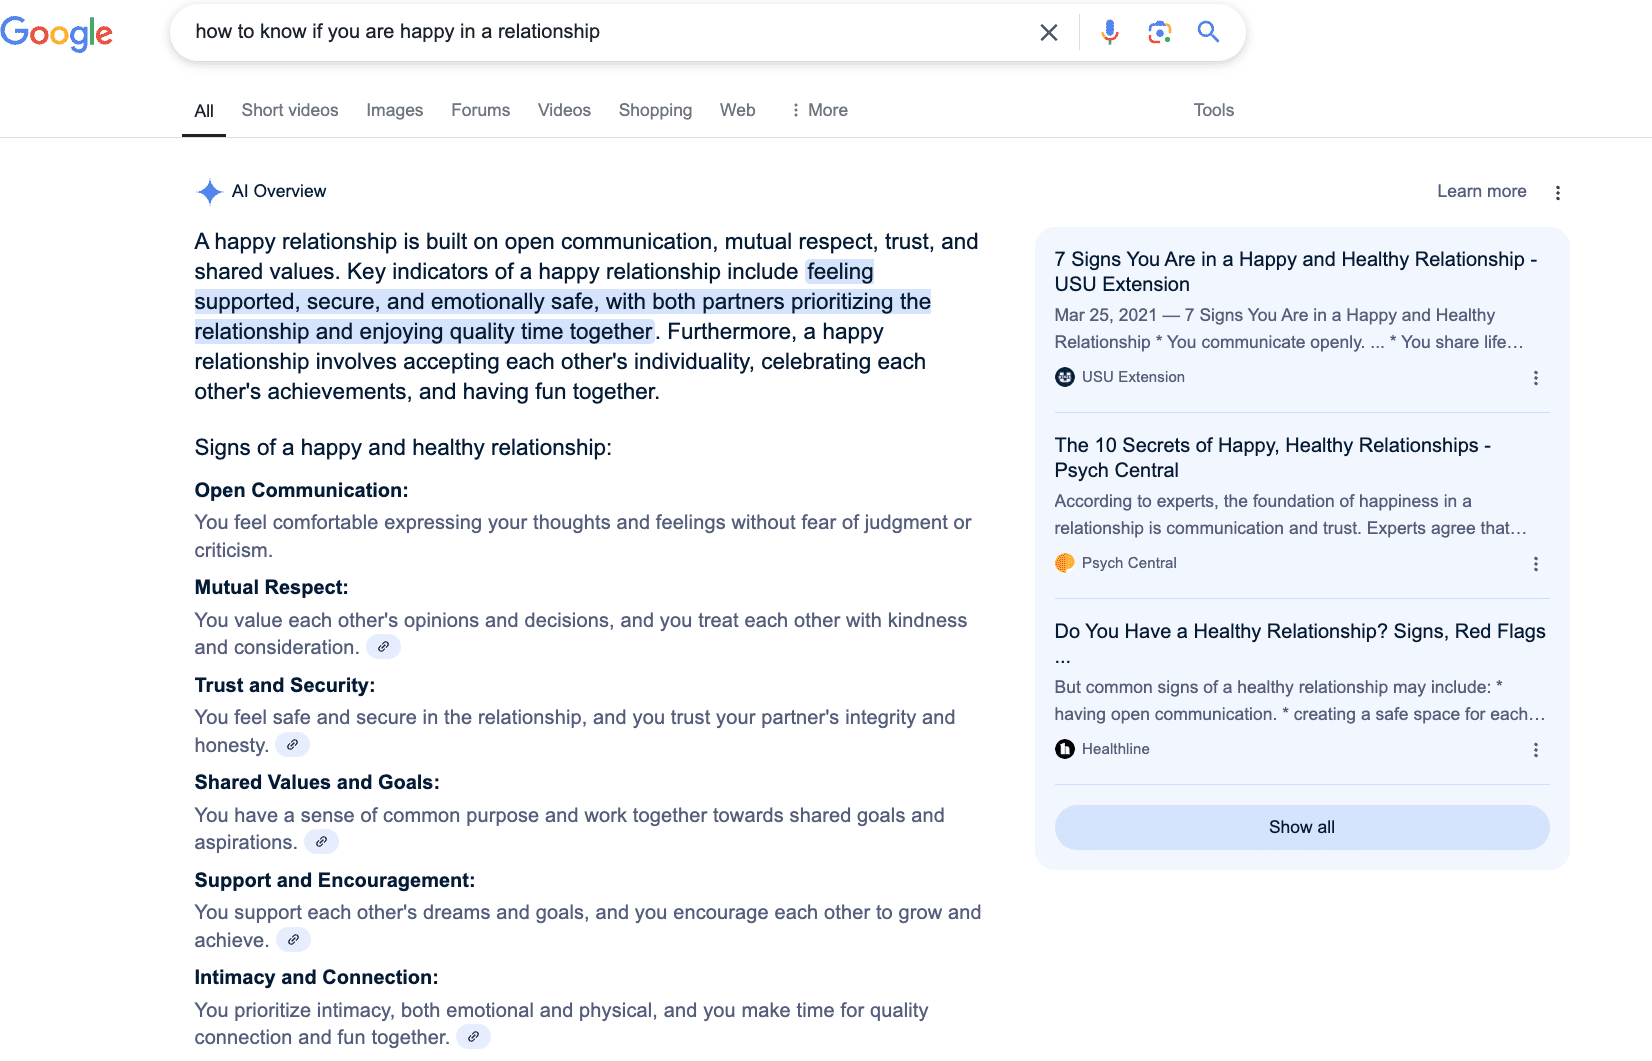
Recently, the SEO community noticed that Google was using “internal links” within the text of AIO answers, redirecting users to organic results. To understand this phenomenon better, we analyzed how often these links appear in AIO responses.
Based on the data combined from all five states (141,507 total AI Overview appearances), our data analysis shows that 43.42% (61,437 times) of AI Overview responses contain links to Google organic results, while 56.58% of responses do not.
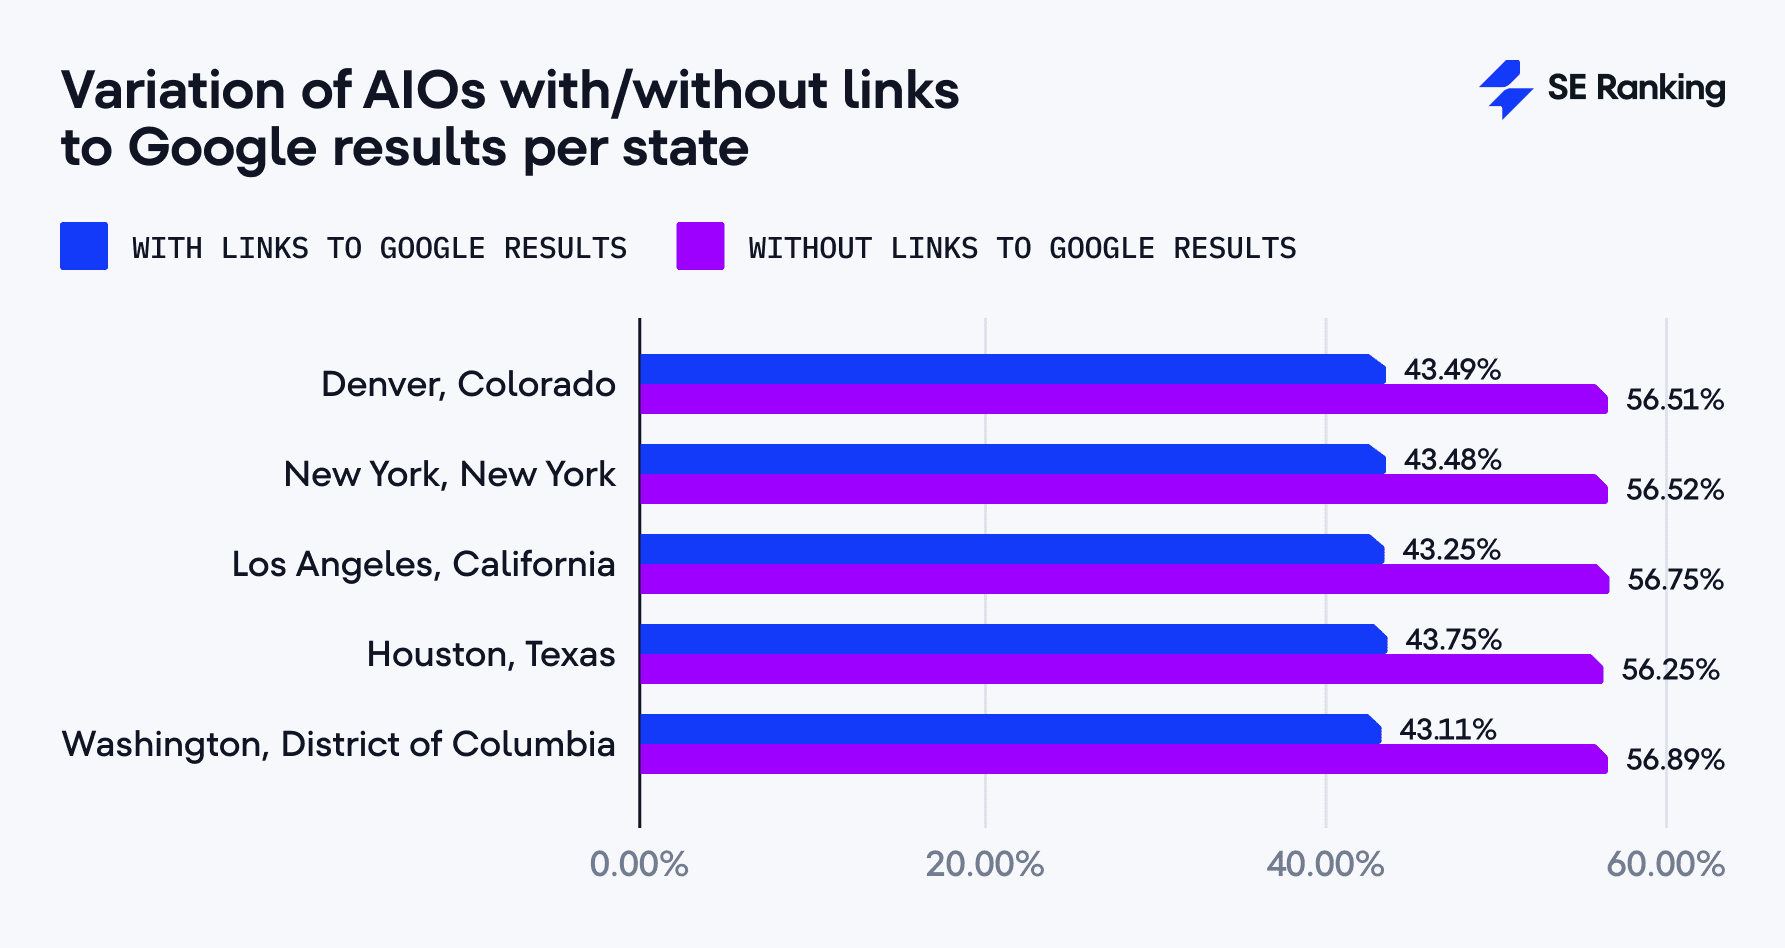
The variation across states is minimal, with responses containing links to Google ranging from 43.11% (Washington) to 43.75% (Houston).
Interestingly, the number of links to Google’s organic results is not limited to one or two links. On average, AIO responses contain 4-6 links to Google’s organic search results, which is a lot, showing Google’s AI-generated answers link back to its resources frequently.
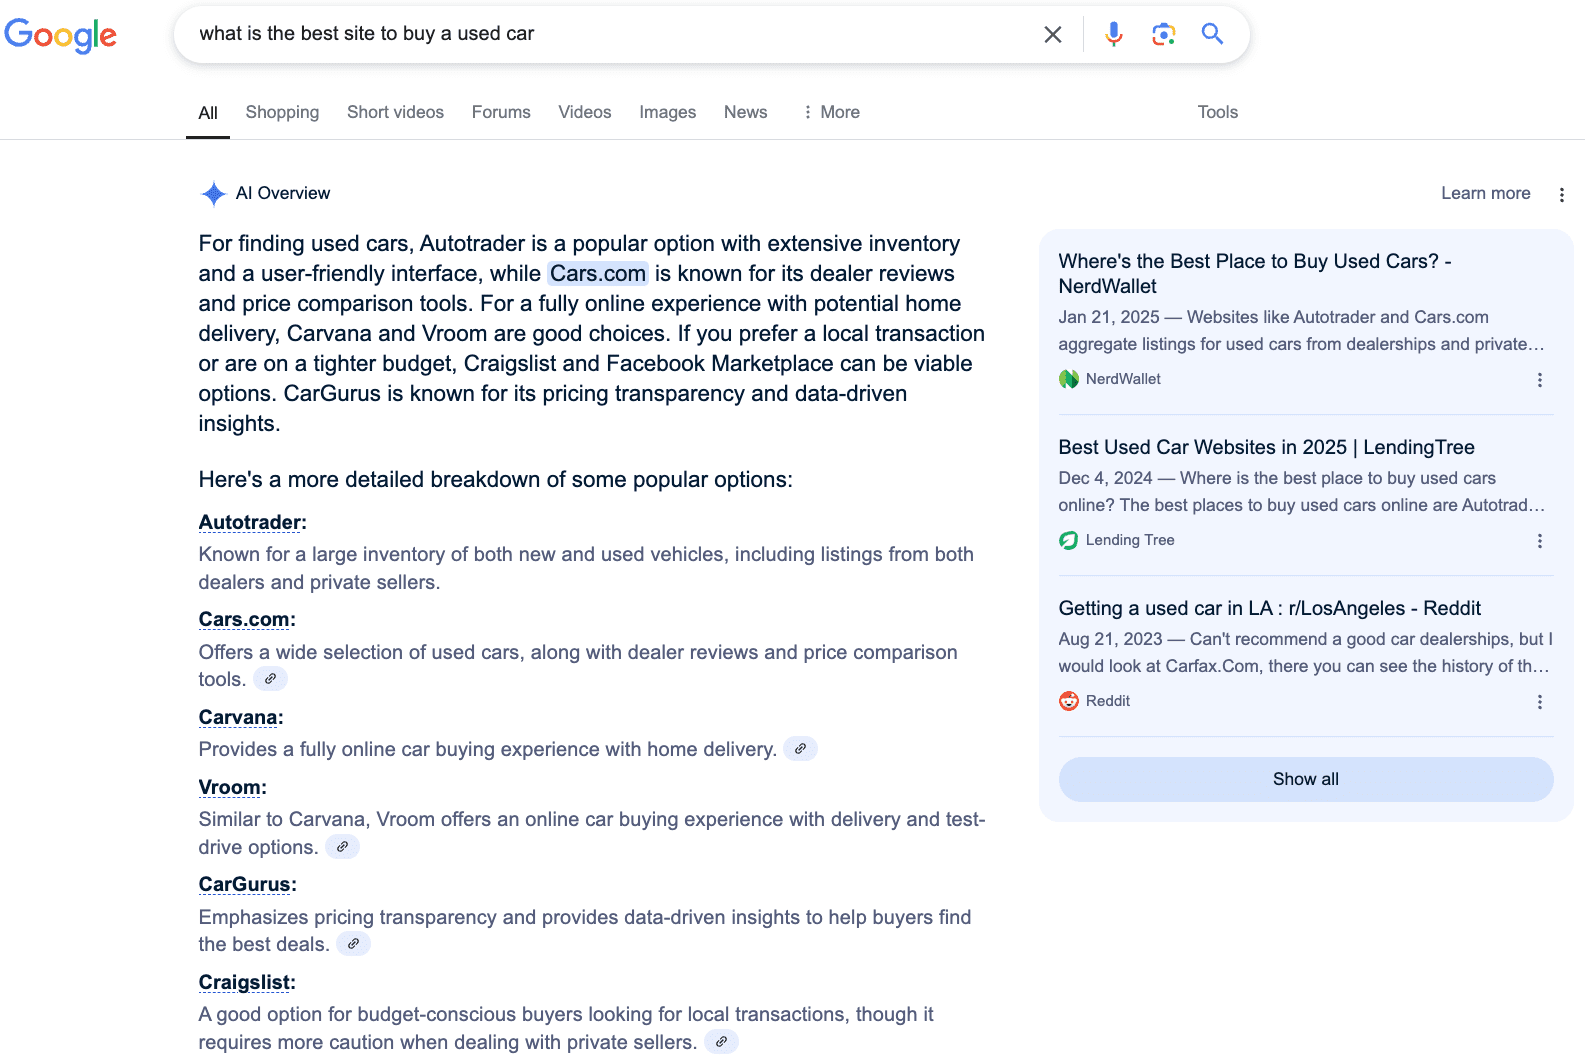
This raises an important question. Could Google’s inclusion of internal links be a way of promoting its own content, or is there another reason behind it? Either way, the fact that Google uses so many internal links in its AIO responses shows its potential impact on how users behave and how SEO strategies are shaped.

Keyword metrics and AIO presence across each observed state
Does keyword search volume impact AIO appearance differently by state?
The data clearly shows that there is an inverse trend between keyword search volume and the percentage of AIOs. As search volume increases, the AIO appearance frequency drops a lot in all regions studied.
Here’s the breakdown by search volume:
- 0-10 search volume: AIOs appear at a 30-31% rate across all regions, with Houston having the highest rate at 31.12%.
- 11-100 search volume: The percentage increases slightly to 31-32%, with Houston again leading at 31.66%.
- 101-1000 search volume: 26-27%
- 1001-10000 search volume: 21-22%
- 10001-100000 search volume: 14-16%
- 100001+ search volume: only 9-12%
Does keyword CPC impact AIO appearance rates differently in each state?
Unlike search volume, the relationship between CPC and AIO appearance is not linear. Overall, in this US-focused dataset, mid-range CPCs ($2–$5) have the highest percentage (32.02%) of AIO appearances. The lowest percentages occur in the $0.5-$1 range (20.07%) and 10+ (17.31%) range.
Here’s a breakdown of AIO appearances by CPC:
- $0-$0.5: 30.19% appear with AIOs
- $0.5-$1: 20.07% appear with AIOs (lowest)
- $1-$2: 26.50% appear with AIOs
- $2-$5: 32.02% appear with AIOs (highest)
- $5-$10: 28.41% appear with AIOs
- $10+: 17.31% appear with AIOs (lowest)
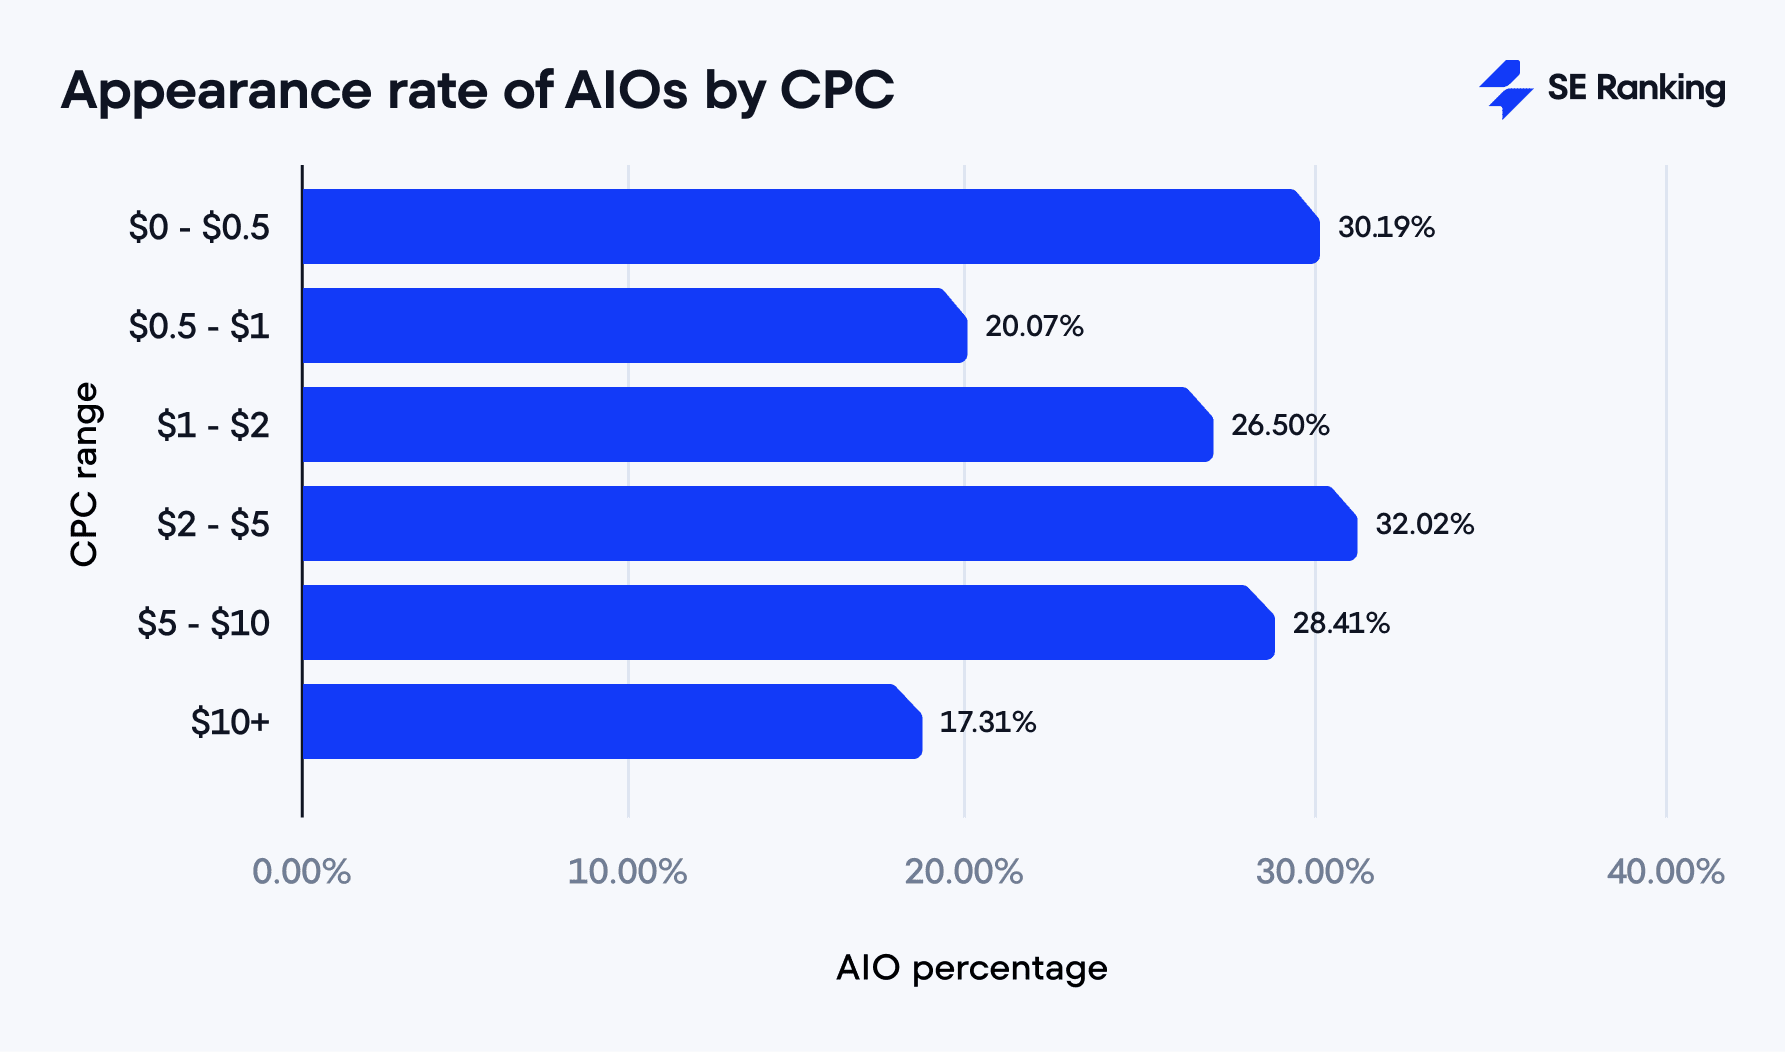
This trend differs slightly from our previous findings, where we observed that lower CPC keywords (especially $0–$0.50) triggered AIOs more than 50% of the time throughout the year. However, our earlier analysis also included the UK market, which may explain part of the difference.
The variation in AIO appearance rates across states is minimal within each CPC range (typically less than a 1.3% variation), showing no significant regional differences.
Does keyword difficulty impact AIO appearance differently by state?
We also analyzed how keyword difficulty (KD) impacts the likelihood of AI Overview appearances across US regions. The relationship is non-linear, similar to CPC trends.
Overall, the highest AIO appearance rates occur for mid-difficulty keywords (21–40). The lowest rates are observed for the most difficult keywords (81–100).
Overall breakdown:
- KD 0–20: 24.4%
- KD 21–40: 33.4% (highest)
- KD 41–60: 27.1%
- KD 61–80: 10.0%
- KD 81–100: 3.7% (lowest)
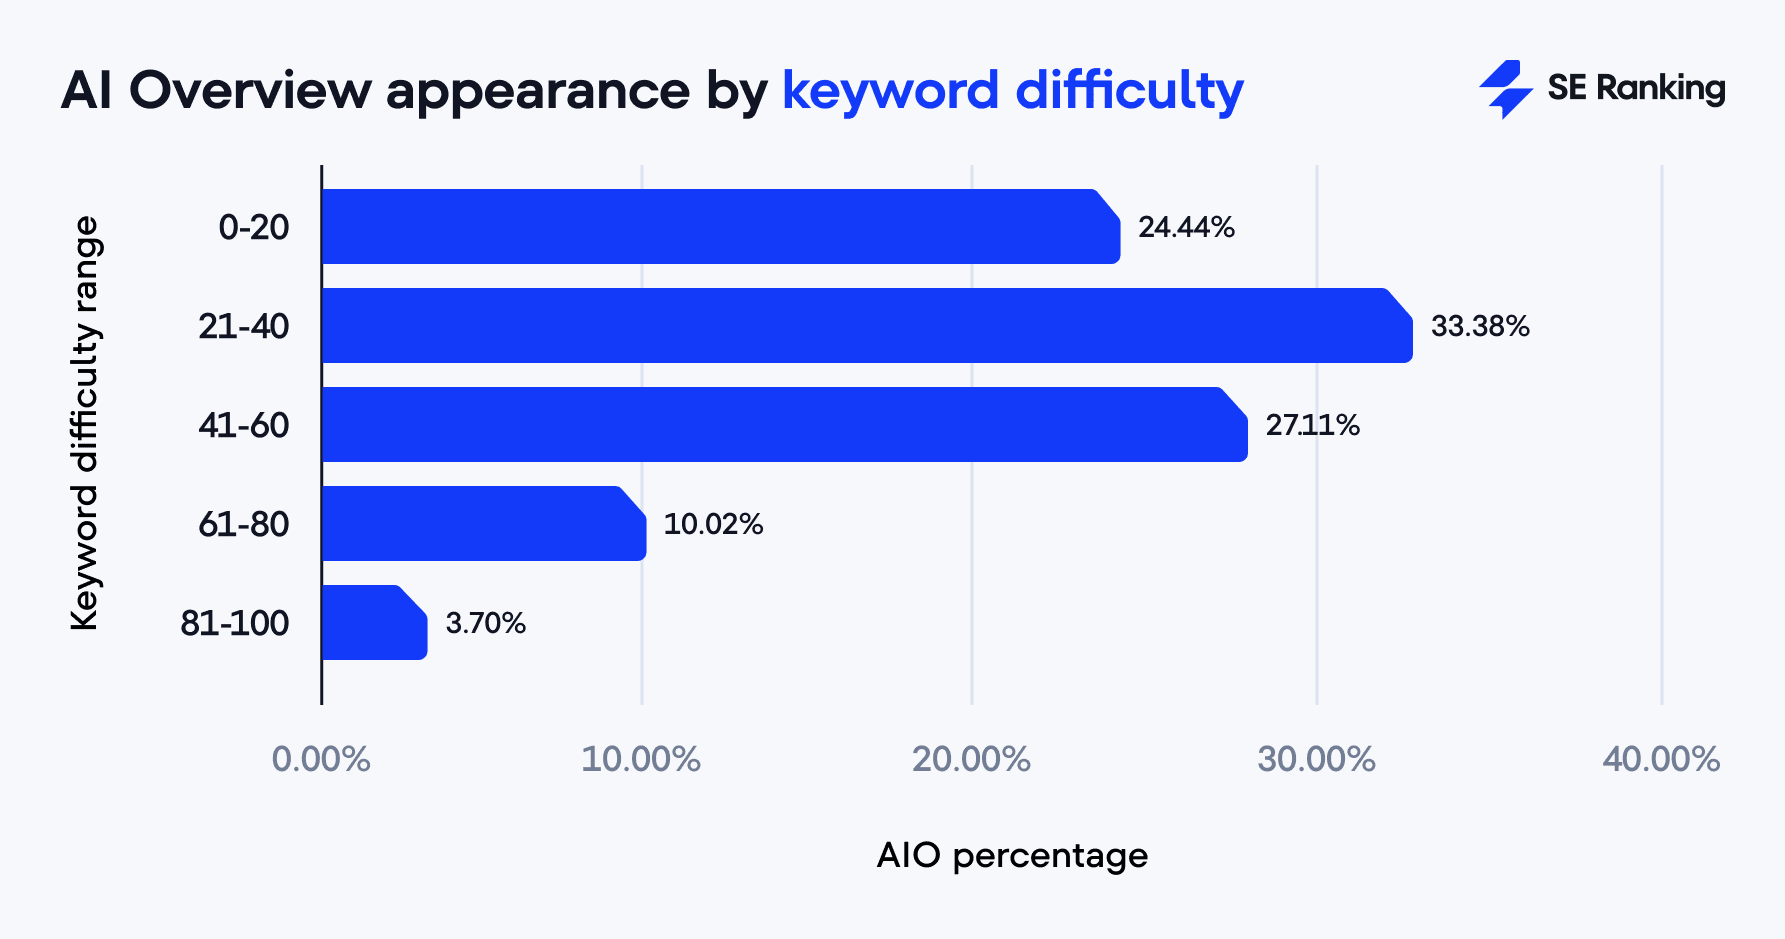
AI Overviews appear the most for medium-difficulty keywords but become much rarer as keyword difficulty rises above 40. The sharp drop suggests that Google may prefer to stick with traditional organic search results for highly competitive queries.
State-by-state differences remain minimal, with a less than 1% variation across regions for each difficulty range.
Does the number of words in a search query affect the appearance of AI Overviews?
Our analysis reveals a clear correlation between query length and the likelihood of triggering AI Overviews in search results. In general, the longer the query, the more likely it is to generate AIOs.
The numbers below represent the overall AI Overview appearance rates across all states. State-by-state analysis shows minimal variation in this pattern. The difference between states is typically less than 3% for any given query length. All states show the same clear upward trend as the query length increases.
Here’s a breakdown of our findings:
- Single-word queries: 12.78%
- Two-word queries: 26.82%
- Three-word queries: 25.59%
- Four-word queries: 25.82%
- Five-word queries: 29.39%
- Six-word queries: 37.37%
- Seven-word queries: 48.85%
- Eight-word queries: 55.22%
- Nine-word queries: 63.55%
- Ten-word queries: 69.21%
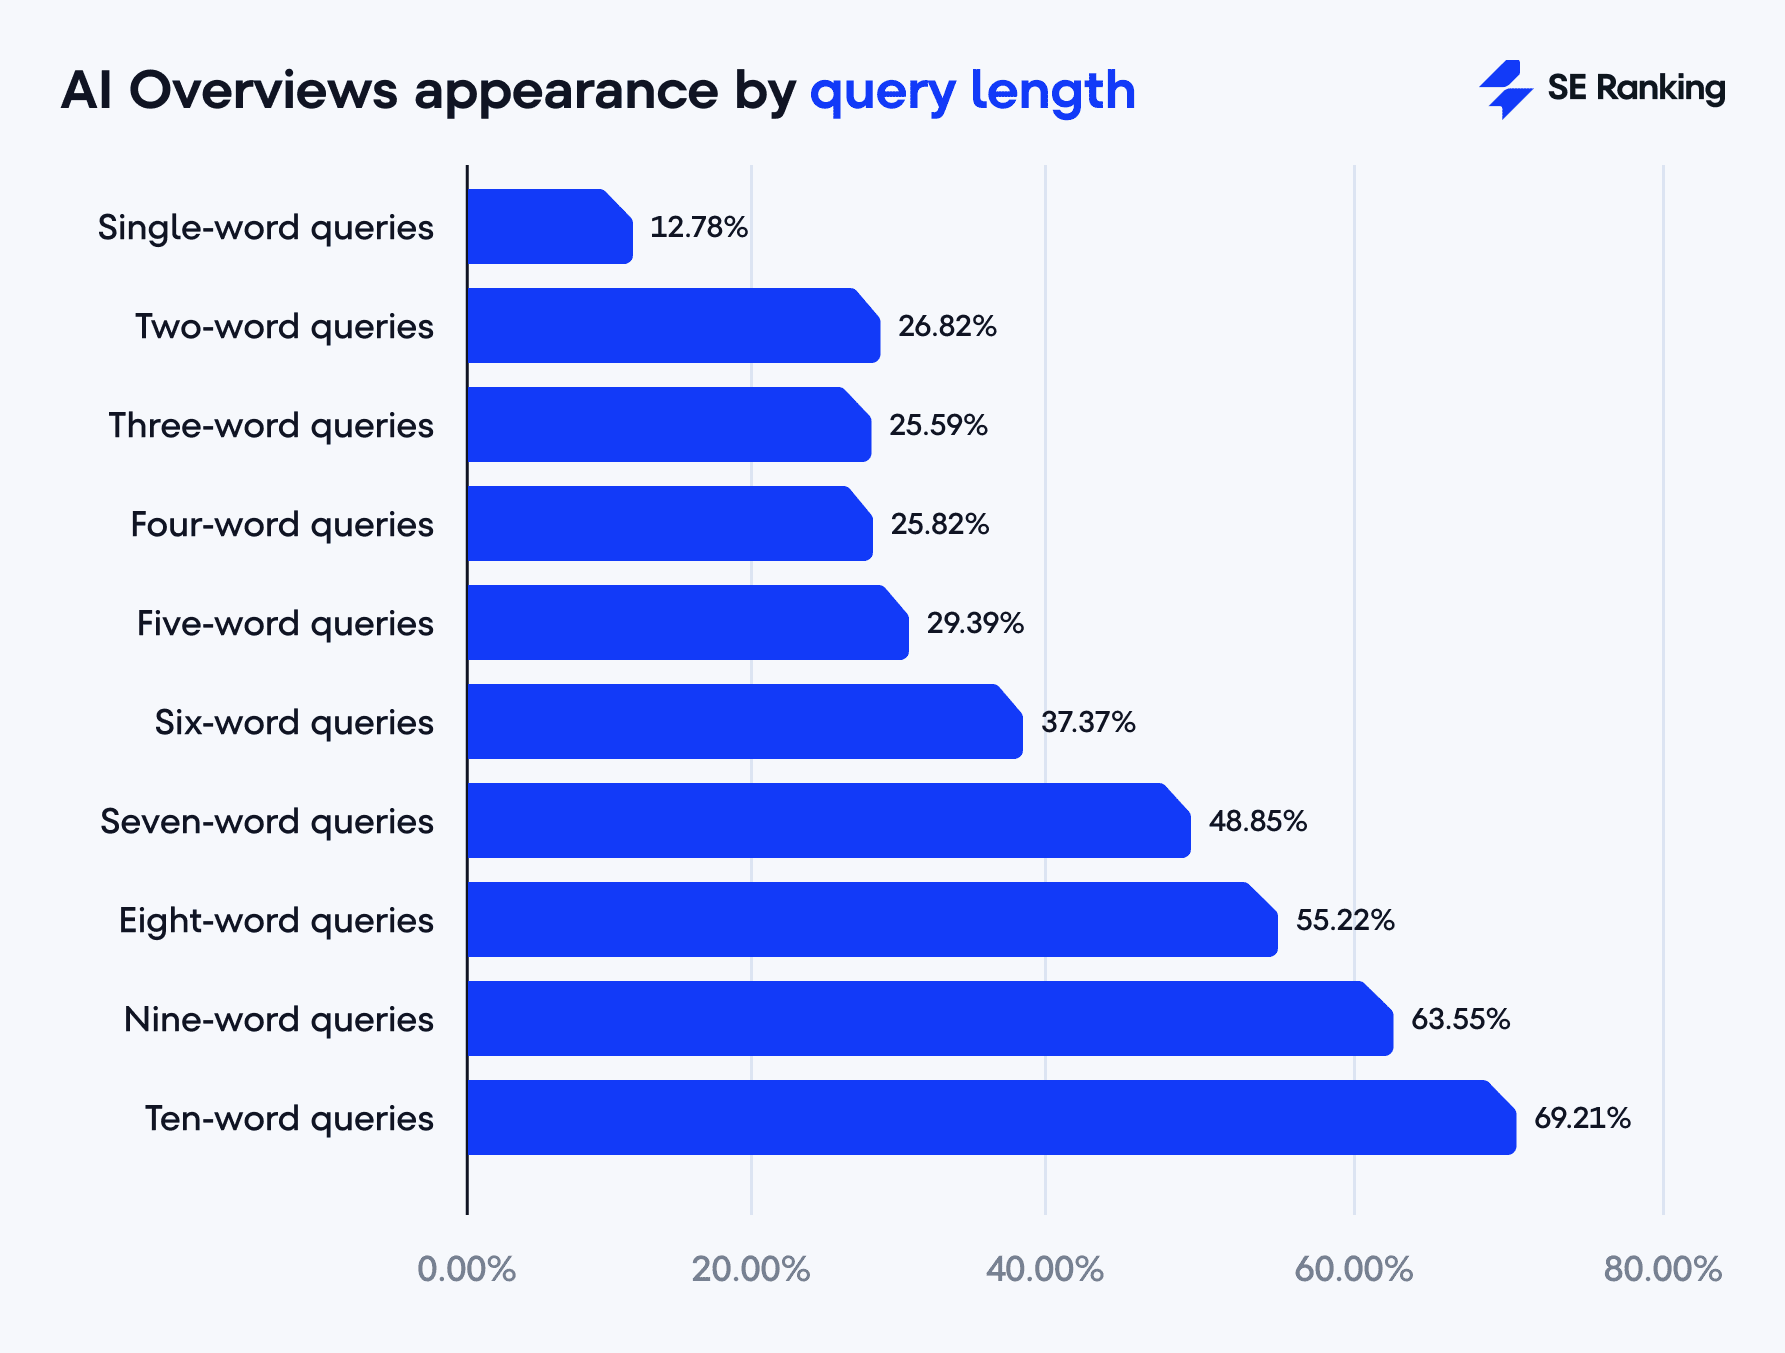
This trend reveals several key patterns:
- There’s a major jump from one-word to two-word queries (12.78% to 26.82%), more than doubling the AIO appearance rate.
- A slight plateau follows for 2–4 word queries, hovering around 25–27%.
- Starting from 5+ words, AIO appearance rates steadily climb with each additional word.
- The biggest leaps occur between 6-7 words (+11.48%) and 8–9 words (+8.33%).
- Ten-word queries show the highest AIO appearance rate at 69.21%, more than five times higher than single-word queries.
As mentioned earlier, high-volume keywords are less likely to trigger AIOs. This matches what we observe with the query length trend. Shorter queries (1–2 words) often have higher search volumes with lower AIO appearance rates. Long-tail queries (5+ words) have lower search volumes but trigger AIOs far more often.
This data signals an important call to action for websites looking to be cited in AIOs: focus on relevant keyword clusters to your business, and aim to cover them—and their subclusters—as fully as possible. By targeting a diverse range of long-tail keywords within these different clusters, websites can boost their chances of appearing in AI answers.
AI Overview sources and key citation patterns by state
Does the average length of AI Overviews influence how many sources it cites?
Yes, and quite significantly. Our data shows a strong positive correlation: the longer the answer, the more sources it includes. For example:
- Answers under 600 characters include an average of 5.31 sources.
- Answers in the 6600–7200 character range jump to 28 sources. That’s more than a 5x increase.
The most noticeable spike happens in the medium-length range: answers between 3000 and 3600 characters already cite around 19.76 sources, nearly 4x more (from 5.31 to 19.76) than the shortest ones (up to 600 characters).
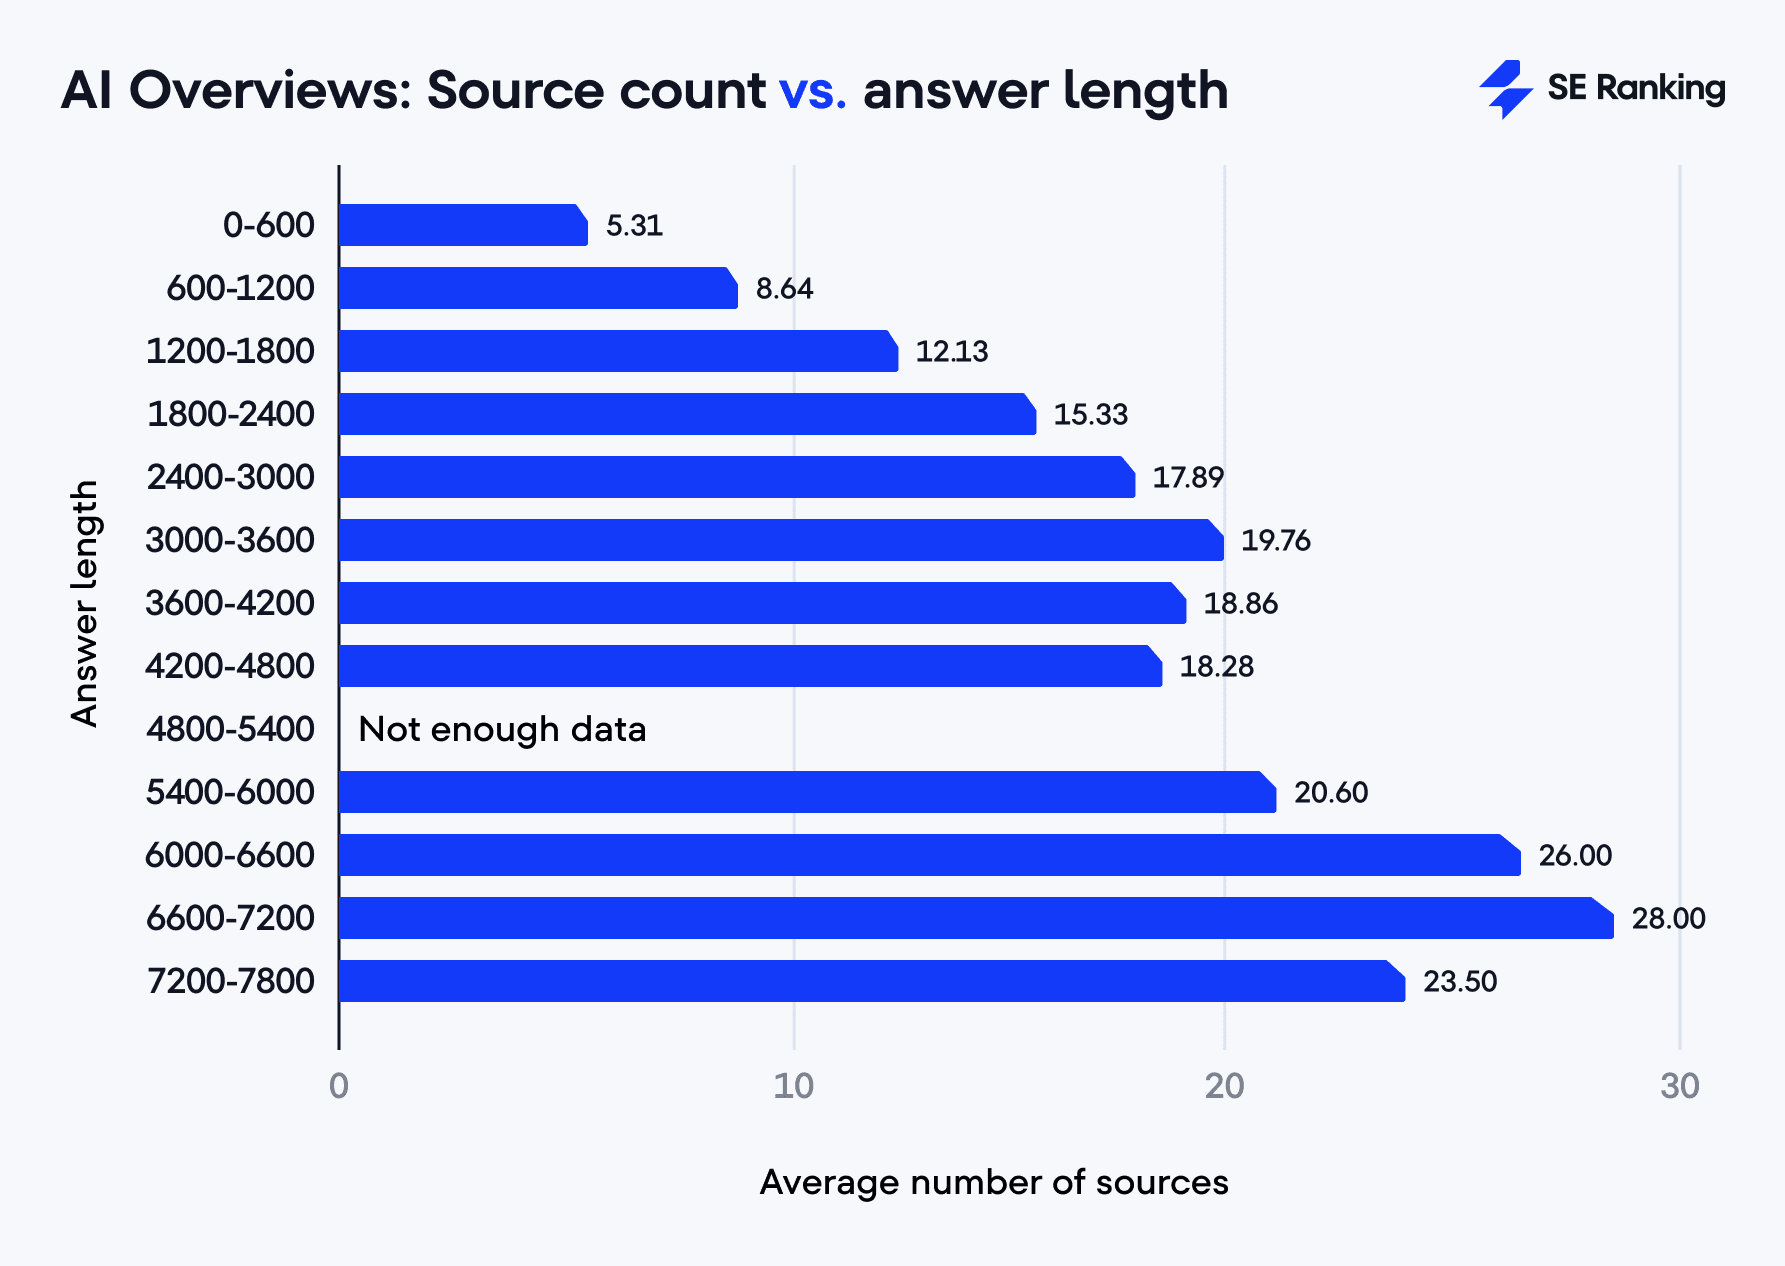
This is particularly interesting when compared to our earlier comparison of AI search engines (the data collected for a different keyword set during the period of 26.02.2025-03.03.2025), where we saw Google AIOs generating 9.26 links for responses averaging just 977 characters. Our current analysis shows that as the response length increases, so does the number of references.
What are the top-linked websites in AI Overviews for each state?
Google.com is the absolute leader in all five states studied, with mentions ranging from 82,685 (Houston) to 79,139 (New York). Regional variation has little to no influence on which domains get cited.
The other top 9 linked domains (nearly identical across locations) are:
- YouTube.com (linked from 5521 to 5711 times)
- Reddit.com (linked from 4573 to 4850 times)
- Quora.com (linked from 4658 to 4691 times)
- Indeed.com (linked from 4453 to 4727 times)
- En.wikipedia.org (linked from 4182 to 4450 times)
- Linkedin.com (linked from 3520 to 3654 times)
- Healthline.com (linked from 3084 to 3229 times)
- Coursera.org (linked from 2521 to 2673 times)
- Investopedia.com (linked from 2033 to 2081 times)
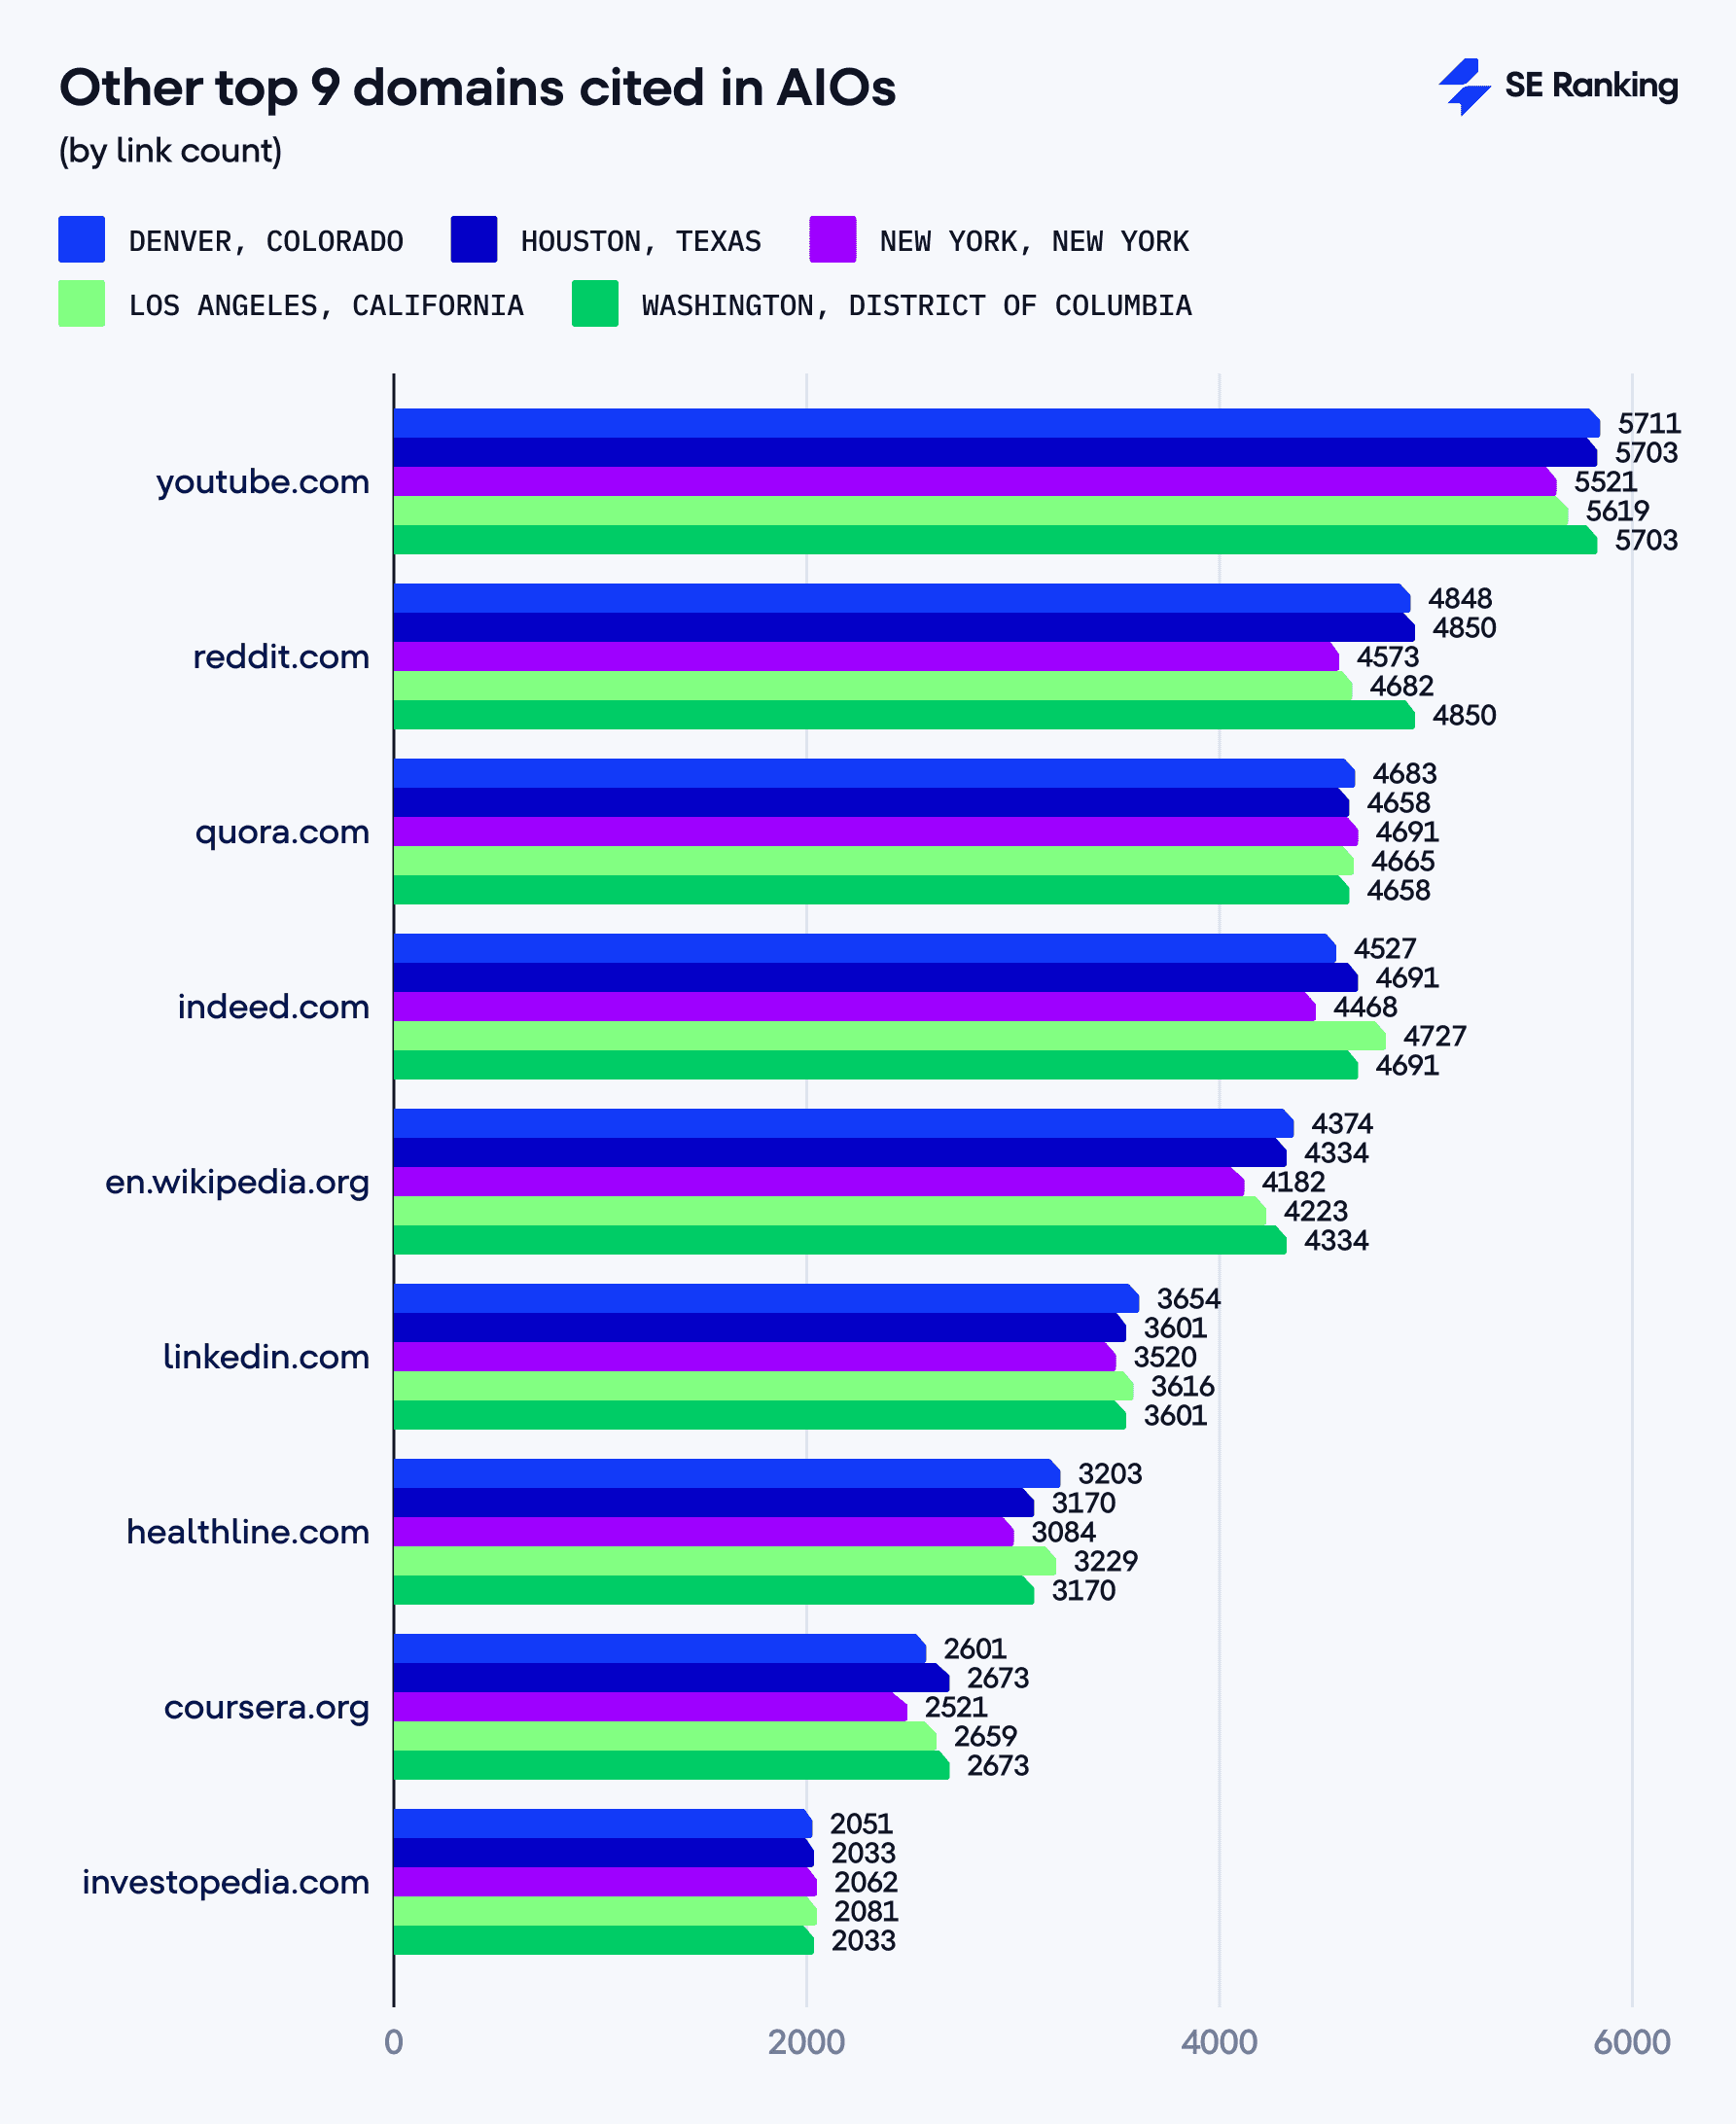
This points to a standardized source selection within Google’s AI Overviews. Geographic location doesn’t significantly influence which domains are referenced.
Reddit and Quora are also back in the game. In last year’s analysis, both platforms had virtually disappeared from AIOs, with only minimal signs of a return in link mentions. We first noticed their gradual return when comparing AIOs with ChatGPT, Bing Copilot, and Perplexity between February and March 2025, where they appeared in lower positions. Now, they’ve climbed to the top citation spots, coming after Google.com and Youtube.com.
When looking at the percentage of responses that mention these domains, Google.com dominates at ~44% of all responses across all locations.
The next tier of domains each appear in about 13% of responses across all states observed:
- Reddit.com (13.20%-13.38% of responses)
- Quora.com (13.28%-13.75% of responses)
- Youtube.com (13.11%-13.50% of responses)
- En.wikipedia.org (12.83%-13.32% of responses)
How do cited domains perform by traffic, keywords, referring domains, and backlinks?
We used SE Ranking’s Competitor Analysis and Keyword Research tools to examine the domains featured as sources in AI answers.
Traffic data
The overall traffic distribution shows that 25.30% of domains (21,151) receive 1,001-10,000 visits.
- 15,887 domains (19.00%) fall into the 101–500 visits range.
- 17,564 domains (20.90%) receive 0–100 visits, making up the low-traffic segment.
- 12,299 domains (14.70%) get more than 50,000 visits, highlighting a notably high-performing segment.
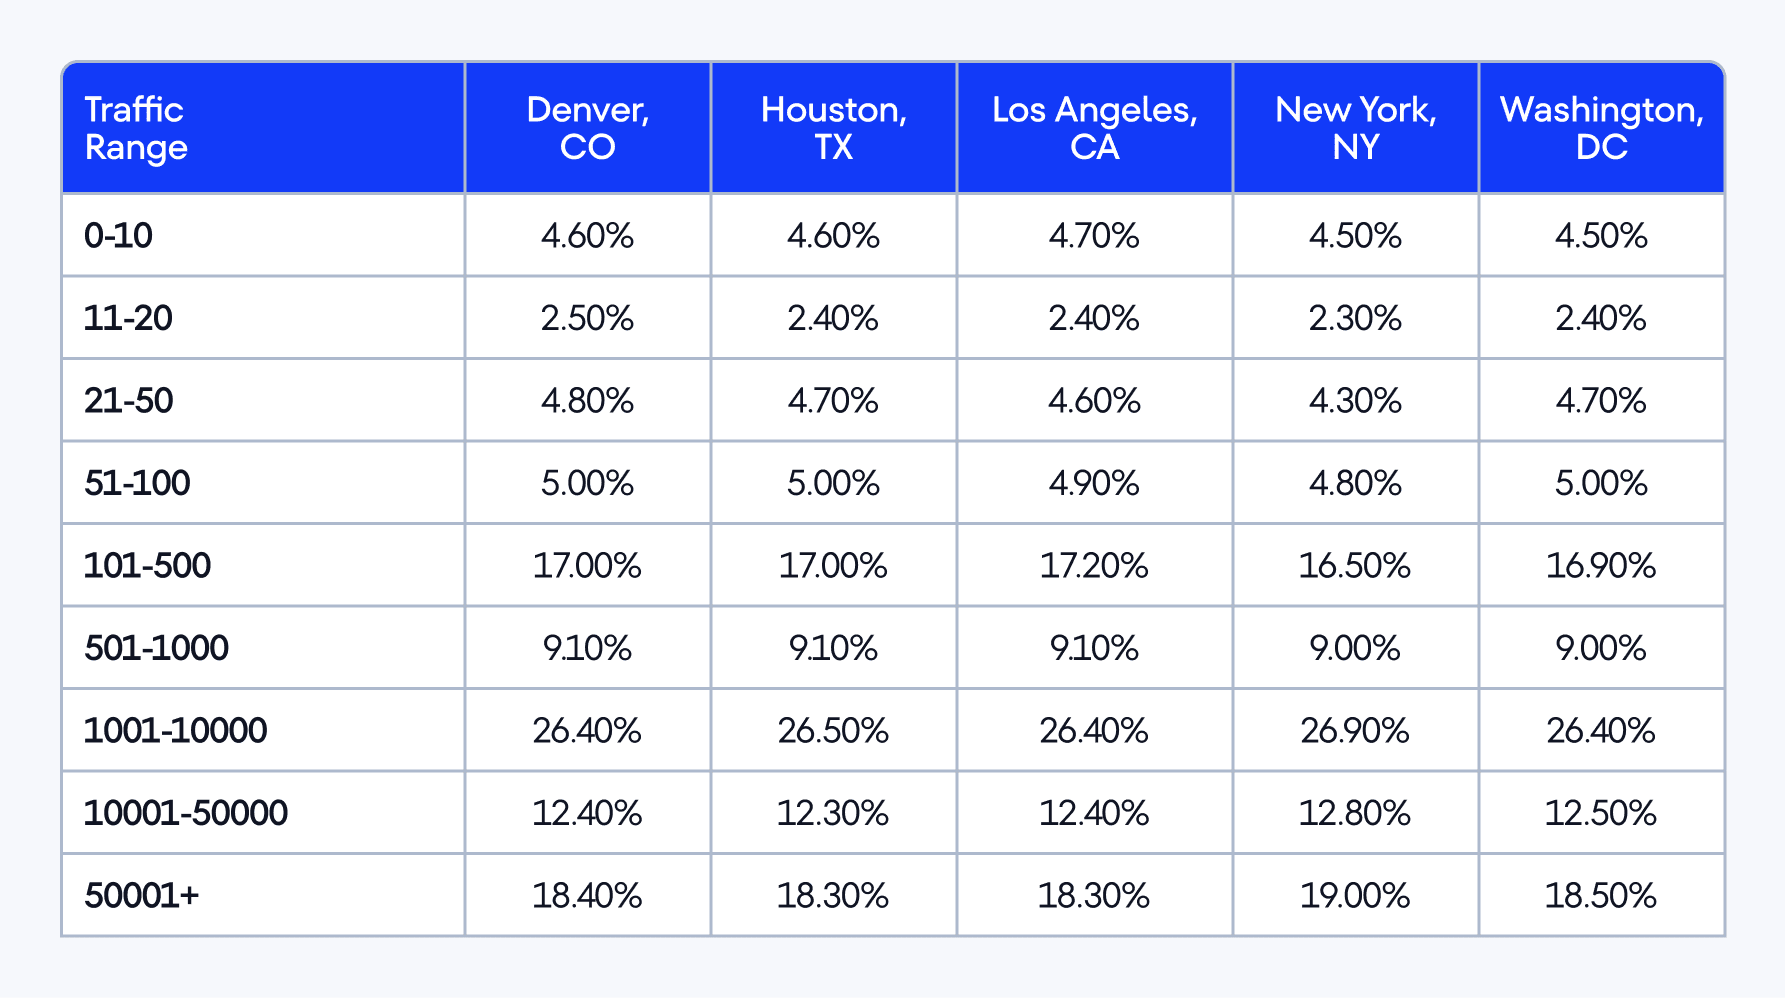
When looking at state-by-state data, we saw only slight differences in traffic patterns across all five locations.
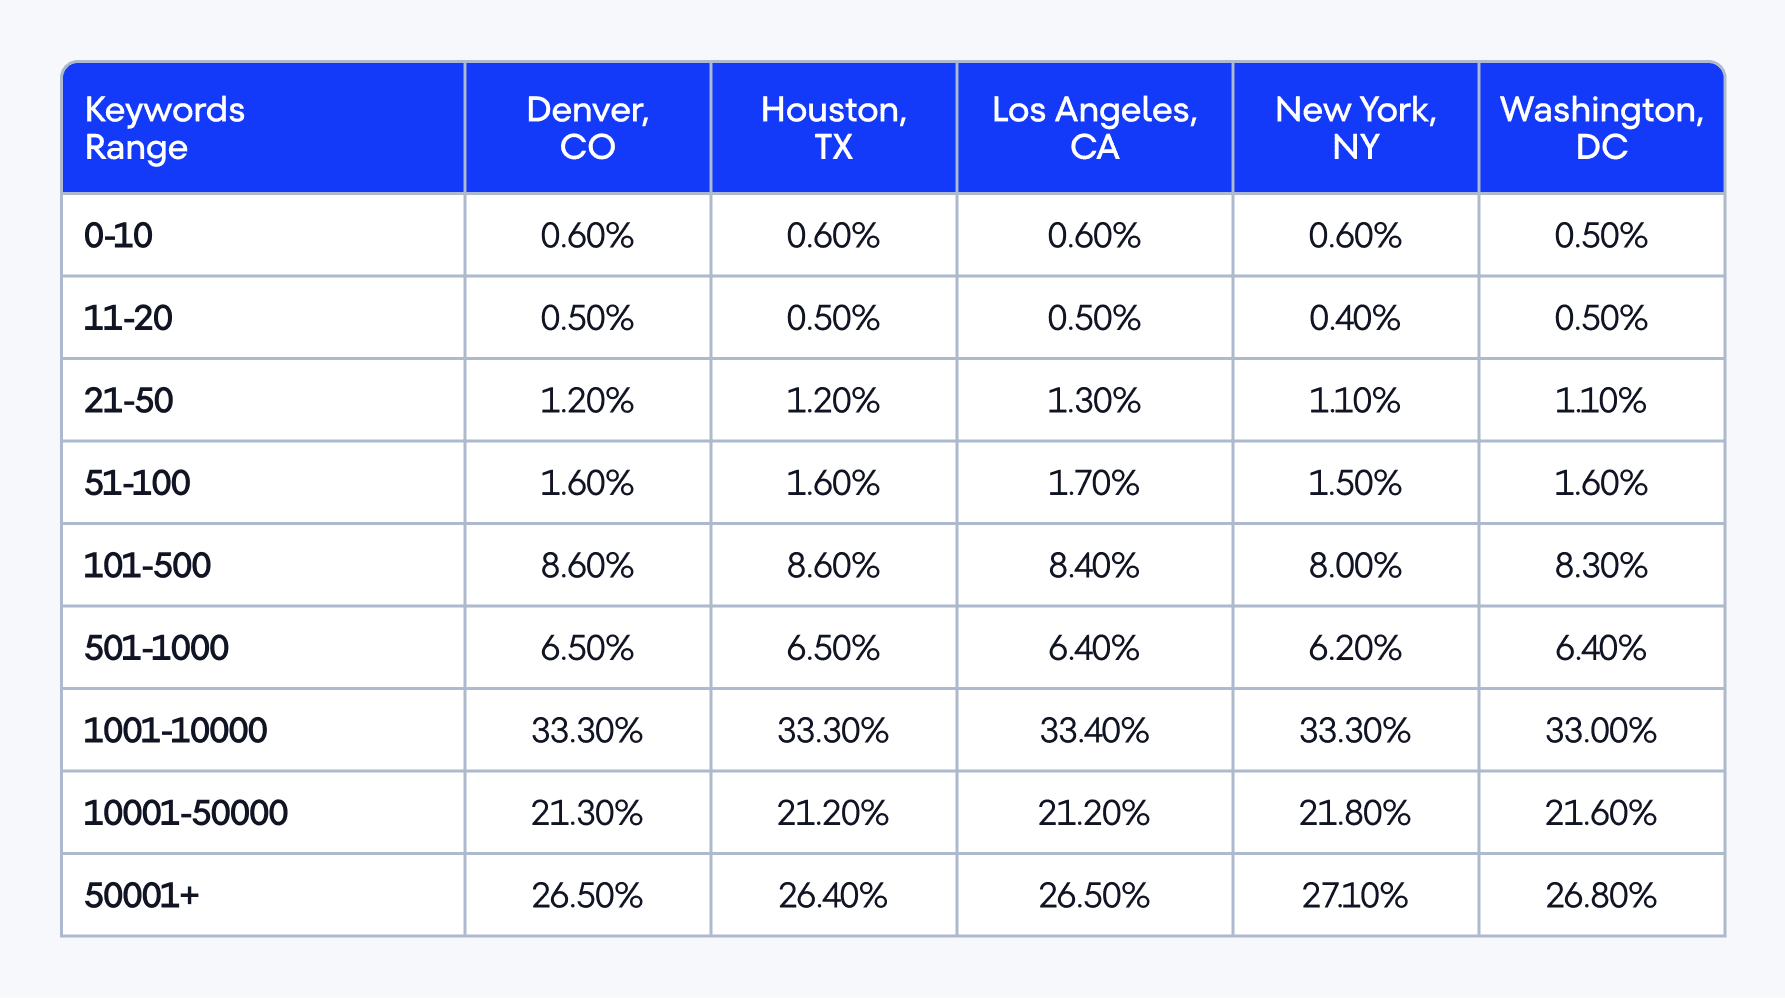
Keywords
As for the overall keyword distribution, the largest segment (35.80% or 30,684 domains) ranks for 1,001-10,000 keywords.
- In total, 46,853 domains (55.70%) rank for 101–10,000 keywords, showing a strong concentration in the mid-range, according to our distribution.
- 34,163 domains (39.90%) rank for over 10,001 keywords, with 17,973 (21.00%) of them ranking for more than 50,000 keywords, indicating high visibility.
- 16,169 domains (18.90%) rank for 101–1,000 keywords, while only 4,670 domains (5.50%) rank for fewer than 100 keywords.
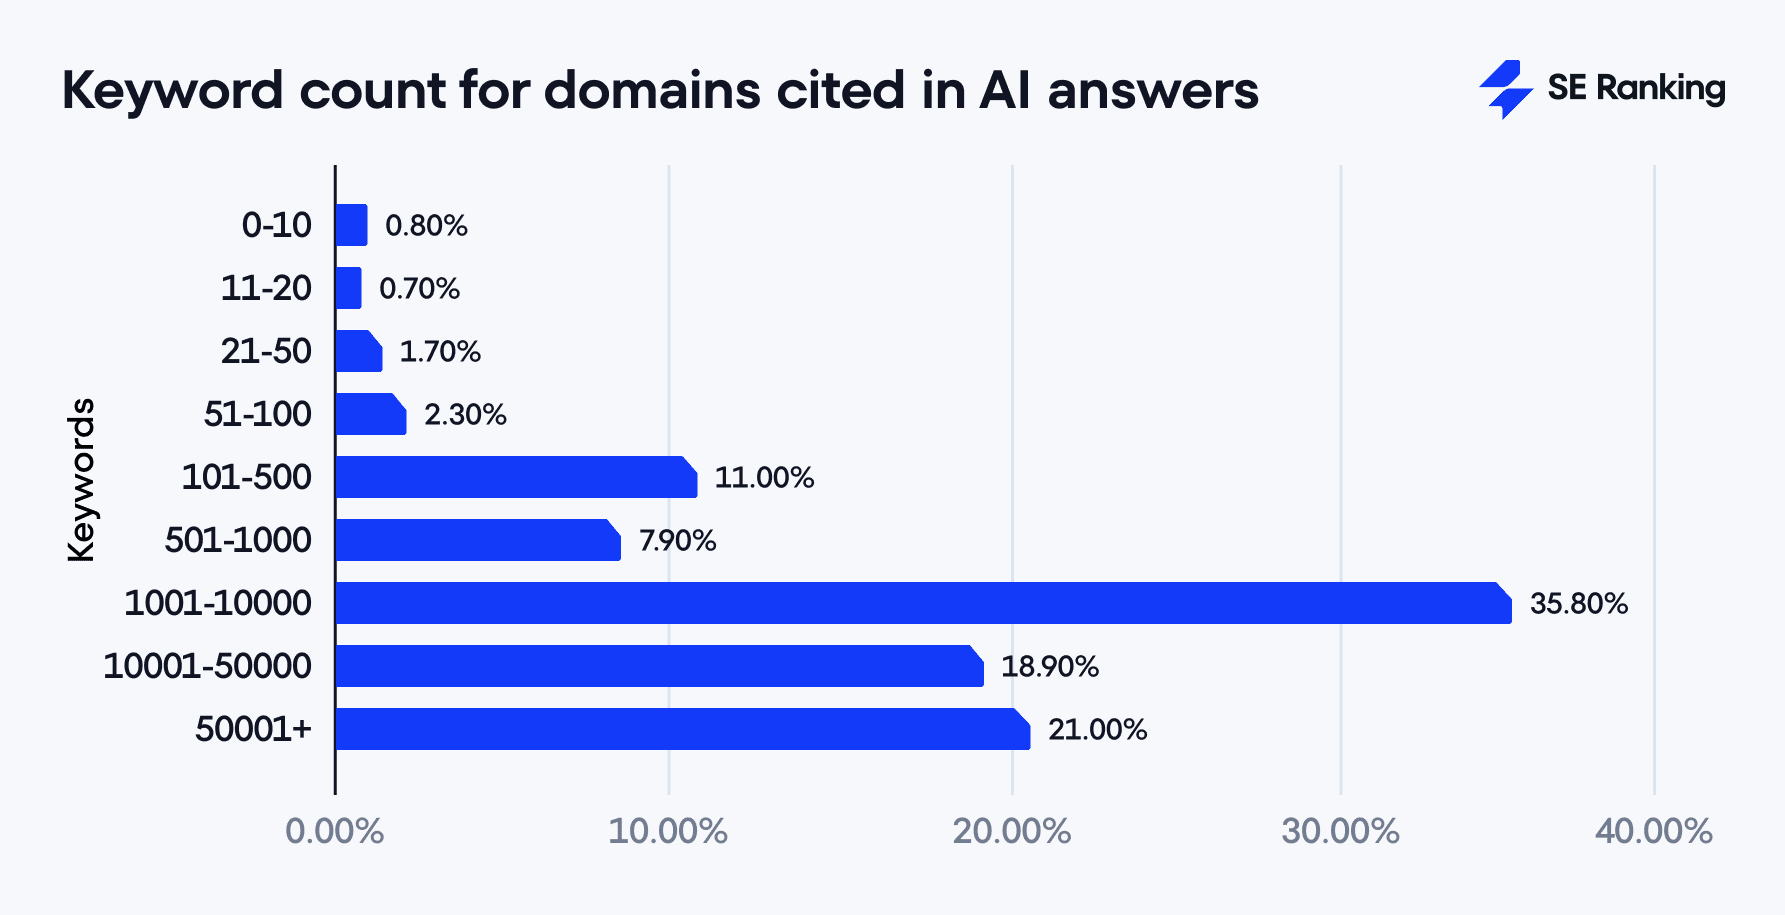
There was little variation in keyword visibility across the five states.
Referring domains
The referring domain data provided by our Backlink Checker shows that nearly half of all domains (29,319 or 34.50%) have between 101-500 referring domains.
- The majority (19,185 or 22.60% of domains) fall in the middle range (according to our distribution), with 1,001-10,000 referring domains.
- Only 6,176 domains (7.20%) have over 10,000 referring domains, suggesting many sources receive multiple links from a limited number of referrers.
- 20,001 domains (23.50%) have 100 or fewer referring domains.
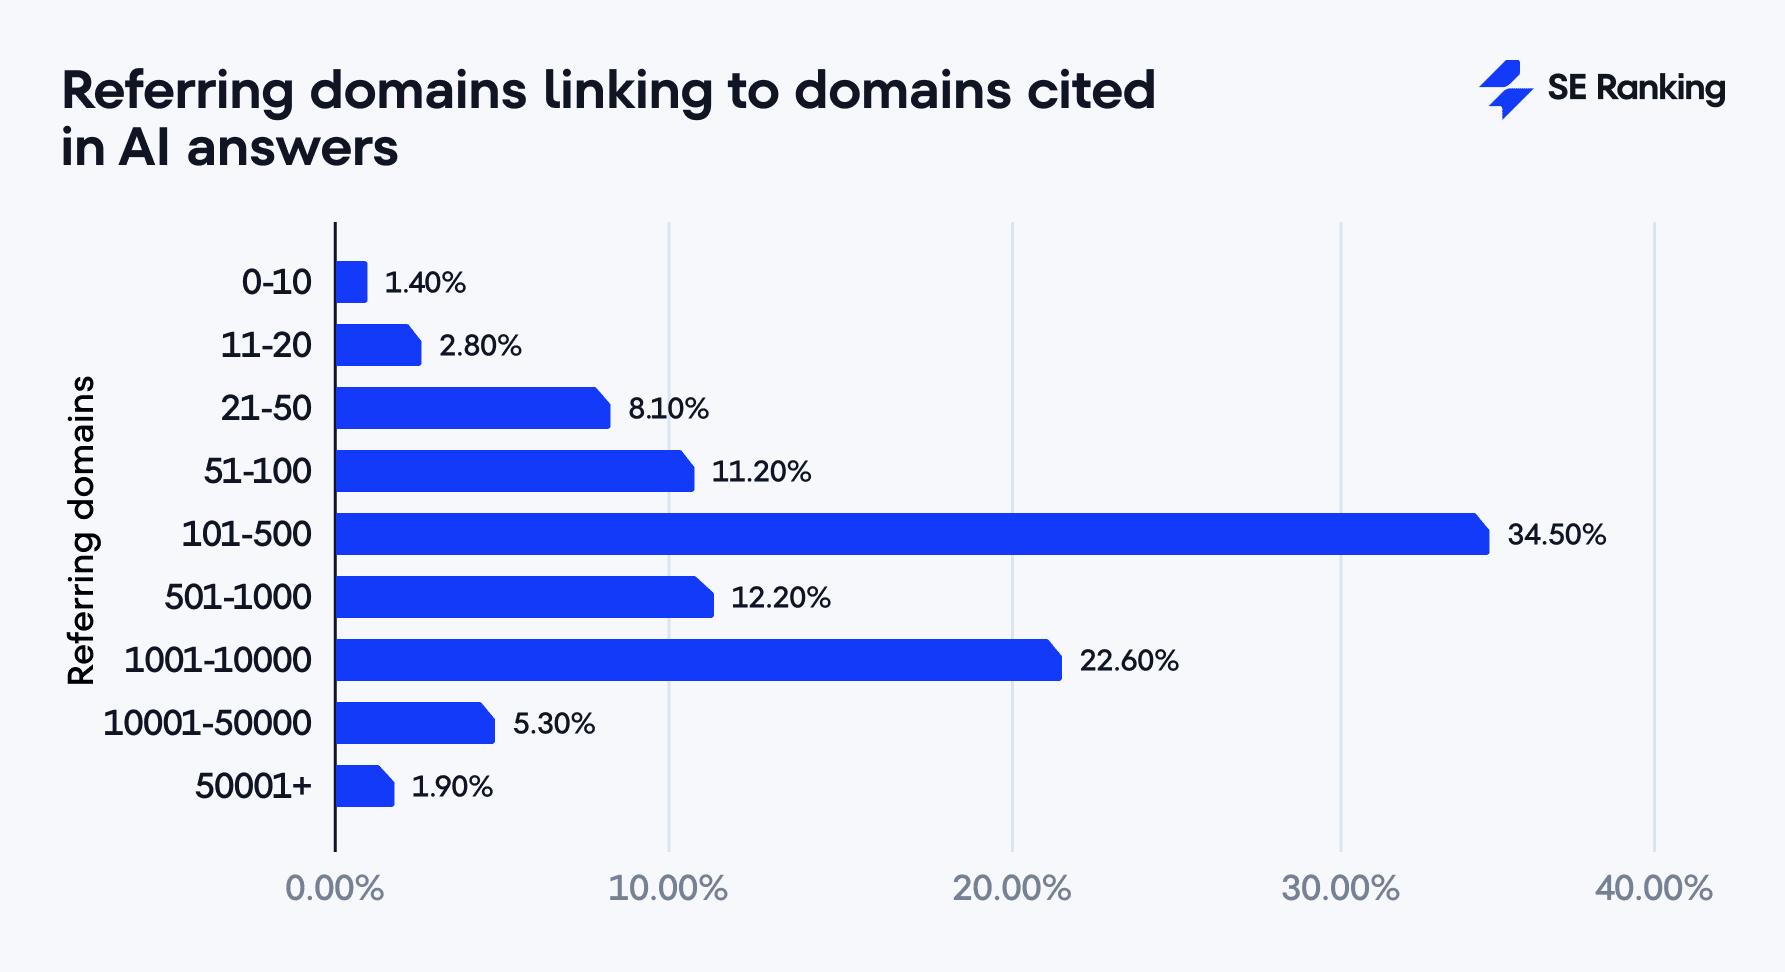
The number of referring domains varied little from state to state.
Backlinks
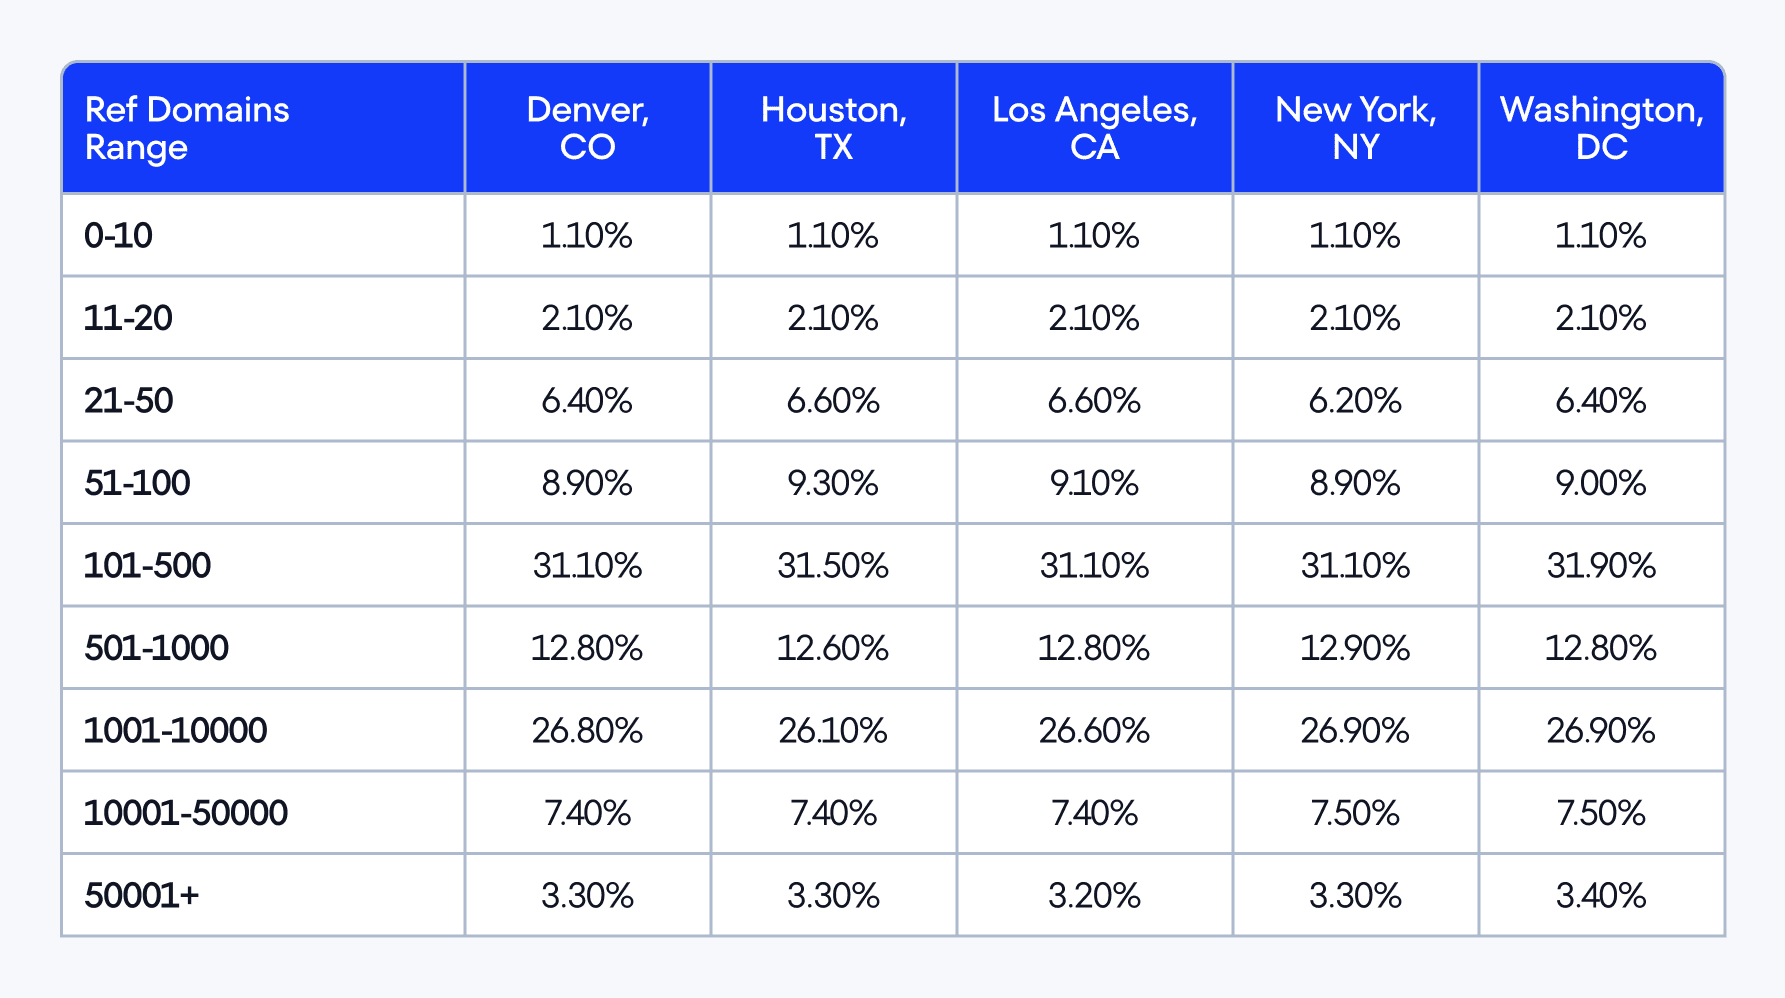
The backlink distribution shows that Google’s AIOs tend to cite domains with large backlink profiles.
- Most domains (26,355 or 31.00%) have between 1,001-10,000 backlinks
- 49,384 domains (58.10%) have between 101–10,000 backlinks, representing a significant portion of the total.
- 27,219 domains (32.00%) have over 10,000 backlinks
- Only 8,442 domains (9.90%) have fewer than 100 backlinks
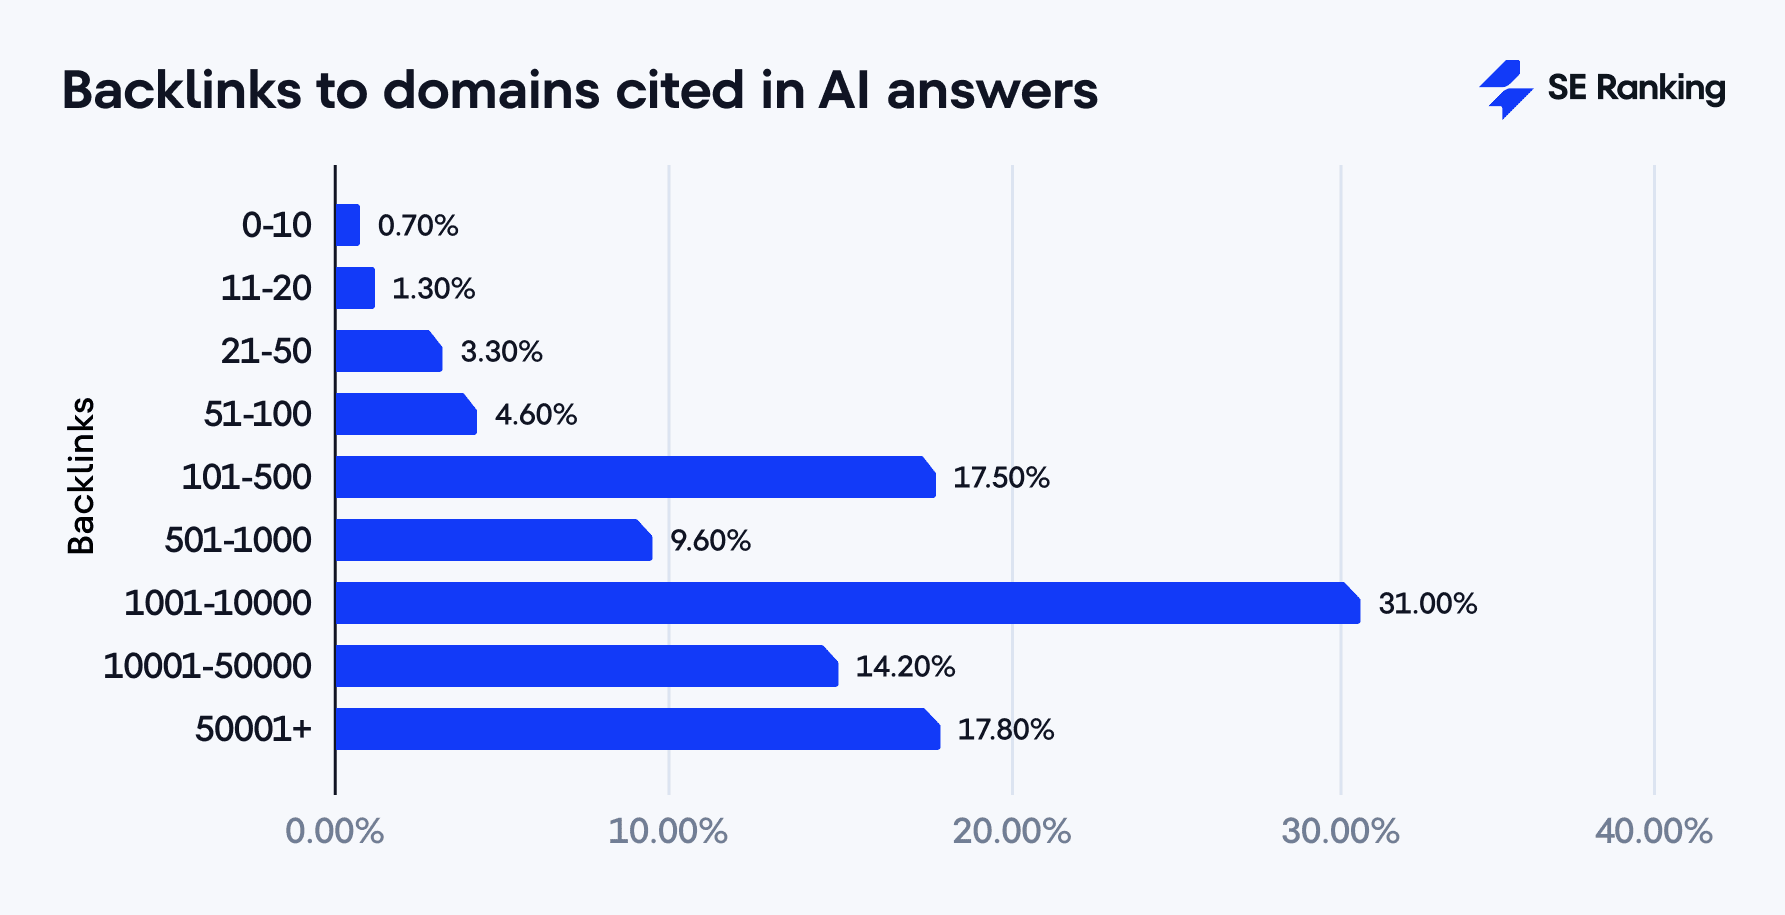
Despite geographic spread, backlink counts were uniform across cities, with only slight variations in each range.
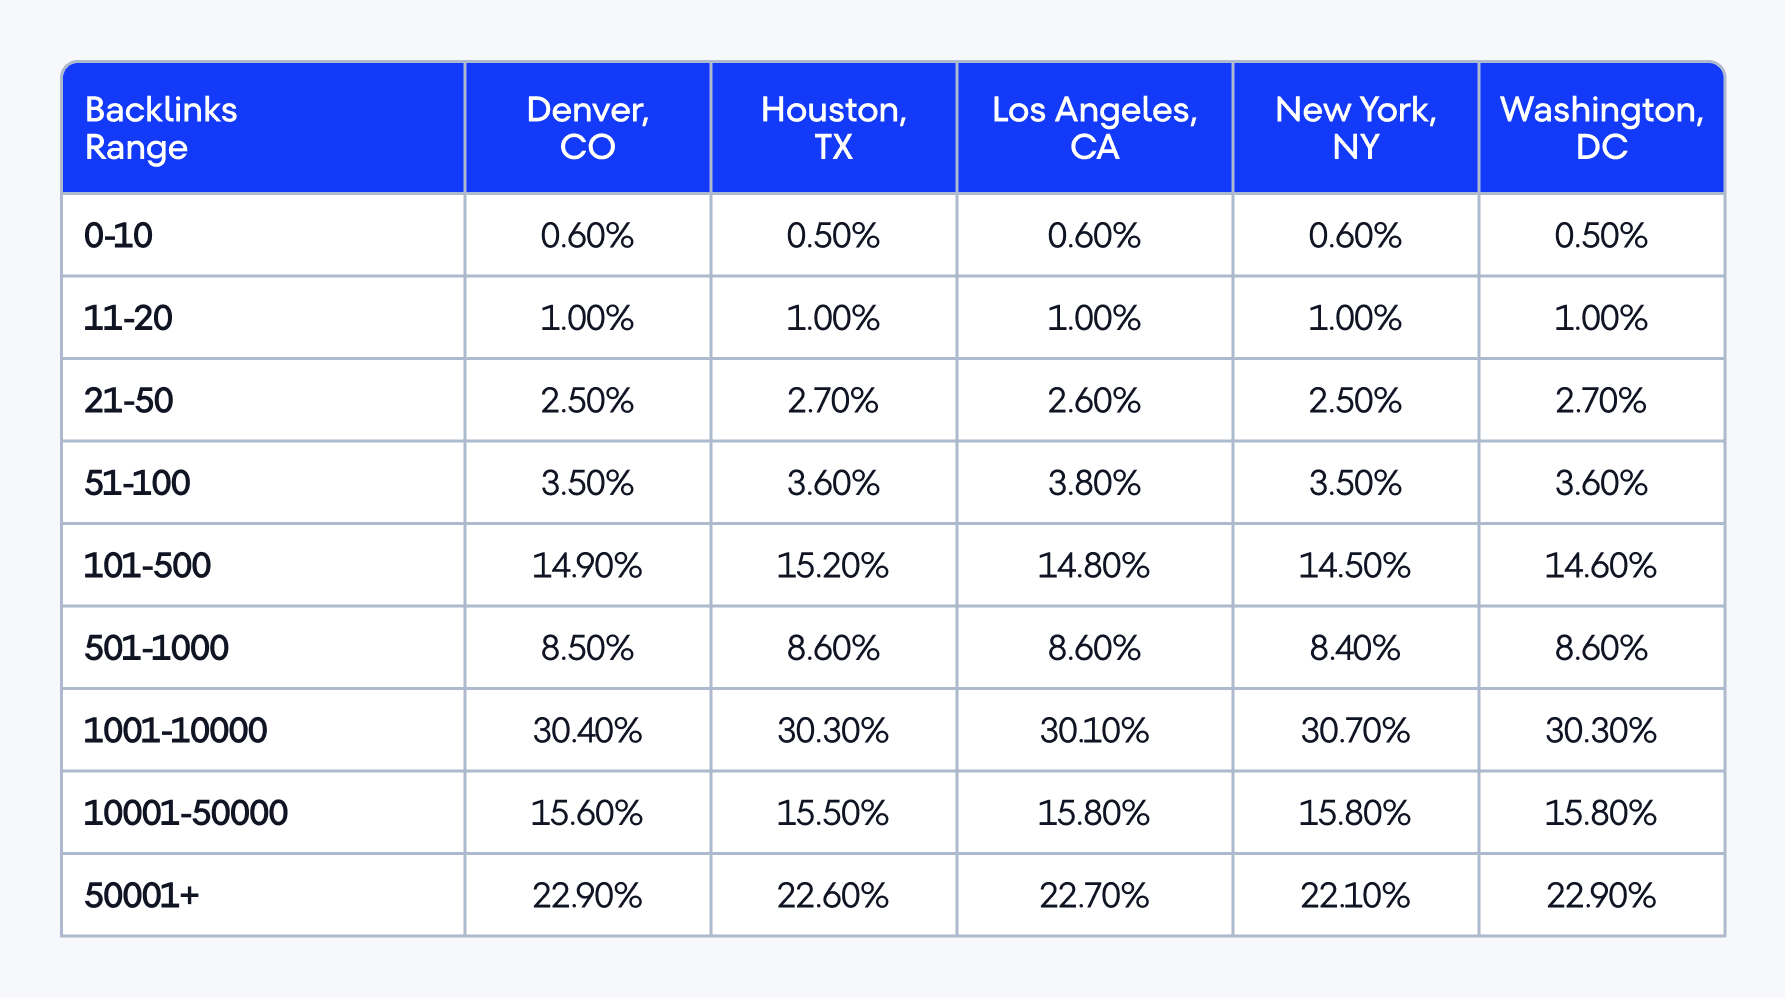
This data shows that Google’s AI Overviews tend to cite websites with domain authority. The cited sources typically have moderate to strong traffic, substantial keyword visibility, and solid backlink profiles, though often from a smaller group of referring domains. State-by-state data shows almost no major differences, which suggests Google applies the same standards across all locations.
How many unique and exclusive domains are cited across each state?
This domain diversity analysis shows relatively small differences across the five locations studied. Total source citations (link counts) range from 368,209 in New York to 382,812 in Houston, showing only a 4% variation.
To clarify: unique domains are the total number of distinct domains cited in a region, while exclusive domains appear only in that region and nowhere else.
- Unique domains also show slight differences, with Los Angeles citing the most (41,006) and New York the fewest (39,360).
- Los Angeles also leads in exclusive domains, with 9,298 of them. Houston follows closely with 9,236, while New York has the fewest at 8,437.
The share of exclusive domains ranges from 21.31% in Washington, DC to 22.72% in Houston.
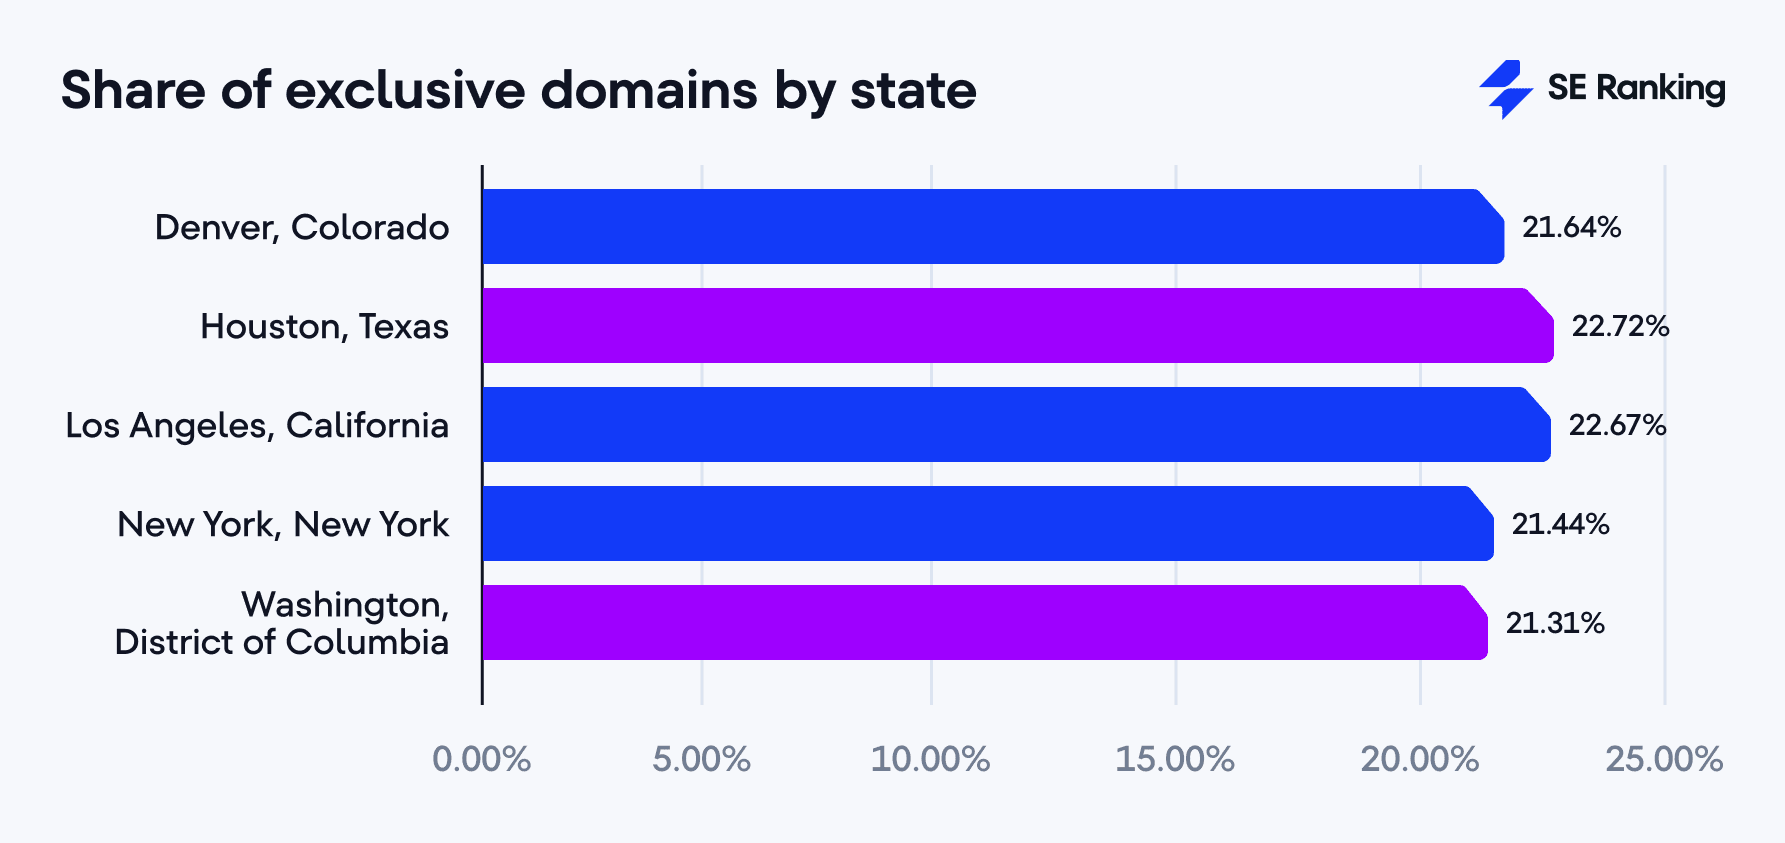
Houston, despite having the lowest number of unique domains overall, has the largest proportion of exclusive domains. These small differences suggest that while Google’s AI Overview source pool is largely standardized, some localization effects may be at play. We’ve seen that Houston provides a uniquely distinct set of sources in its search results.
Do AI Overviews cite exclusive domains (specific to each state)?
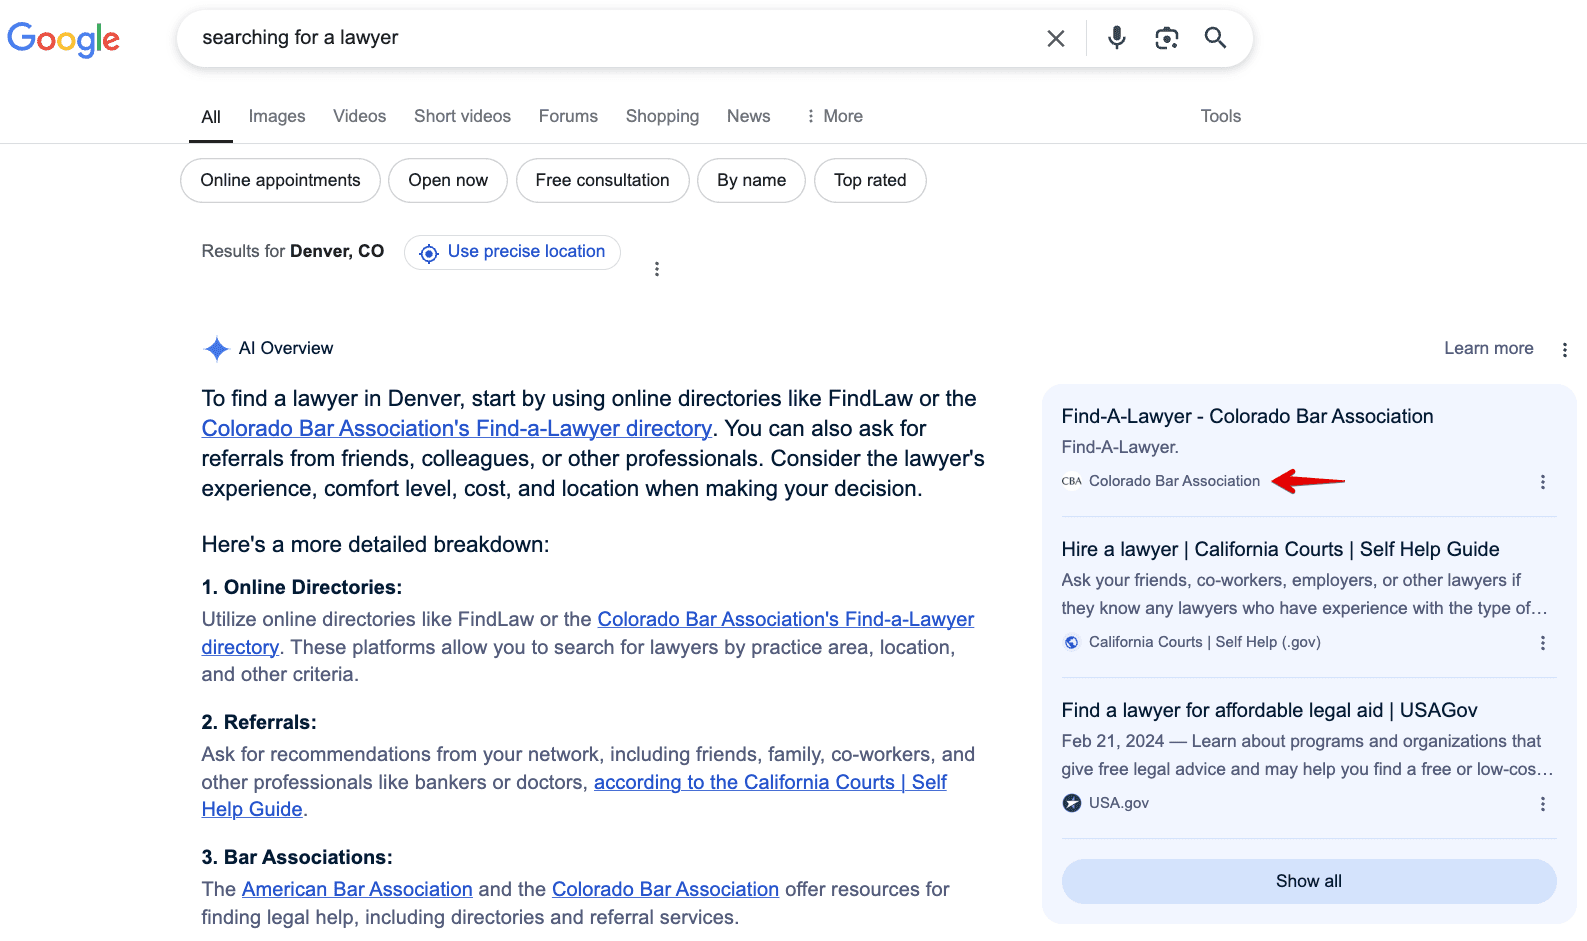
Each location in our study features a distinct set of exclusive domains that don’t appear in other states. These often represent local government sites, regional businesses, or local organizations.
Steven Schneider observes about this local vs. global relevance:

Krista Seiden brings more focus to the value of localized insights:

Below are the top exclusive domains by state.
Denver, Colorado
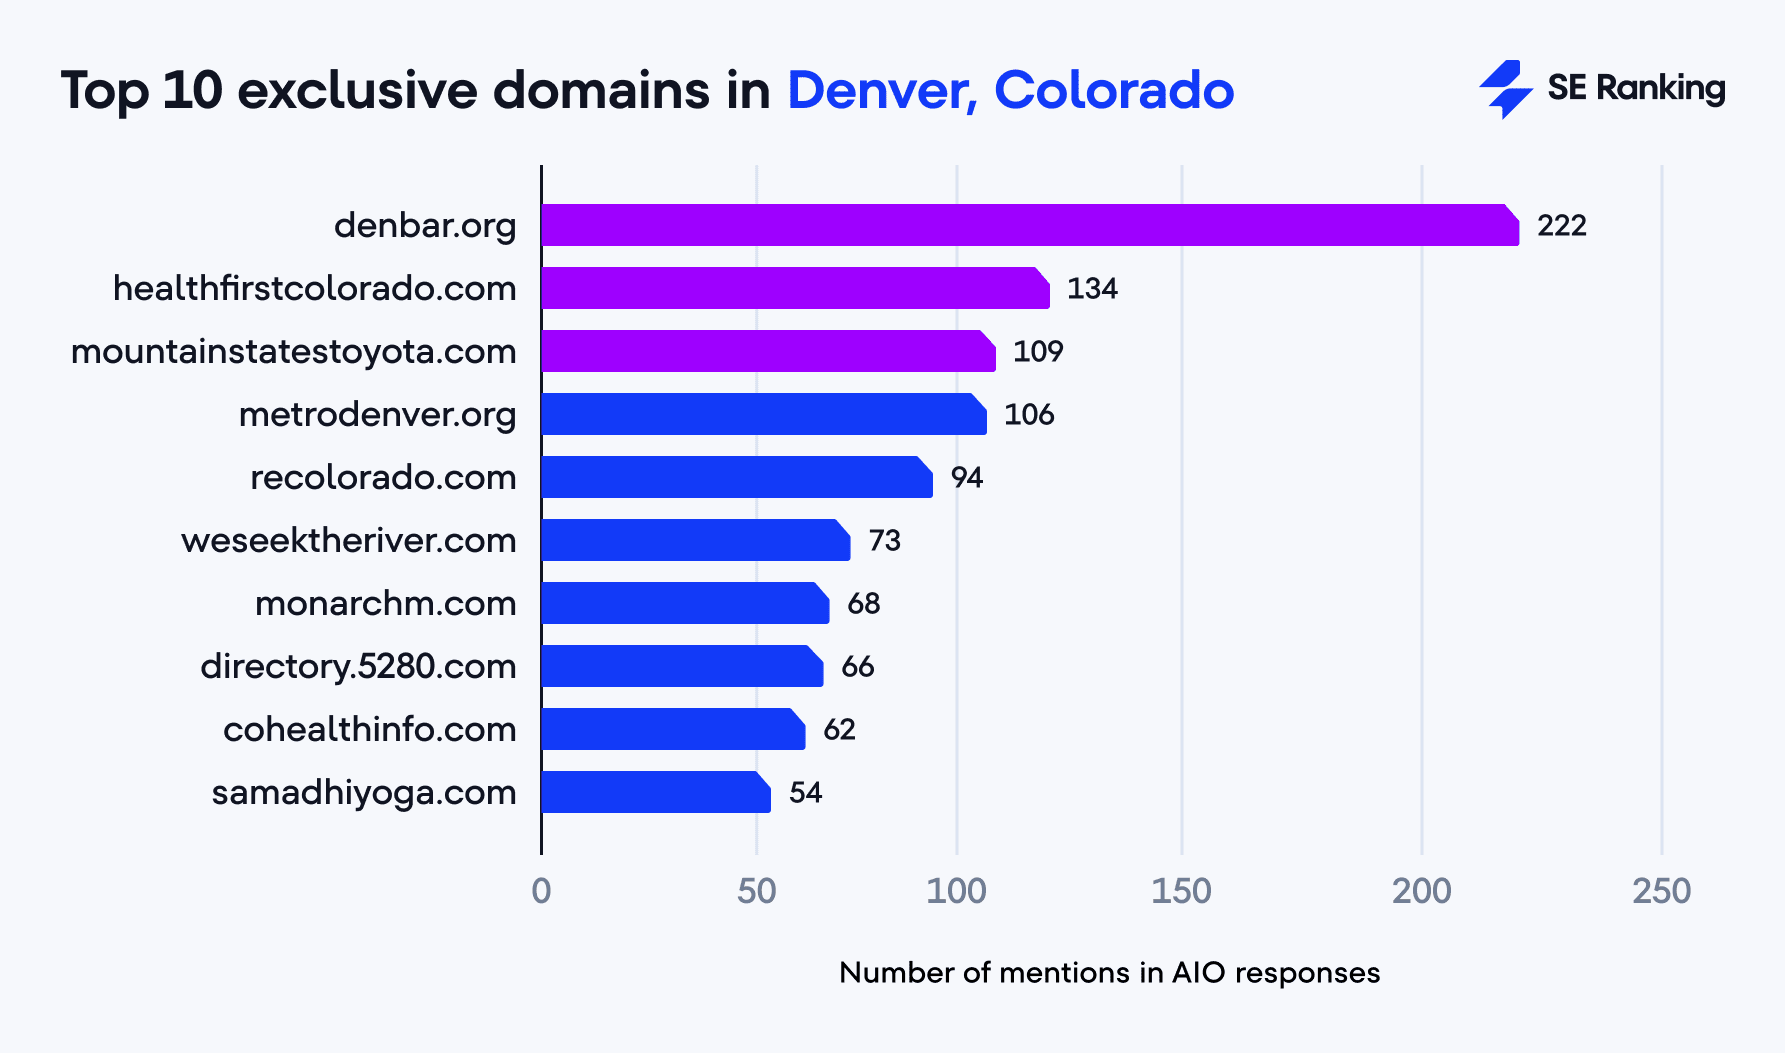
The top 3 exclusive domains in Denver, Colorado are:
- denbar.org (222 mentions): Denver Bar Association
- healthfirstcolorado.com (134 mentions): Local health program
- mountainstatestoyota.com (109 mentions): Regional car dealership
Houston, Texas
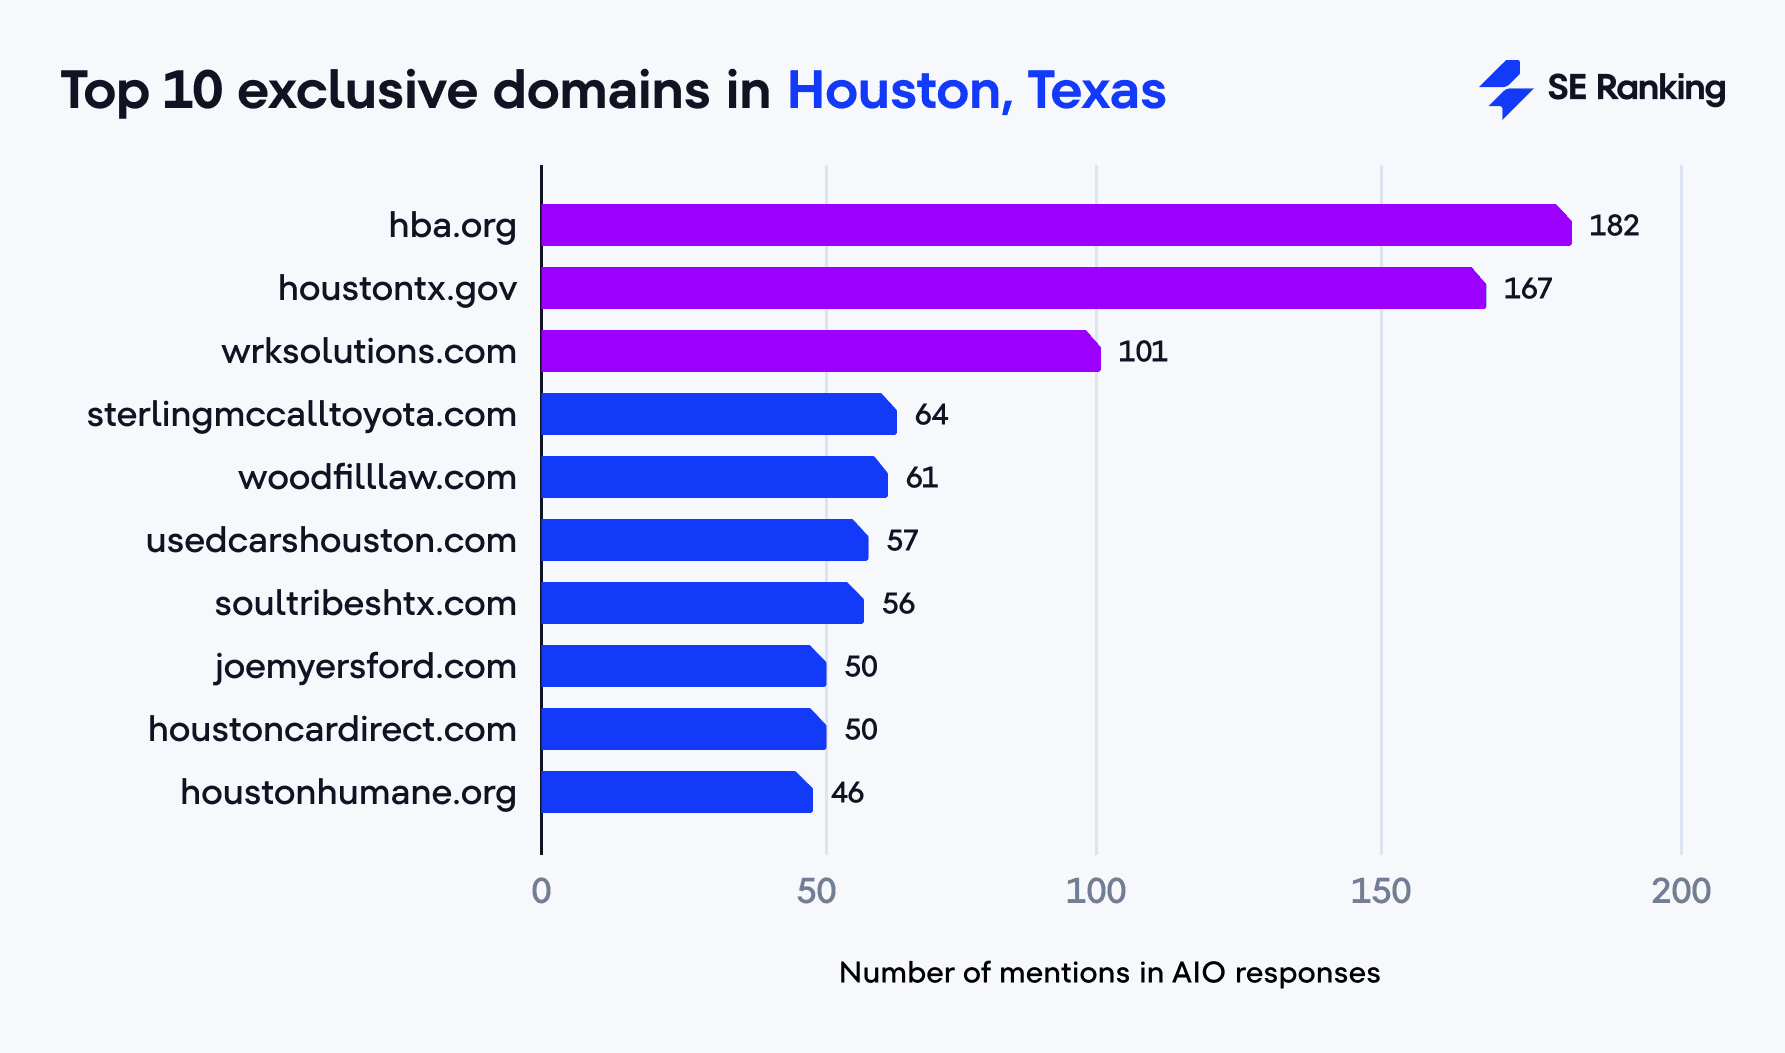
The top 3 exclusive domains in Houston, Texas are:
- hba.org (182 mentions): Houston Home Builders Association
- houstontx.gov (167 mentions): City’s official website
- wrksolutions.com (101 mentions): Local employment service
Los Angeles, California
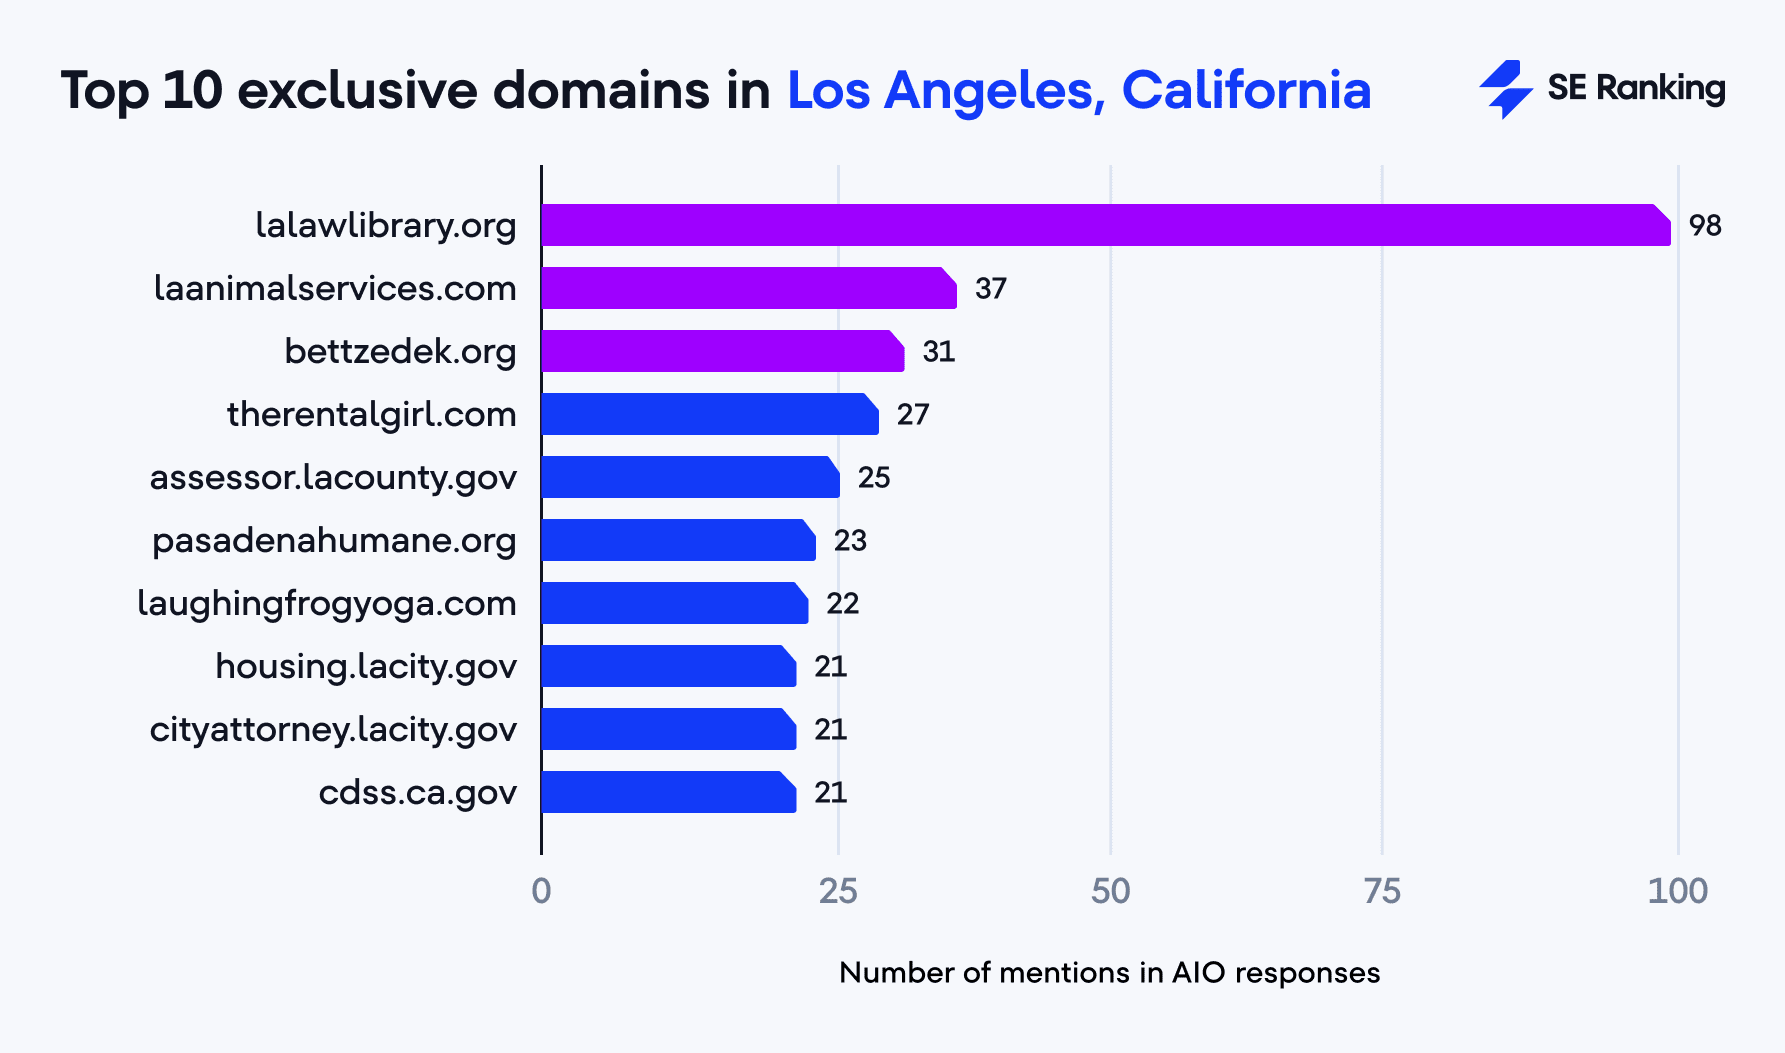
The top 3 exclusive domains in Los Angeles, California are:
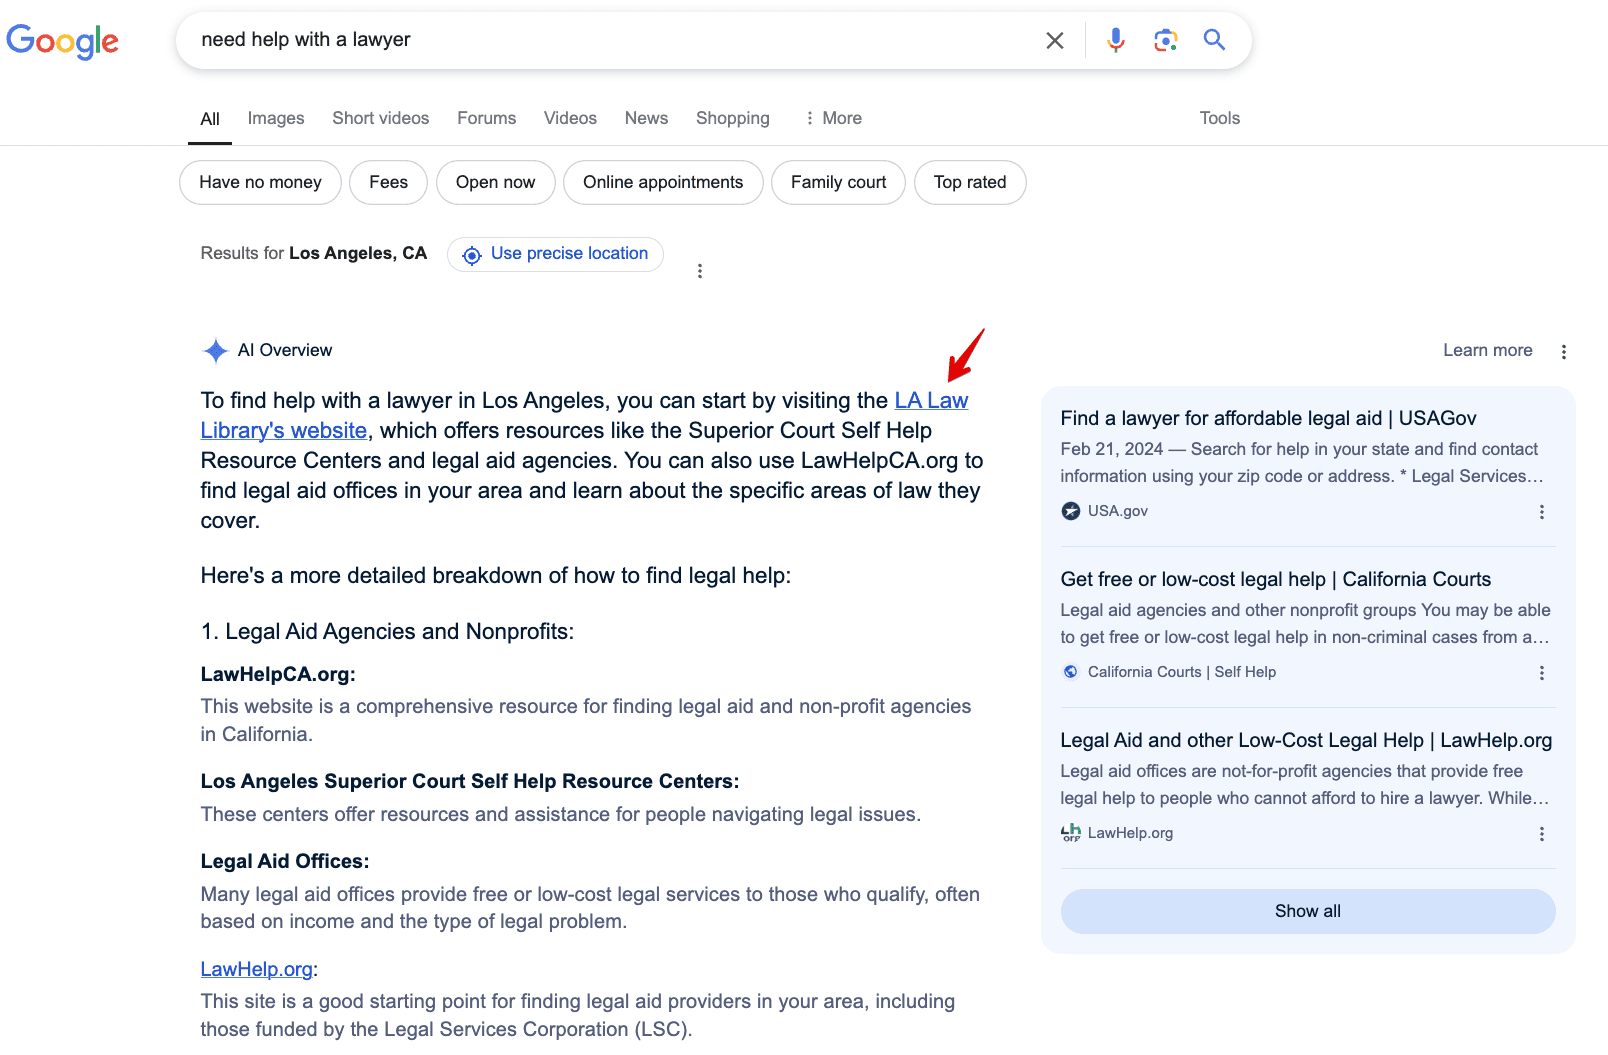
- lalawlibrary.org (98 mentions): Los Angeles Law Library
- laanimalservices.com (37 mentions): Animal services
- bettzedek.org (31 mentions): Nonprofit legal organization
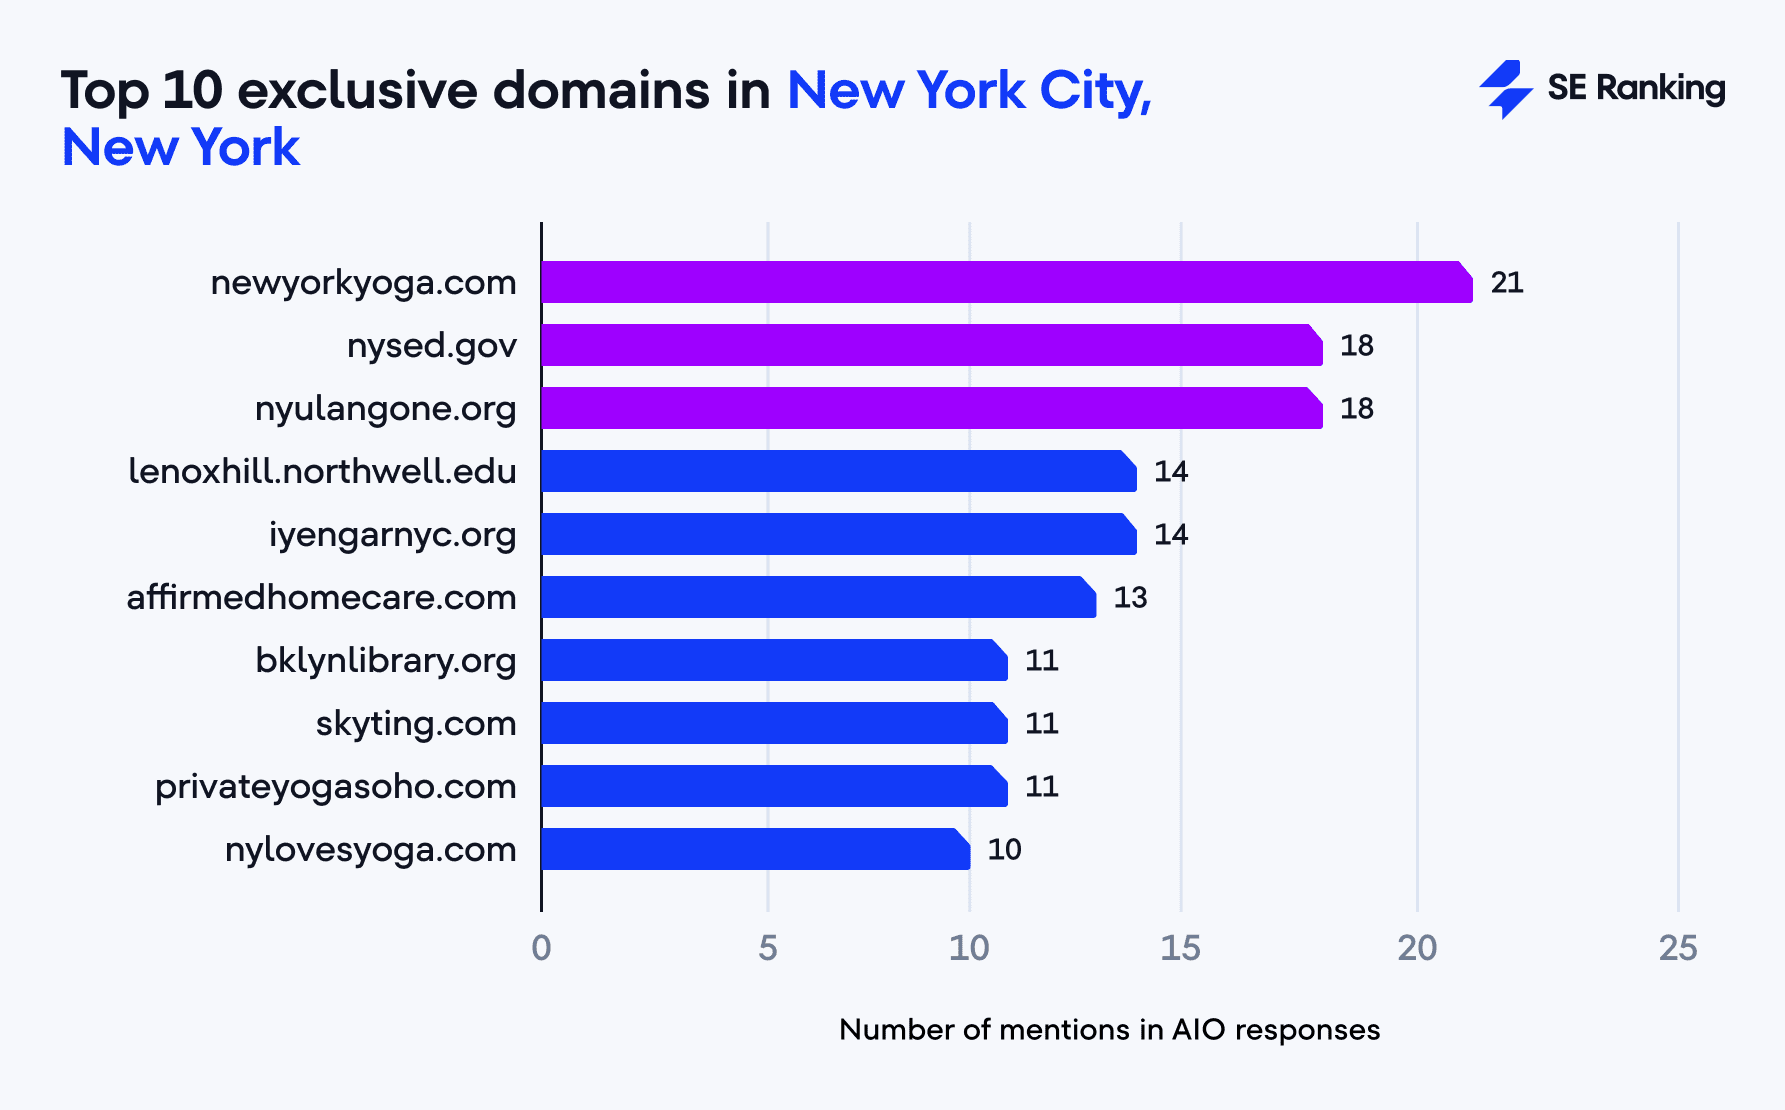
New York City, New York
The top 3 exclusive domains in New York City, New York are:
- newyorkyoga.com (21 mentions): Yoga Center
- nysed.gov (18 mentions): New York State Department of Education
- nyulangone.org (18 mentions): Medical center
Washington, DC
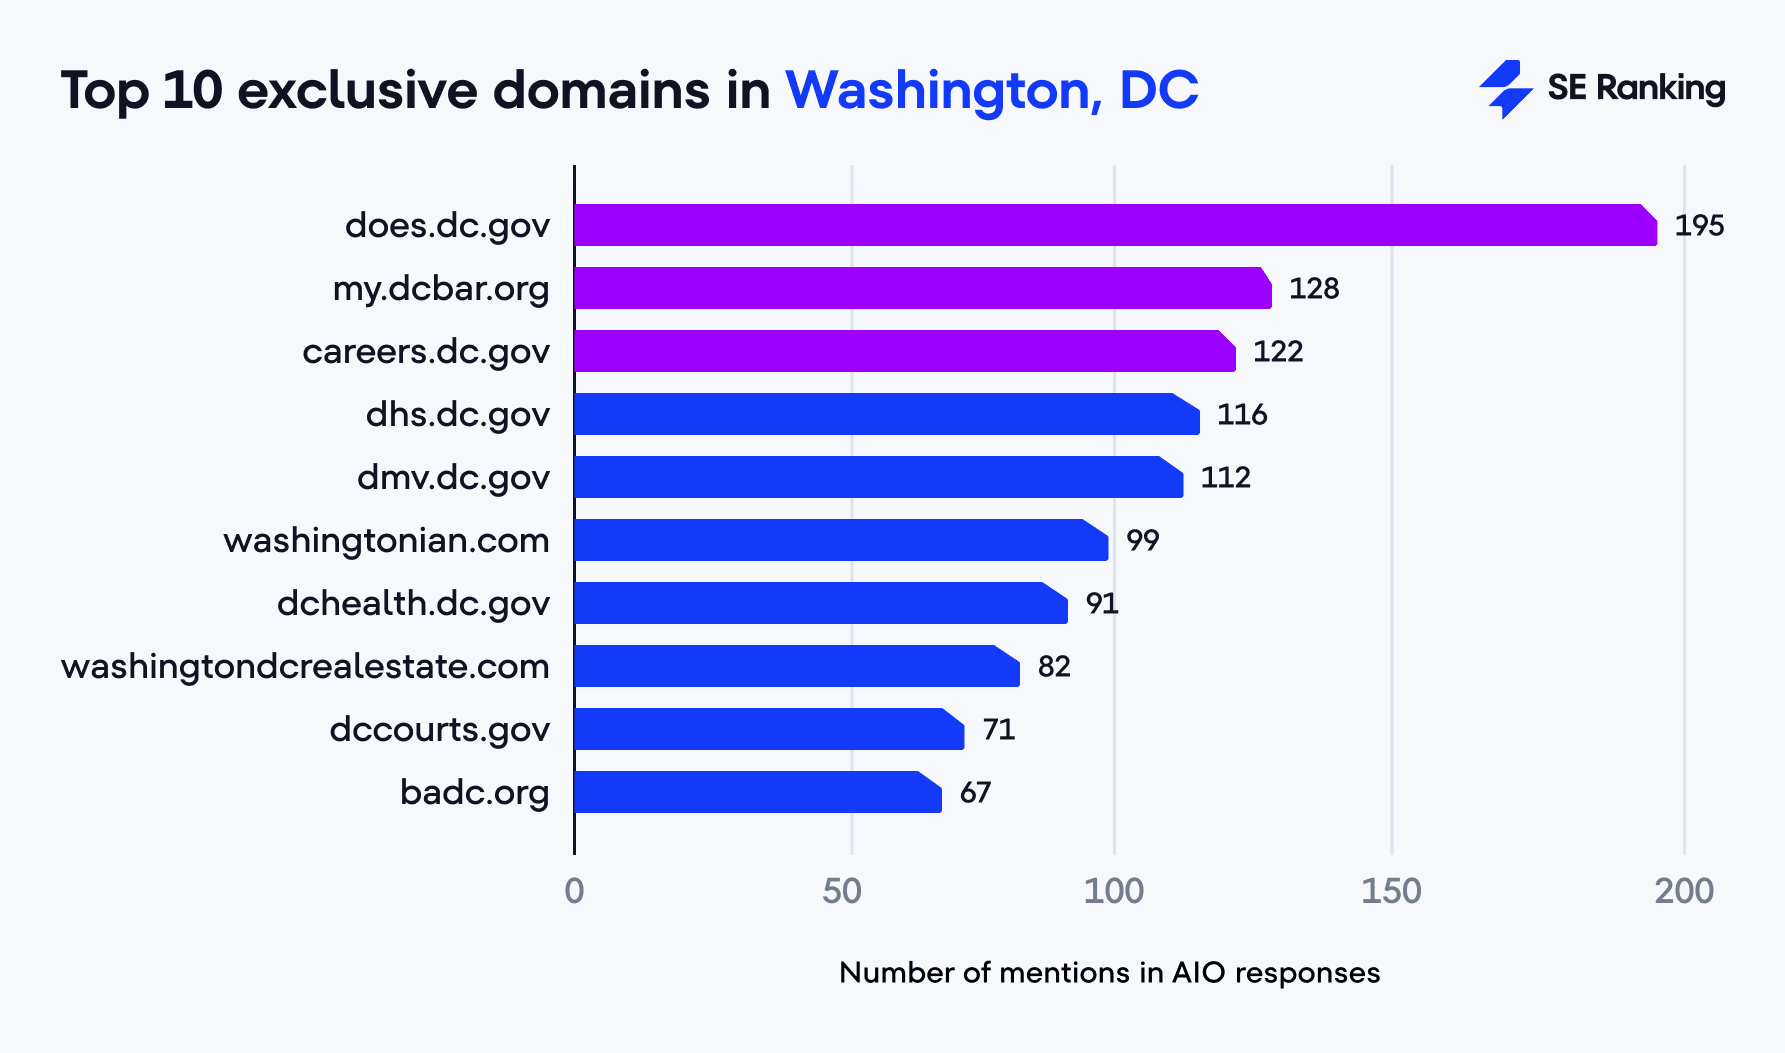
The top 3 exclusive domains in Washington, DC are:
- does.dc.gov (195 mentions): Department of Labor
- my.dcbar.org (128 mentions): Bar Association
- careers.dc.gov (122 mentions): Government jobs site
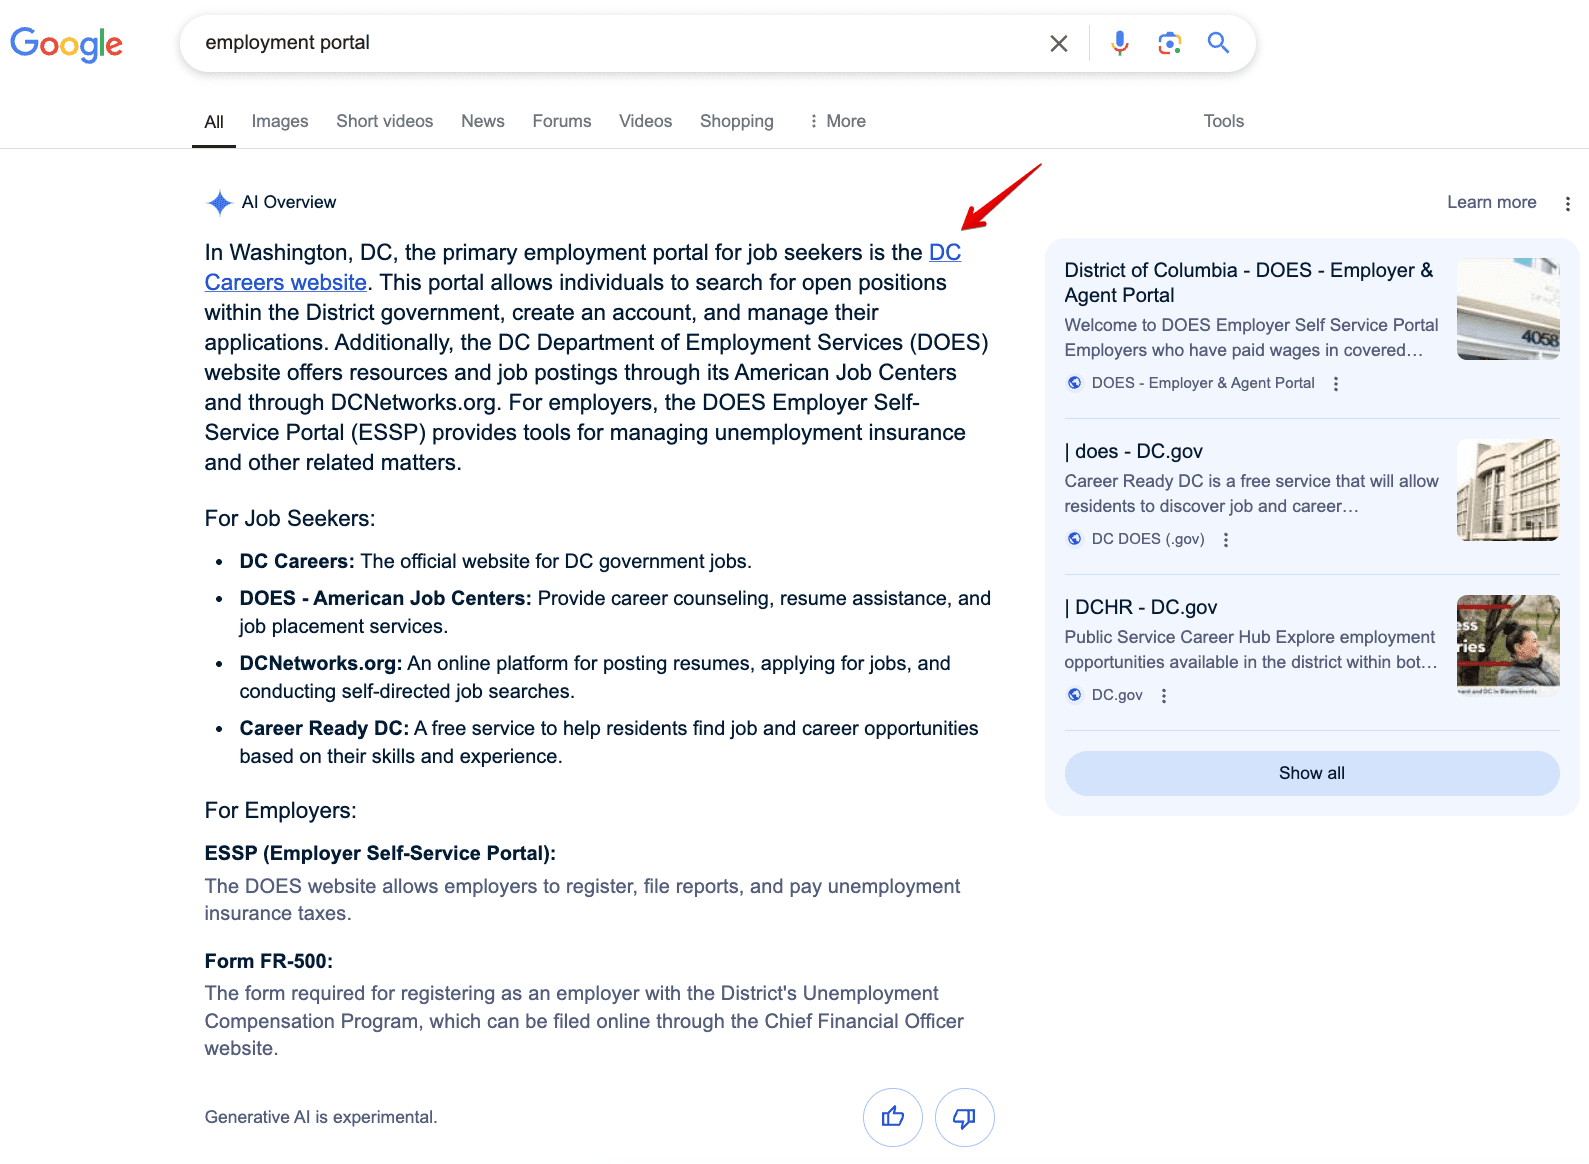
To conclude, while these domains appear far less frequently than global ones like google.com or reddit.com, their presence shows that Google’s AI Overviews take local relevance into account when appropriate. Exclusive domains across each region, like government websites (houstontx.gov, does.dc.gov) and local organizations (denbar.org, lalawlibrary.org) mostly appear in clearly local queries. To show up in AI Overviews in distinct locations, websites need to build a strong overall domain authority. But for those focusing on specific regions, it’s important to prioritize local relevance as well.


How many unique domains do AI Overviews cite per query by state?
The average number of unique domains per query is consistent across all five locations, ranging from 9.81 in New York and Washington, DC to 9.90 in Los Angeles.
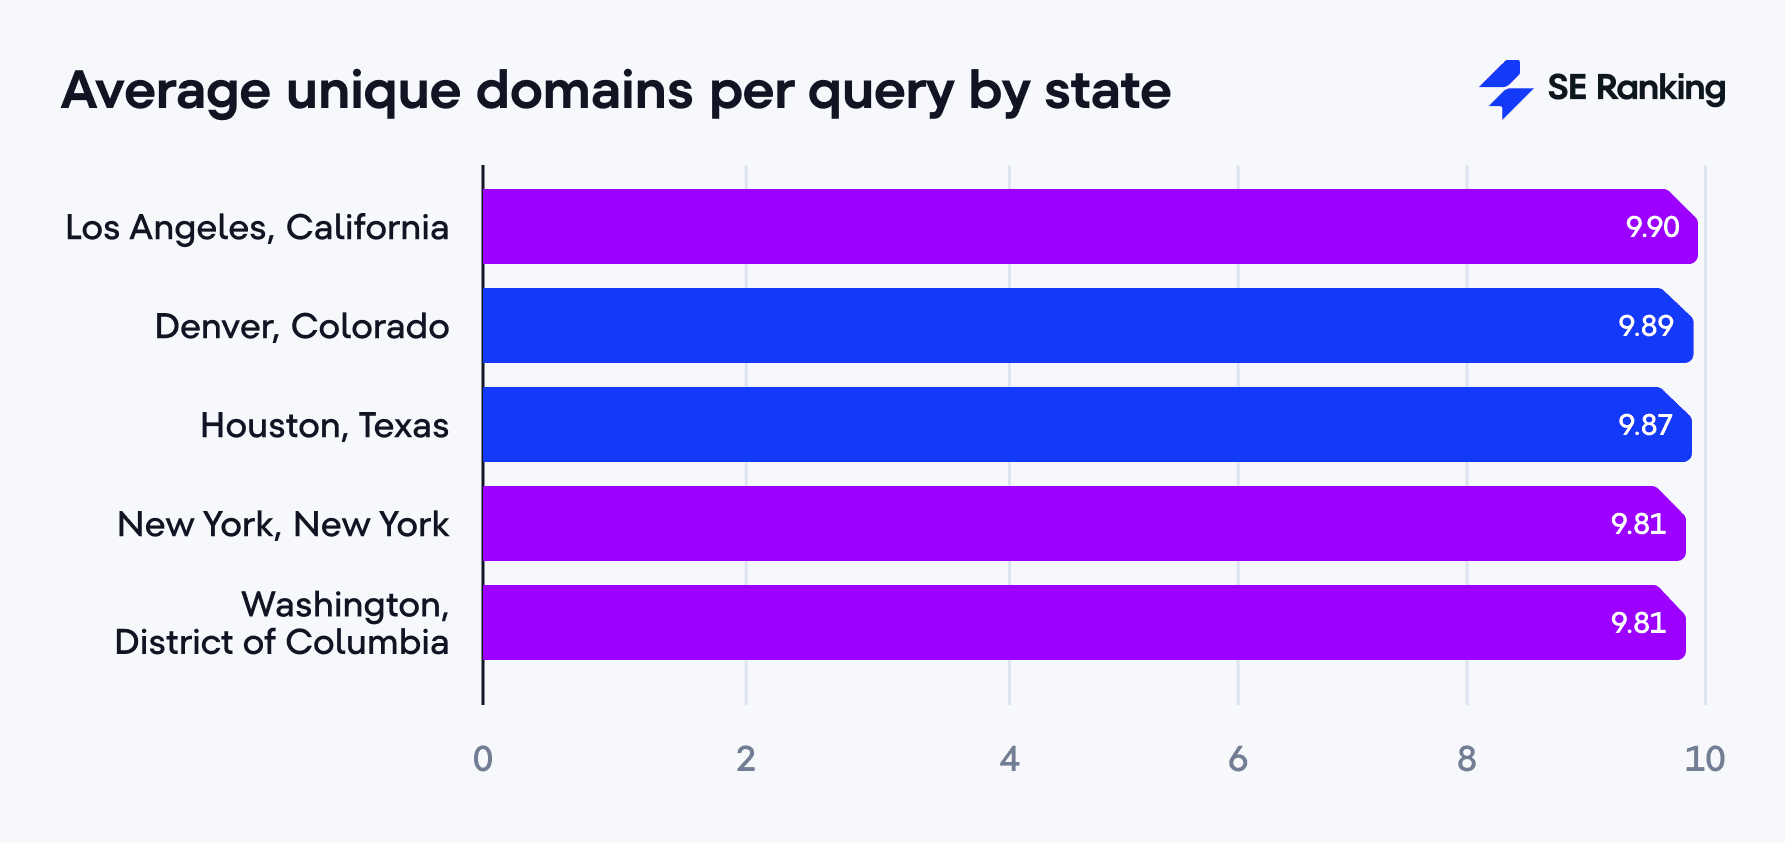
The difference between locations is minimal, with no more than 0.09 domains per query. This indicates a high consistency in unique sources cited by Google’s AI Overview system (regardless of geographic location).
Are there observable differences in source diversity between each state?
When we analyzed how AI Overviews cite domains in each state, we found that for nearly half of all queries (47.05% or 14,470), the sources (domains) were completely identical in all locations. So the same domains were cited in every location.
But the other half shows varying degrees of regional differentiation:
- 50-99.99% match (6.09% or 1,873 queries): Most sources were the same state by state, with minor differences throughout.
- 1-49.99% match (40.51% or 12,460 queries): Many sources varied by state, indicating a moderate to strong regional variation.
- 0% match (6.34% or 1,951 queries): We observed no shared domains at all. Each state had a completely exclusive set of cited domains.
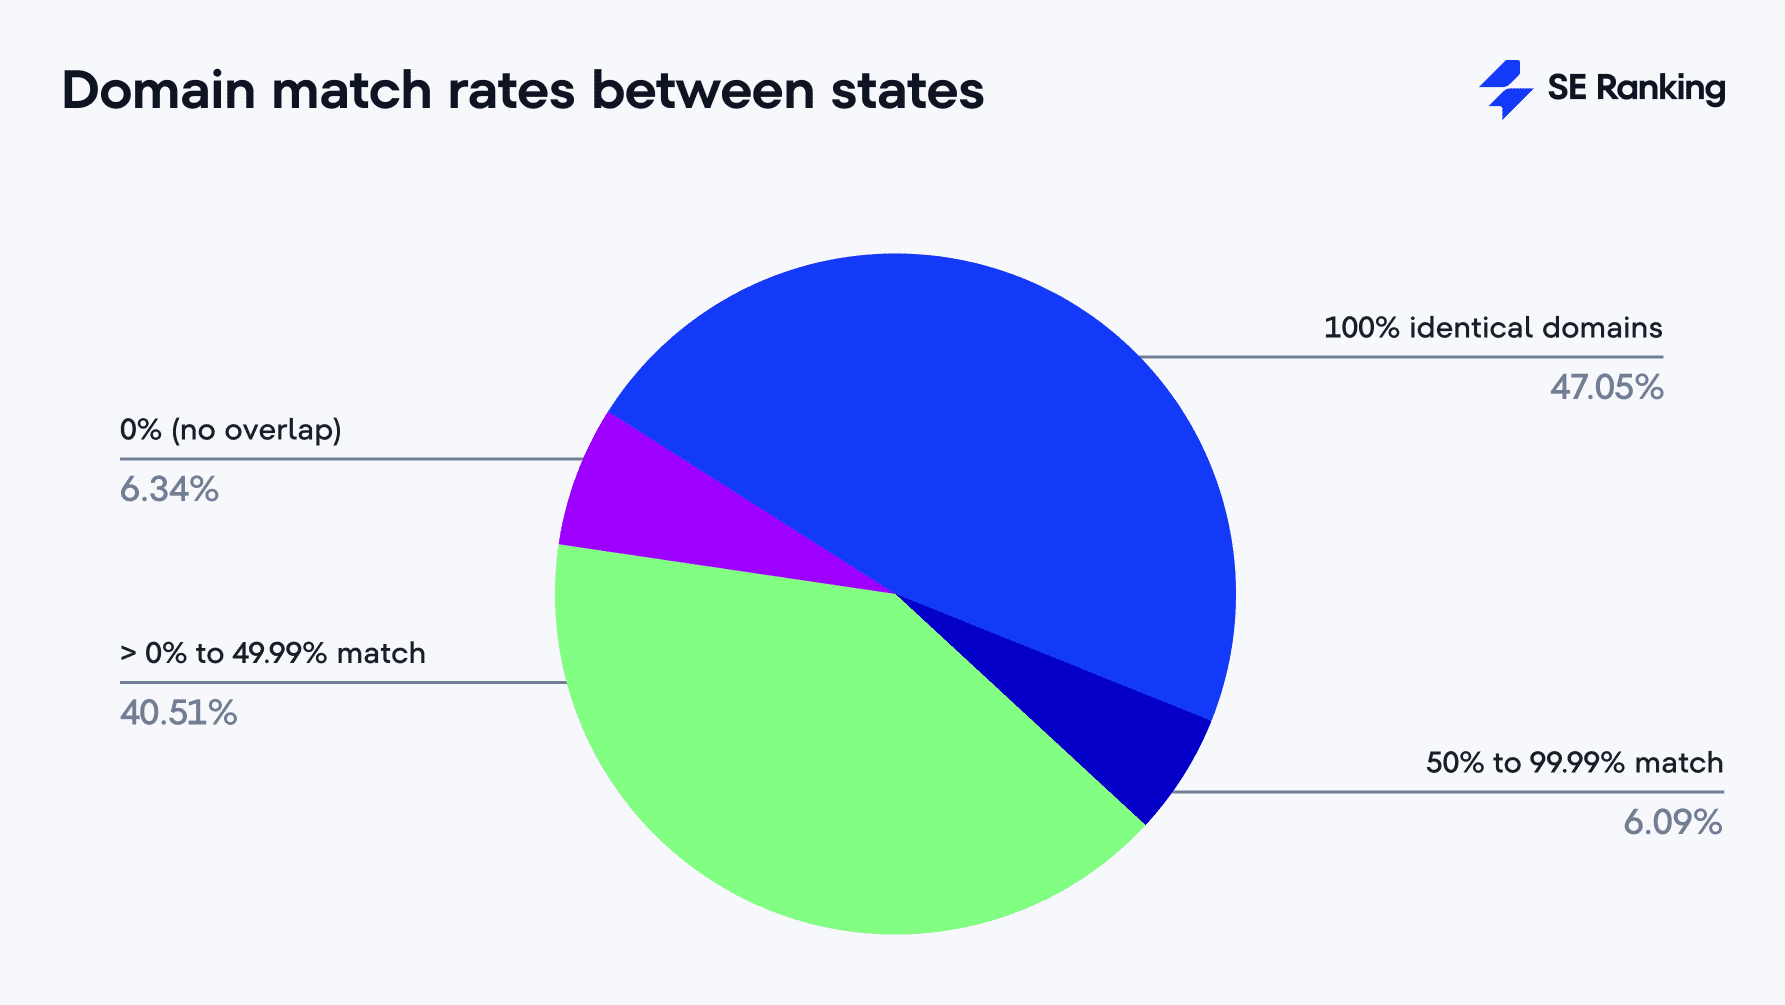
For almost half of all queries, AI Overviews select the same sets of sources regardless of where the search occurs. More than 53% of all queries have a domain match rate of at least 50%. This aligns with our earlier findings that showed global domains dominating in AIOs. For many queries, Google’s AI tends to rely on the same set of authoritative, globally recognized sources regardless of where the search is made.
The other half tells a different story. In many cases, the sources vary depending on the user’s location, likely reflecting a degree of local adaptation. The most interesting group is the 6.34% of queries where the sources don’t overlap between states. These likely involve highly local topics, like city services, small businesses, or government programs, where only locally relevant sources make sense.
If we look at the niches, this pattern becomes even clearer.
- 100% domain overlap is most common in the Relationships, Business, and Food & Beverage niches, where answers often rely on general, globally trusted content.
- ≥50% domain overlap appears frequently in the Education, Self-Care & Wellness, and Business niches, topics with a mix of universal and regionally relevant insights.
- 0% domain overlap is most common in the Legal, Healthcare, and Real Estate niches, which are typically more sensitive to local laws, systems, and providers.
To conclude, Google relies on a largely consistent set of sources across regions for most queries. However, for local searches like local programs, services, or “near me” queries (e.g. “find law firms near me”, “lawyer provided by the state”, etc), location-specific websites are more likely to surface. This highlights the importance of core local SEO practices, even for smaller or less established websites aiming to reach local audiences.

Research methodology
For our study, we analyzed a total of 100,013 keywords across five states in the US: Colorado, Texas, California, New York, and Washington, DC. The keyword set covered various search intents, volume, and word counts to reflect a diverse spectrum of user queries.
We applied a consistent methodology across all five locations to ensure comparable results. Our goal was to explore the behavior of Google’s AI Overviews across each of the five states, focusing on citation patterns, source diversity, and regional variations. We aimed to provide SEO specialists and digital marketers with actionable insights into the regional impact of AI-generated answers on SEO strategies.
We examined 20 niches, analyzing around 5,000 search queries in each. Below are the niches included in our study:
- Relationships
- Business
- Education
- Food and Beverage
- Legal
- Technology
- Sports and Exercise
- Self-Care and Wellness
- Travel
- Cars
- Real Estate
- Healthcare
- Career and Jobs
- Entertainment and Hobbies
- Insurance
- Finance
- Pets
- News and Politics
- E-Commerce and Retail
- Fashion and Beauty
We performed the data collection as a one-time check on April 15 with the following parameters:
- Search Engine: Google AI Overviews
- Location: United States
- Regions:
- Denver, Colorado
- Houston, Texas
- Los Angeles, California
- New York, New York
- Washington, District of Columbia
- Language: English (en)
SE Ranking tools used for analysis:
Wrapping up
The results of this research have made one thing clear: regional variation across the US in AI Overviews is minimal. But we do see some location-based differences for more local queries, where exclusive domains appear at the state level.


We also uncovered a few surprising shifts in Google’s behavior across the US region since our previous reports from February-March 2025 and November 2024. The most intriguing are Reddit and Quora returning as cited sources, featured snippets appearing far less frequently alongside AIOs, and Google increasingly linking to its own search results within AI Overviews.
We hope these latest insights help you make informed SEO decisions in this fast-moving space. Keep an eye on our blog as we continue to explore AIOs from multiple angles to bring you the latest findings!

