SEO Infographics Explained: How to optimize infographics for search traffic
So, you’ve created an awesome infographic for your new blog post. That means you’re following one of the top blog SEO best practices—making your content stand out. There are also other tips that you should follow to pull in more readers, including optimizing infographics.
While often treated as supplementary to blog posts, infographics can ramp up your SEO strategy for blogging if used properly. You just need to optimize them for search. We’ll go over how to do that step-by-step in this post.
-
Infographics are a great addition to your SEO strategy. When optimized correctly, they help you drive organic traffic, earn backlinks, and improve image search rankings.
-
Choose relevant keywords that align with user intent and include them in your infographic.
-
Infographics should feature concise, easy-to-understand text supported by data, expert citations, and visually appealing elements like icons and diagrams.
-
Use a consistent color scheme, legible fonts, and contrast to emphasize important content. Ensure the infographic is engaging, aligned with your brand identity, and designed for responsiveness across devices.
-
Optimize image files for SEO. Use descriptive file names, relevant alt text, and appropriate image formats (like WebP, JPEG, SVG, or PNG).
-
Add social media sharing buttons and embed codes to encourage users to distribute your infographic.
-
Ensure the entire page is optimized. Use SEO best practices, such as structured header tags, concise meta descriptions, and well-crafted URLs.
What is an infographic?
An infographic is a visual representation of information that provides a clear and easy-to-understand topic overview. Infographics include:
- Bar graphs
- Pie charts
- Histograms
- Line charts
- Tree and network diagrams
- Mind maps
- Gantt charts
- How-to’s
- Comparisons
- Lists


As you can see from the examples above, infographics often use a combination of text, images, charts, graphs, and other visual elements.
The purpose of an infographic is to simplify complex information, present data in a visually appealing manner, tell a story, or communicate a message effectively and make it accessible even for non-technical users.
Where can you use infographics?
Infographics are a powerful tool for explaining complex topics and sustaining visitor attention. Here are some situations where they are useful:
- Summarizing a lengthy article
- Presenting research data
- Visualizing a timeline or changes over time
- Explaining the workflow
- Displaying survey data or statistics
- Comparing two or more options
- Making educational content easier to grasp and remember
How infographics can impact your SEO
Infographics can improve web traffic by 12% or more. SEO experts often include these visual representations as part of their optimization strategy.
First off, infographics help you earn organic backlinks. When you create a stunning, visually appealing infographic with tons of valuable stats and information, people will be eager to share it on their sites.
Adding an embed code to your website can make it easy for people to share your infographic on their blog posts or landing pages and provide proper attribution (and linking) back to its source.
Infographics also increase your chances of ranking well in image searches (a separate search channel and SERP feature). Check the SERP for your target keyword to see if it contains an image block. If it does, an infographic can help you gain extra clicks and traffic.
Infographics can also help in spreading awareness about your brand. Infographics can describe your brand, products, or services in an engaging way.
They are a popular visual medium that can help you increase your article’s overall value and shareability.Infographics are also a vital content strategy tool. Check out our Content SEO Course to explore other essential tools and techniques to boost your content creation skills.
How to optimize your SEO infographic for search
Once you’ve found a post that’s a good candidate for an infographic, you must optimize your infographic for search.
Take the following steps to get the most out of every infographic you create.
1. Do your keyword research
Creating content with SEO in mind always begins with picking the right keywords. Infographics are no exception because you must optimize them for a particular keyword.
If you already have a text to supplement with an infographic, you should also have a list of keywords to choose from. The first step to creating an infographic is conducting keyword research.
Using keyword research tools makes this process a lot easier. You can find keywords using SE Ranking by entering the seed keyword in the Keyword Research tab. This gives you a complete list of suggested terms and in the appropriate section.

Here are some things to consider when looking for the right keyword:
- Relevancy. Ensure that the keyword you’re targeting is aligned with your goal, which should naturally be aligned with your audience’s interests.
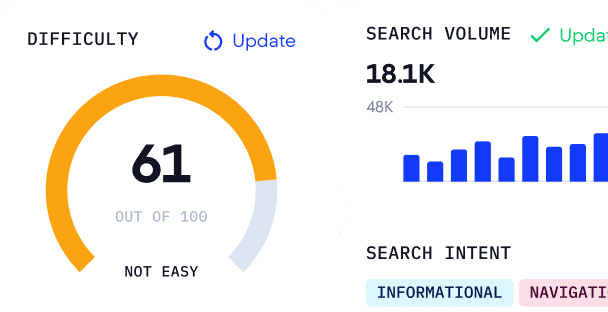
- Search volume. Consider the popularity of the keyword you’re targeting. While you might want to rank for a certain term, it may not be what people search for.
- Difficulty. Find out how challenging it is to rank for a particular keyword in SERPs. High-competition keywords with many authoritative websites vying for the top spots in search results are generally considered more difficult to rank for, while low-competition keywords with fewer competing websites are less difficult.
- Long-tail keywords. If you cover similar topics, using long-tail keywords can help you target specific (and niche) search queries. These have lower competition and are more relevant to your content. Using long-tail keywords can help you attract a more precise and engaged audience.
Additionally, you can explore competitor websites to discover popular subjects.
After picking the most promising keyword, use it to guide you when creating your infographic. Ensure it matches the user intent behind the keyword. The copy on your infographic copy should include a brief visual solution to the user’s problem as described by the keyword.
Insert the keyword (or don’t) into your infographic copy based on how well it fits. Try to avoid keyword stuffing. This technique makes the text sound unnatural and will bring you more harm than good.
Carefully consider your keyword. You’ll need it to accomplish the next steps.
2. Prepare engaging, well-researched content
Writing content for infographics is different from writing blog content: the space is limited, and the content is generally written in short phrases and sentences. Here are some useful infographic writing tips:
- Start with a compelling, concise, and clear headline. One proven strategy is to use numbers in your infographic title, like “10 crucial marketing metrics for SaaS” or “Graphic Design trends for 2025.”
- Write an introduction that summarizes your text and explains what to expect from your infographic. Explain the infographic’s goal and key takeaways.
- Outline your content by using a subheading for each part of your infographic. Always label every visual or list.
- Use short and simple sentences, and don’t use too much professional language. Keep your infographics easy to understand. Be straightforward and avoid “fluff” in your content.
- Avoid lengthy text blocks and keep your content easy to scan. Use bullet points to highlight key information, numbered lists for instructions, and incorporate diagrams and other visuals to convey information more efficiently.
- Support all your statements with data. Incorporate dates and statistics to illustrate your points. Cite experts and include source links to gain extra trust.
- Always add a conclusion. Write a brief summary or list of key takeaways to wrap up your infographic effectively.
- Add a call-to-action if applicable. Make it visually prominent and simple.
3. Design infographics that are attractive to users
Whether you choose an online infographic builder or work with a designer, you still need to follow the basic rules of making content visually engaging and memorable.
- Choose a consistent color scheme that complements your content and brand and avoid using too many colors, which can make your infographic look cluttered. If you are preparing infographics for a company, use your logo, brand colors, and fonts to align with the brand identity
- Use legible fonts and keep the text simple and concise. Avoid using long paragraphs or small, difficult-to-read font sizes. Use headings, subheadings, and bullet points to make your information easily digestible.
- Use contrasting font sizes and colors to emphasize headlines and important parts, or to compare alternatives.
- Use icons and illustrations to make your content visually striking.
- Use columns and alternating background colors to split sections visually.
- Highlight important details with colors and varied font styles to make key phrases stand out.
- Consider designing infographics with responsive design principles in mind. They should be easily viewable on desktop computers, tablets, and smartphones.
4. Optimize the infographics file
An infographics file is an image file, so you must apply the best image SEO practices to it:
Name your file accordingly
Your file name shouldn’t just be something like “infographic_01_final.jpg.” Instead, include the keyword that best describes your infographic in the file name.
While Google can’t read the actual content of your infographic, it can read your infographic’s file name, so the file should be titled something like “increase-blog-traffic-infographic.jpg”.

Let’s take the small infographic above as an example. The file name explains the blog post’s topic and describes the infographic’s content. This helps search engines understand what the infographic is about and increases its chances of ranking in image search.
Add your alt text
Another way to let search engines know what kind of information your infographic offers is by adding an alt tag, which is used within the HTML code of a page to describe what an image represents.
As with the filename, use your keyword in the alt tag to help Google understand which search terms are relevant to your infographics. A good alt text would be something like “Infographic about increasing blog traffic.”
If an image fails to load, users will see the alternative text you suggested in the alt tags. Also, alt tags ensure that your content is accessible to all users, including people who use screen readers to browse the Internet.
See alt text in action below.

For example, the website Visme has an article about marketing plans. This article has an infographic outlining a specific plan for video creation in marketing. We used alt text that explained what the infographic showed, and we also included the word “template” in the alt tag since this specific example is editable.
Use the correct file type and resolution
One useful infographic design technique is creating a responsive layout across different screen sizes. High-quality, high-resolution images are prioritized by search engines and appreciated by users.
For Google, large images must be at least 1200 pixels wide. Compressing your image file can also help the image load faster without losing quality.
You can use various formats for your infographics, but the best ones for ranking on Google are WebP, JPEG, SVG, and PNG.
5. Allow sharing
Encourage users to share your content by adding social buttons. Include links to popular social media platforms like Facebook, LinkedIn, X (formerly Twitter), and Pinterest. Provide an embed code option to allow other webmasters to integrate your infographic into their websites. This will drive more visitors to your website and result in external backlinks.
6. Make sure the whole page is well-optimized
If you want your infographic to rank well, ensure the entire page it’s published on is optimized for search. Follow these steps to ensure high rankings for both the infographic and the web page it’s placed on.
Optimize your header tags
To even further stress that your blog post contains a large infographic that people may want to check out, you can include the word “infographic” in your title, which is normally marked as <h1> header tag in the HTML code. Google will also spot the keyword when scanning the page.
You can make the word “infographic” fit into the title. We demonstrated how to do this on Visme’s blog in an informational article/infographic on COVID-19.

You can place the word “infographic” in the square brackets at the end of your title like in the example above. Alternatively, you can use a semicolon in your title: “Infographic: Your Online Course Creation Process.”
Another option would be to include the infographic keyword in the <h2> header tag instead of the <h1> tag. Naturally, your infographic should be placed in this particular section of the text beneath the heading. Just like with the <h1> tag, you’ll want to come up with a compelling heading that best describes the content of a section and then add the word “infographic” to it.
Here’s another example of how we accomplished this at Visme:

Pay attention to your article URL
Your article’s URL should be well-structured and contain your focus keyword, and if an infographic is also the focus of your blog post, feel free to include the word “infographic” in it.
However, you don’t have to do this every time you create a post featuring an infographic. Pay attention to the URL length and keep your URL slug from 3 to 5 words long. If you have a lengthy keyword in your URL (e.g. how to create a Zoom meeting), don’t fit an extra word into it.
Write your meta description
Writing the perfect meta description is an art. You’re given 155 characters to perfectly summarize your piece of content, include your focus or secondary keyword, and entice searchers to click through to your post.
But we have faith in you! Just remember to stay concise and to the point. Your meta description isn’t the place to get flowery with your copy.
Instead, use one sentence to summarize your content and another as a call-to-action. Do your best to include the word “infographic”.
Ensure a healthy word count in your post
You don’t want your infographic to be the only content in your blog post. It should only enhance your post, helping to point out the most important snippets of information.
Search engines like long-form content, so consider creating a 1,000-2,000+ word article to accompany your infographic. It shouldn’t be the core content of your post.
The text before and after your infographic should provide additional details beyond what is depicted in the infographic. Using relevant keywords is also a good idea.
We’ve created an infographic to summarize what a good 2,000-word article looks like and included it below.
Conclusion
Infographics can be a valuable asset to your blog post and SEO strategy, but only if you optimize them properly. Infographics can help you earn organic backlinks, increase your chances of ranking well in image searches, and spread awareness about your brand.
To optimize your infographic for search, start with keyword research and choosing relevant, low-competition keywords. Name your infographic file with the selected keyword and apply the keyword to your alt text, captions, and descriptions. To reach a broader audience, promote your infographic on social media platforms and other relevant websites. Following these steps ensures that your infographic reaches the right people, generates more web traffic, and enhances your blog post’s overall value and shareability.